Review
. 2023 May 30:14:1196783.
doi: 10.3389/fphar.2023.1196783. eCollection 2023.

Hydroxychloroquine-induced Retinal Toxicity

Affiliations
Review

Hydroxychloroquine-induced Retinal Toxicity

Imran H Yusuf et al. Front Pharmacol. .

Abstract

Long-term use of hydroxychloroquine can cause retinopathy, which may result in severe and progressive visual loss. In the past decade, hydroxychloroquine use has markedly increased and modern retinal imaging techniques have enabled the detection of early, pre-symptomatic disease. As a consequence, the prevalence of retinal toxicity in long-term hydroxychloroquine users is known to be higher than was previously estimated. The pathophysiology of the retinopathy is incompletely characterised, although significant advances have been made in understanding the disease from clinical imaging studies. Hydroxychloroquine retinopathy elicits sufficient public health concern to justify the implementation of retinopathy screening programs for patients at risk. Here, we describe the historical background of hydroxychloroquine retinopathy and summarize its current understanding. We review the utility and limitations of each of the mainstream diagnostic tests used to detect hydroxychloroquine retinopathy. The key considerations towards a consensus on the definition of hydroxychloroquine retinopathy are outlined in the context of what is known of the natural history of the disease. We compare the current screening recommendations for hydroxychloroquine retinopathy, identifying where additional evidence is required, and the management of proven cases of toxicity. Finally, we highlight the areas for further investigation, which may further reduce the risk of visual loss in hydroxychloroquine users.

Keywords: hydroxychloroquine; hydroxychloroquine retinopathy; optical coherence tomography; retinal imaging; retinopathy; screening; toxicity.


Conflict of interest statement

The authors declare that the research was conducted in the absence of any commercial or financial relationships that could be construed as a potential conflict of interest.

Figures

FIGURE 1
FIGURE 1
The molecular structure of chloroquine (left) and hydroxychloroquine (right).
FIGURE 2
FIGURE 2
A representative case with parafoveal hydroxychloroquine retinopathy. Color fundus photographs (CFP) show parafoveal pigmentary changes. Fundus autofluorescence (FAF) images illustrate more prominent bull’s-eye macular lesion, represented as parafoveal rings of hypo autofluorescence (yellow arrowheads) and hyper autofluorescence (white arrowheads). Optical coherence tomography (OCT) images demonstrate photoreceptor loss (white arrowheads) and thinning of retinal pigment epithelium (RPE)/Bruch’s membrane complex (yellow arrowhead).
FIGURE 3
FIGURE 3
Classification of hydroxychloroquine retinopathy according to the pattern and severity of retinopathy. Eyes with hydroxychloroquine retinopathy can be divided into those with early (patchy photoreceptor defects without retinal pigment epithelium [RPE] involvement), moderate (photoreceptor damage constituting a partial or full ring [>180°] without RPE involvement), and severe (combined RPE damage) retinopathy. Yellow and white arrowheads indicate photoreceptor (represented as photoreceptor loss on optical coherence tomography [OCT] and hyper autofluorescence on fundus autofluorescence [FAF]) and retinal pigment epithelium damages (shown as an attenuated and thinned RPE/Bruch’s membrane complex line on OCT and hypo autofluorescence on FAF), respectively. Para = parafoveal retinopathy; Peri = pericentral retinopathy.
FIGURE 4
FIGURE 4
Fundus autofluorescence (FAF; left) and optical coherence tomography (OCT; right) images over time after drug cessation in selected early and severe eyes with hydroxychloroquine retinopathy. The lesions in FAF and OCT images are stable in early (top) cases, whereas the severe case (bottom) shows continuous progression threatening to the macula. (Modified from Ahn et al. Ophthalmology. 2021; 128:889-898).
FIGURE 5
FIGURE 5
Cumulative risk (A) and yearly risk (B) of hydroxychloroquine retinopathy. This Kaplan-Meier curve shows different cumulative risk over time (and also yearly risk) according to the daily dose. (Reprinted with permission from Melles RB, Marmor MF. JAMA Ophthalmol 2014; 132:1453-60).
FIGURE 6
FIGURE 6
Automated visual field test results in patients with parafoveal (left) and pericentral (middle and right) hydroxychloroquine retinopathy. Numbers (10-2 or 30-2) indicate protocols used for the test. (Left) A case with moderate parafoveal retinopathy. The 10-2 field shows largely defined (partial ring) scotoma, while 30-2 shows less remarkable finding. (Middle) A case with early pericentral retinopathy. The 10-2 field shows normal field; 30-2 shows some patchy losses beyond 20°. (Right) A case with severe pericentral retinopathy. 10-2 shows constriction now extending in to about 5°; 30-2 shows ring-shaped losses sparing the central 10°.
FIGURE 7
FIGURE 7
Multifocal electroretinography (mfERG) in a patient with parafoveal hydroxychloroquine retinopathy. Fundus autofluorescence (left) shows hypoautofluorescent ring on the parafoveal area. Optical coherence tomography (top right) reveals photoreceptor loss on the areas. On mfERG (bottom right), amplitude reduction is remarkable on the parafoveal area.
FIGURE 8
FIGURE 8
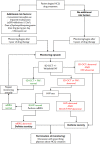
Screening algorithms of hydroxychloroquine retinopathy as reported by the American Academy of Ophthalmology in 2016. FAF = fundus autofluorescence; mfERG = multifocal ERG; SD-OCT = spectral-domain optical coherence tomography; VF = automated visual field.
FIGURE 9
FIGURE 9
Monitoring algorithm of hydroxychloroquine retinopathy recommended by the Royal College of Ophthalmologists (proposed 2020 revision). Note the absence of baseline testing and the retinal imaging-based monitoring algorithm. HVF—Humphrey visual field; SD-OCT—Spectral domain optical coherence tomography imaging; mfERG—multifocal electroretinography; FAF—fundus autofluorescence imaging.
FIGURE 10
FIGURE 10
Recovery of hydroxychloroquine retinopathy in an eye with early retinopathy following drug cessation. Optical coherence tomography (right) images indicate a decrease in the length of photoreceptor defects (indicated by arrowheads). This partial recovery is also remarkable in fundus autofluorescence (left) in the parafovea (arrowhead). (Reprinted with permission from Ahn et al. Ophthalmology. 2021; 128:889-898).

References

    1. Abarientos C., Sperber K., Shapiro D. L., Aronow W. S., Chao C. P., Ash J. Y. (2011). Hydroxychloroquine in systemic lupus erythematosus and rheumatoid arthritis and its safety in pregnancy. Expert Opin. Drug Saf. 10, 705–714. 10.1517/14740338.2011.566555 - DOI - PubMed
    1. Ahn S. J., Joung J., Lee B. R. (2019a). En face optical coherence tomography imaging of the photoreceptor layers in hydroxychloroquine retinopathy. Am. J. Ophthalmol. 199, 71–81. 10.1016/j.ajo.2018.11.003 - DOI - PubMed
    1. Ahn S. J., Joung J., Lee B. R. (2020). Evaluation of hydroxychloroquine retinopathy using ultra-widefield fundus autofluorescence: Peripheral findings in the retinopathy. Am. J. Ophthalmol. 209, 35–44. 10.1016/j.ajo.2019.09.008 - DOI - PubMed
    1. Ahn S. J., Joung J., Lim H. W., Lee B. R. (2017a). Optical coherence tomography protocols for screening of hydroxychloroquine retinopathy in asian patients. Am. J. Ophthalmol. 184, 11–18. 10.1016/j.ajo.2017.09.025 - DOI - PubMed
    1. Ahn S. J., Ryu S. J., Joung J. Y., Lee B. R. (2017b). Choroidal thinning associated with hydroxychloroquine retinopathy. Am. J. Ophthalmol. 183, 56–64. 10.1016/j.ajo.2017.08.022 - DOI - PubMed