

Published Erratum
doi: 10.3389/fphar.2023.1199204.
eCollection 2023.
Corrigendum: Shu-Xie decoction alleviates oxidative stress and colon injury in acute sleep-deprived mice by suppressing p62/KEAP1/NRF2/HO1/NQO1 signaling
Affiliations
- PMID: 37324486
- PMCID: PMC10262188
- DOI: 10.3389/fphar.2023.1199204
Item in Clipboard
Published Erratum
Corrigendum: Shu-Xie decoction alleviates oxidative stress and colon injury in acute sleep-deprived mice by suppressing p62/KEAP1/NRF2/HO1/NQO1 signaling
Front Pharmacol.
.
Abstract
[This corrects the article DOI: 10.3389/fphar.2023.1107507.].
Keywords: NRF2; ROS; oxidative stress; sleep deprivation; traditional Chinese medicine.
Copyright © 2023 Wang, Li, Liu, Zhang, Huang, Cai, Jia, Huang, Ke, Liu and Yang.
Figures
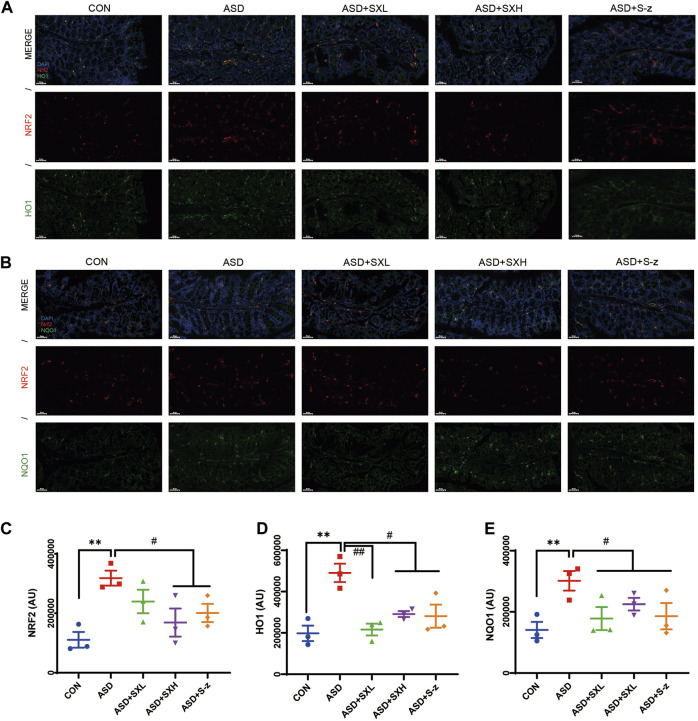
Immunofluorescence analysis of NRF2 (red), HO1 and NQO1 (green) in colon mucosal layers (×400 magnification). (A) Representative fluorescence confocal images show NRF2 and HO1 staining in the colon sections of mice belonging to the CON, ASD, ASD + SXL, ASD + SXH, and ASD + S-z groups. The nuclei were stained with DAPI (blue). (B) Representative fluorescence confocal images show NRF2 and NQO1 staining in the colon sections of mice belonging to the CON, ASD, ASD + SXL, ASD + SXH, and ASD + S-z groups. The nuclei were stained with DAPI (blue). (C) Quantitative analysis of NRF2 fluorescence. (D) Quantitative analysis of HO1 fluorescence. (E) Quantitative analysis of NQO1 fluorescence. The immunofluorescence signal intensity in the images was quantified using the ImageJ software. n = 3 per group. The experiment was repeated three times. The data are shown as mean ± S.E.M. **
p < 0.01 vs CON group; #
p < 0.05, ##
p < 0.01 vs ASD group. Scale bar: 50 μm.
Erratum for
-
Shu-Xie decoction alleviates oxidative stress and colon injury in acute sleep-deprived mice by suppressing p62/KEAP1/NRF2/HO1/NQO1 signaling.Front Pharmacol. 2023 Feb 6;14:1107507. doi: 10.3389/fphar.2023.1107507. eCollection 2023. Front Pharmacol. 2023. PMID: 36814500 Free PMC article.
Publication types
LinkOut - more resources
Full Text Sources
Miscellaneous