. 2023 May 15;26(6):106887.
doi: 10.1016/j.isci.2023.106887. eCollection 2023 Jun 16.

Biological fractionation of lithium isotopes by cellular Na+/H+ exchangers unravels fundamental transport mechanisms

Affiliations

Biological fractionation of lithium isotopes by cellular Na+/H+ exchangers unravels fundamental transport mechanisms

Mallorie Poet et al. iScience. .

Abstract

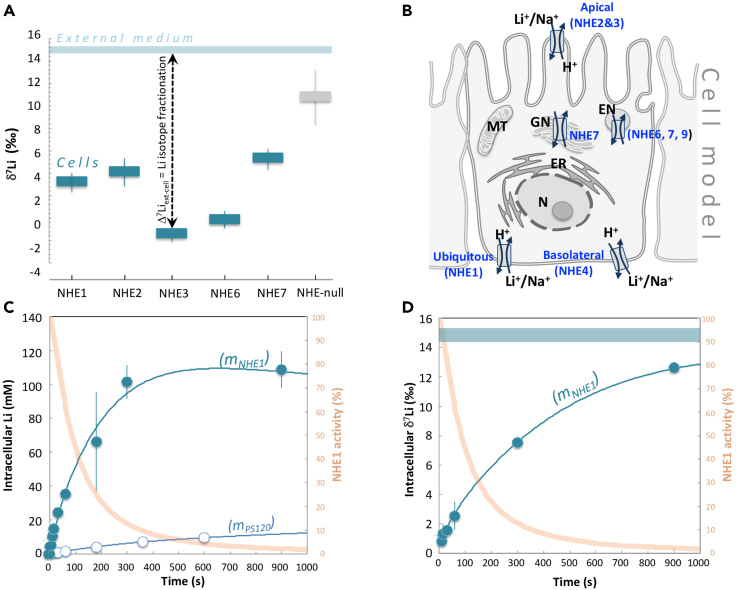
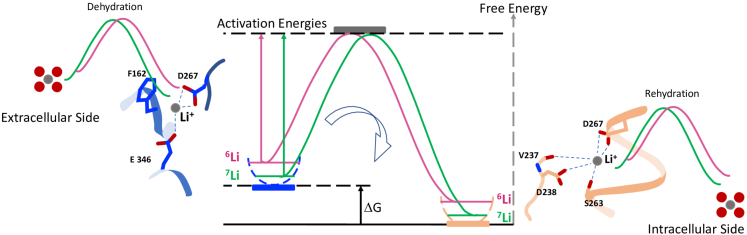
Lithium (Li) has a wide range of uses in science, medicine, and industry, but its isotopy is underexplored, except in nuclear science and in geoscience. 6Li and 7Li isotopic ratio exhibits the second largest variation on earth's surface and constitutes a widely used tool for reconstructing past oceans and climates. As large variations have been measured in mammalian organs, plants or marine species, and as 6Li elicits stronger effects than natural Li (∼95% 7Li), a central issue is the identification and quantification of biological influence of Li isotopes distribution. We show that membrane ion channels and Na+-Li+/H+ exchangers (NHEs) fractionate Li isotopes. This systematic 6Li enrichment is driven by membrane potential for channels, and by intracellular pH for NHEs, where it displays cooperativity, a hallmark of dimeric transport. Evidencing that transport proteins discriminate between isotopes differing by one neutron opens new avenues for transport mechanisms, Li physiology, and paleoenvironments.

Keywords: Biochemistry; Biological sciences; Isotope chemistry.


Conflict of interest statement

The authors declare no competing interest.

Figures

None
Graphical abstract
Figure 1
Figure 1
Compilation of published Li isotope compositions measured in biologic materials and their environments By convention, Li isotope compositions are expressed in δ7Li (‰) = (7Li/6Li)/(7Li/6Li)LSVEC – 1) x 1000, LSVEC being the international standard). Biologic samples are: in green, terrestrial plants and corresponding soil solutions, in pink, organs of model mammals (sheep), and corresponding diet in purple; in blue, living and modern shells produced by marine organisms, and soft tissues of marine species,,, and seawater in dark blue. Note that the ocean is currently homogeneous in terms of Li concentration (26 μM) and δ7Li (31.2‰ +/− 0.3‰). The range displayed by all the biologic samples is similar as the one estimated for the global Earth.
Figure 2
Figure 2
Measurements of Li isotopic fractionation by Na+/H+ exchangers and channels (A) Li isotope fractionation by Na+/H+ exchangers. In blue, δ7Li values measured in fibroblast cells expressing NHE1, NHE2, NHE3, NHE6, and NHE7, after 1 min of Li uptake. Li uptake experiments were also performed using NHE deficient PS120 fibroblasts (in gray, NHE-Null). The light blue bar displays the constant δ7Li value measured for the external Li uptake solution (15 mM Li). All experiments were performed at 37°C (See Methods in supplemental information). Note the large Li isotopic fractionations (Δ7Li) between NHE-expressing cells and the external medium solution. Error bars represent ± SEM. (B) Schematic representation of the cellular localization of NHEs. Li+ is an alkali element that is essentially mobile in the outer and inner cellular media. NHE1 is a ubiquitous transporter involved in pH and volume regulation. It is expressed mostly basolaterally in epithelia. NHE2 and NHE3 are apically expressed in epithelial cells, while NHE6 and NHE7 are mostly intracellular and expressed in the Golgi Network and endosomal compartments. N: Nucleus, ER: Endoplasmic Reticulum, GN: Golgi Network, MT: Mitochondria. (C) NHE1 kinetics of Li transport. In dark blue, Li concentrations measured in NHE1 expressing fibroblast, as a function of the external Li uptake duration. The extracellular solution is the same as in Figure 1A (15 mM Li). In light blue, are reported the same experiments for PS120 cells (NHE-Null). Blue lines (mNHE1, mPS120) display the transport model results fitting all data points (see text and supplemental information). In orange is shown the measured NHE1 activity as a function of time (see supplemental information Methods). Error bars represent ± SEM. (D) NHE1 kinetics of Li isotopes transport. δ7Li values (in blue) measured in NHE1 expressing fibroblast as a function of the external Li uptake duration. The blue line (mNHE1) displays the NHE1 transport model results, fitting well all data points (see text and supplemental information). The external solution (medium) is the same as in Figure 1A, with a constant δ7Li value over the experiment duration. In orange is shown the measured NHE1 activity as a function of time (see Methods). All experiments are performed at 37°C. At 60 s, experiments were reproduced at 20°C (supplemental information). Error bars represent ± SEM.
Figure 3
Figure 3
Dose responses for Li isotopic fractionation by NHE1 (A and B) Intracellular pH dependency on Li isotopic transport by NHE1. Cell Li concentration (a) and δ7Li value (b) as a function of intracellular pH. Li uptake was performed during 1 min, at various cytosolic pH for NHE1-expressing fibroblasts. See Methods in supplemental information for details on cell pH control and calibration. The Li transport and associated Li isotope fractionations are maximum at the lowest intracellular pH when NHE1 is at its maximal rate. Total Li uptake was fitted using the MWC equation for a dimeric NHE1, with Kh = 0.17 10−7 M, Kl = 36 10−7 M, L0 = 878.6 ± 35.3 (4.02%), Vmax = 55.4 ± 0.83 (1.51%) and R2 = 0.981. Error bars represent ± SEM. (C and D) Dose response for extracellular lithium and cooperative behavior. δ7Li values of NHE1-expressing cells were measured after 1-min incubation at different extracellular Li concentrations (supplemental information). Note the steady decrease of δ7Li as extracellular Li increases, highlighting the unexpected cooperativity of the Li transport process d. Simplified scheme illustrating how a dimeric NHE1, binding external two 6Li+ (in pink), two 7Li+ (in green) or a mixing of both, before exchanging them with H+ will favor the lighter isotope transport. Error bars represent ± SEM. (E and F) Impact of external Na concentration on Li isotopic transport by NHE1. Intracellular Li concentration (c) and δ7Li value (d) as a function of external Na concentrations. The presence of Na in the external medium decreases the Li transport, due to competition effects. In contrast, the cell δ7Li value evolves little, showing a slight increase only. Error bars represent ± SEM.
Figure 4
Figure 4
Extracts of the MD simulation movie showing NHE1 symmetrical dimer (in purple), with lipids (POPC, in blue) (A–C)H20 and Li+ (in yellow) along the ion translocation pathway (see Video S1). Li+ ions at low potential energy sites within the translocation pathway are marked by blue arrows. A, B, and C images can be seen at 3.8, 12.6, and 23.2 s (movie time) in Video S1, respectively Note the very dynamic structure of the proteins and the different positions of the lithium ions.
Figure 5
Figure 5
Schematic illustration of the NHE1 isotopic effect During ion dehydration/hydration and translocation between outward and inward-facing local energy grooves, Li+ ions have to cross microscopic activation energy barriers that are smaller for the lighter 6Li+ (pink) than for the slower and heavier 7Li+ ion (green). The outward facing conformation (blue) is extrapolated from the NHE1 guanidinium binding site, the cytosol facing conformation (light brown) corresponds to the thallium binding, as described both in.

References

    1. Balter V., Vigier N. Natural variations of lithium isotopes in a mammalian model. Metallomics. 2014;6:582–586. - PubMed
    1. Burton K.W., Vigier N. Handbook of Environmental Isotope Geochemistry. Vol. 1. 2011. Lithium isotopes as tracers in marine and terrestrial environments Springer-Verlag; pp. 41–60.
    1. Penniston-Dorland S., Liu X.-M., Rudnick R.L. Lithium isotope geochemistry. Rev. Mineral. Geochem. 2017;82:165–217.
    1. Roberts J., Kaczmarek K., Langer G., Skinner L.C., Bijma J., Bradbury H., Turchyn A., Lamy F., Misra S. Lithium isotopic composition of benthic foraminifera: a new proxy for paleo-pH reconstruction Geochim. Cosmochim. Acta. 2018;236:336–350.
    1. Vigier N., Rollion-Bard C., Levenson Y., Erez J. Lithium isotopes in foraminifera shells as a novel proxy for the ocean dissolved inorganic carbon (DIC) C. R. Geosci. 2015;347:43–51.