Review
. 2022 Jan 14;2(1):20210112.
doi: 10.1002/EXP.20210112. eCollection 2022 Feb.

Recent progress in self-powered multifunctional e-skin for advanced applications

Affiliations
Review

Recent progress in self-powered multifunctional e-skin for advanced applications

Yunfeng Chen et al. Exploration (Beijing). .

Abstract

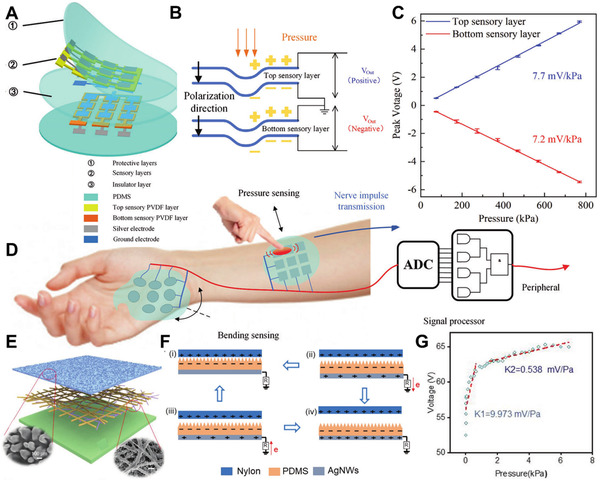
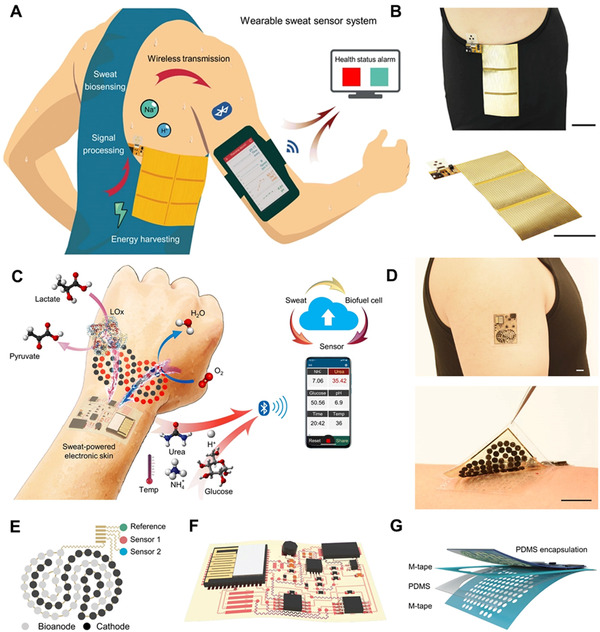
Electronic skin (e-skin), new generation of flexible wearable electronic devices, has characteristics including flexibility, thinness, biocompatibility with broad application prospects, and a crucial place in future wearable electronics. With the increasing demand for wearable sensor systems, the realization of multifunctional e-skin with low power consumption or even autonomous energy is urgently needed. The latest progress of multifunctional self-powered e-skin for applications in physiological health, human-machine interaction (HMI), virtual reality (VR), and artificial intelligence (AI) is presented here. Various energy conversion effects for the driving energy problem of multifunctional e-skin are summarized. An overview of various types of self-powered e-skins, including single-effect e-skins and multifunctional coupling-effects e-skin systems is provided, where the aspects of material preparation, device assembly, and output signal analysis of the self-powered multifunctional e-skin are described. In the end, the existing problems and prospects in this field are also discussed.

Keywords: coupling effects; electronic skin; self‐powered sensor; single effect.


Conflict of interest statement

There are no conflicts to declare.

Figures

FIGURE 1
FIGURE 1
Relationship between different energy sources and applications of self‐powered multifunctional e‐skin. Upper left: Reproduced with permission.[ 78 ] Copyright 2015, Springer Nature. Up: Reproduced with permission.[ 106 ] Copyright 2020, American Association for the Advancement of Science. Upper right: Reproduced with permission.[ 74 ] Copyright 2015, American Chemical Society. Bottom right: Reproduced with permission.[ 87 ] Copyright 2020, American Association for the Advancement of Science. Down: Reproduced with permission.[ 67 ] Copyright 2020, American Chemical Society. Bottom left: Reproduced with permission.[ 85 ] Copyright 2019, American Chemical Society
FIGURE 2
FIGURE 2
Response of electronic skin to mechanical energy. (A) Illustration of the piezoelectric tactile sensor array. (B) Schematic of piezoelectric sensory films. (C) Output peak voltage versus normal force from 80 to 750 kPa. (D) Schematic of mechanical signal detection by the sensor array. Reproduced with permission.[ 61 ] Copyright 2021, Wiley‐VCH. (E) The detailed structure of the TENG. (F) Schematics of the operating principle for the TENG. (G) Output voltage of the TENG against applied pressure. Reproduced with permission.[ 65 ] Copyright 2020, Wiley‐VCH
FIGURE 3
FIGURE 3
Response of electronic skin to light intensity. (A) Sketch map of the self‐powered UV photodetector. (B) Energy band chart of the PEDOT:PSS/ZnO heterojunction under light. (C) Photoresponse under varying incident light intensity values. (D) Actual testing of devices outdoors and indoors. Reproduced with permission.[ 67 ] Copyright 2020, American Chemical Society. (E) Diagram and optical photographs of the infrared sensor. (F) Working mechanism of e‐skin response to IR on/off irradiation. (G) Cyclic V OC of the photodetectors under intermittent IR lighting with different intensity values. (H) Reduplicative V OC and temperature signals of the e‐skin under intermittent IR. Reproduced with permission.[ 68 ] Copyright 2020, American Chemical Society
FIGURE 4
FIGURE 4
Response of electronic skin to light intensity. (A) Schematic diagram of the RFID tag. (B) Application of the RFID‐based wireless sensor system. (C) Reflection calibration and (D) Phase shift calibration curves of the three tags against H2 concentration. Reproduced with permission.[ 74 ] Copyright 2015, American Chemical Society. (E) Chart of the RFID sensor tag with carboxyl functional groups covalently bonded to the aluminum tag. (F) Relationship between NH3 concentration and reflectance change. Change in reflectance properties of wireless sensors response to (G) acetic acid and (H) ammonia. Reproduced with permission.[ 75 ] Copyright 2016, American Chemical Society
FIGURE 5
FIGURE 5
Response of electronic skin to temperature. (A) Schematic chart of temperature sensing mechanism. (B) Optical figure of an arm‐wrestling between a prosthetic hand and an adult woman. The right figure shows the temperature mapping plots of pixel signals during the arm‐wrestling. (C) Output voltage values of the sensor to a biased temperature gradient range from 0 to 100 K. Reproduced with permission.[ 78 ] Copyright 2015, Springer Nature. (D) Schematic of the hand‐shaped e‐skin sensing system. (E) An amplified view of a thermoelectric unit. (F) The relationship between load voltages and different temperature gradients. Reproduced with permission.[ 79 ] Copyright 2020, Wiley‐VCH
FIGURE 6
FIGURE 6
Response of electronic skin to chemical energy. (A) The compositions of the stretchable lactate BFC. (B) Power‐concentration calibration chart of glucose. (C) The self‐generated current response against lactate concentration. (D) Response of the BFC sensor to (a) 5 mmol L−1 lactate, (b) 84 mmol L−1 creatinine, (c) 10 mmol L−1 ascorbic acid, (d) 0.17 mmol L−1 glucose, and (e) 59 mmol L−1 uric acid. Reproduced with permission.[ 84 ] Copyright 2016, The Royal Society of Chemistry. (E) Polarization of PDA with applied voltage in a humid environment. (F) The self‐powered wearable sensing system. (G) Resistance of PDA membrane against RH variation. (H) Output voltage of the device to four different RH. Reproduced with permission.[ 85 ] Copyright 2019, American Chemical Society
FIGURE 7
FIGURE 7
Integrated self‐powered electronic skin. (A) Diagram of the sensor system for real‐time health monitoring. Reproduced with permission.[ 86 ] Copyright 2020, American Association for the Advancement of Science. (B) Optical photos of the sweat sensor platform attached on a human torso. (C) Diagram of the biofuel‐powered e‐skin. (D) Optical photographs of the e‐skin on a healthy adult's arm. Schematic plots of (E) the flexible sensor and (F) the soft e‐skin interface. (G) System‐level encapsulation for biofluid sampling. Reproduced with permission.[ 87 ] Copyright 2020, American Association for the Advancement of Science
FIGURE 8
FIGURE 8
Piezo‐triboelectric coupling affects self‐powered electronic skin. (A) Structural sketch, (B) optical photograph, (C) working principle of the hybrid e‐skin. (D) Sensing performances of different materials. (E) Voltage signal of the e‐skin with different distances between PI. (F) Pressure sensitivity of the 1 cm × 1 cm e‐skin. (G) The stability of the hybrid sensor. Reproduced with permission.[ 93 ] Copyright 2020, Elsevier Ltd. (H) Exploded view of the hybrid sensor. The inset is an optical picture of the sensor. (I) Working principle of the e‐skin with the contraction‐release cycle. (J) Piezoelectric and triboelectric V oc signals, and the overlapped hybrid signal. (K) Voltage output of the wearable hybrid sensor under pressure on skin. The corresponding sensitivities are marked in the chart. Reproduced with permission.[ 94 ] Copyright 2021, Wiley‐VCH
FIGURE 9
FIGURE 9
Double coupling affects electronic skin for simultaneous temperature and pressure sensing. (A) Structure of the temperature‐pressure dual‐parameter sensor and the sensing mechanism. (B) Optical photo of the folded sensor. (C) Sensitivity of the sensor under varying applied pressure. (D) The relationship between the sensor against varying temperature differences detected. The inset shows the temperature sensitivity. Reproduced with permission.[ 95 ] Copyright 2019, The Royal Society of Chemistry. (E) Photographic and structural graphs of the inversely polarized P(VDF‐TrFE) based sensor. (F) Pressure and (G) temperature response of the device. (H) Diagram of triboelectric and pyroelectric mechanism. Current signals in (I) heating and (J) cooling states. Reproduced with permission.[ 97 ] Copyright 2020, Elsevier Ltd. (K) Photograph of bendable Ag/BTO/Ag pyro‐piezo‐electric sensing array. (L) Histogram of voltage outputs against varying temperature gradients and different applied pressures. (M) Voltage curves when the finger touches sensor array. Reproduced with permission.[ 98 ] Copyright 2019, Wiley‐VCH
FIGURE 10
FIGURE 10
Piezo‐biosensing coupled self‐powered e‐skin. (A) The e‐skin worn on human body for detecting perspiration ingredients. (B,C) Phtographs of the e‐skin attached on wrist). (D) Diagram of measuring the concentration of lactate, glucose, uric acid, and urea. (E) Overall picture of the e‐skin. (F–I) Relationships between the output voltages of different sensing units (modified by LO x , GO x , uricase, and urease, respectively) and four sweat components ((F) lactate, (G) glucose, (H) uric acid, (I) urea) concentration under various forces (20, 32, 40 N). (J–L) Sensing units with four enzymes modification on the interdigital electrodes can be bent with stress. LO x /ZnO nanowire in (M) pure water and (O) lactate aqueous solution without stress. Piezoelectric signal in (N) pure water and (P) lactate aqueous solution generated by stress. (Q) Enzymatic reactions between GO x and glucose, uricase and uric acid, urease, and urea, respectively. Reproduced with permission.[ 99 ] Copyright 2017, American Chemical Society
FIGURE 11
FIGURE 11
Multiple coupling effects self‐powered e‐skin. (A) Schematic and (B) picture of the coupled device. (C,D) Working principles of TENG‐PiENG (piezoelectric nanogenerator), and the PyENG (pyroelectric nanogenerator). (E) The smart visualized thermometer consists of the nanogenerator and LCD. Reproduced with permission.[ 100 ] Copyright 2018, Elsevier Ltd. (F) Structure of the sensor system. Relationships between output current of the e‐skin and (G) various light (H) intensities, pressures, and (I) temperature gradients. Optical photograph of (J) ice placed on the e‐skin, (K) the e‐skin under light of 405 nm, and ice cooling simultaneously. (L) Current values of the e‐skin under light of 405 nm only and simultaneous light and cooling. Reproduced with permission.[ 101 ] Copyright 2020, Elsevier Ltd
FIGURE 12
FIGURE 12
Multifunctional self‐powered e‐skin with multiple coupling effects. (A) Material selection and manufacturing process of the e‐skin. (B) Optical image of the e‐skin. (C) Piezoelectric effect for tactile perception. (D) The stress/oxygen/humidity sensing coupling effects. (E) Relationship between piezoelectric voltages and bending angles. (F) Relationship between the response variation and O2 concentration. The inset is the piezoelectric voltages against O2. (G) Relationship between the response variation and RH. The inset is the piezoelectric voltages against RH. Reproduced with permission.[ 102 ] Copyright 2016, Elsevier Ltd. (H) Schematic illustration of the e‐skin. (I) Photo of the 4 × 4 e‐skin array conformally worn on human arm. The inset demonstrates that the thickness of the e‐skin is only 0.28 mm. (J) Schematic mechanism of triboelectric layer for pressure‐sensing. (K) Voltage signal and pressure sensitivity of e‐skin with different components. (L) Power management circuit (LTC3588‐1) and the integrated system circuit. (M) The response signals of temperature sensing. Inset shows the TCR values. (N) Output signals of e‐skin against RH. The inset displays the linear response to RH. Reproduced with permission.[ 103 ] Copyright 2021, Wiley‐VCH
FIGURE 13
FIGURE 13
Application of self‐powered electronic skin in physiological health. (A) Structural design of e‐skin based on full‐fiber TENG. Reproduced with permission.[ 104 ] Copyright 2020, American Association for the Advancement of Science. (B) Diagram of skin‐actuated E‐tattoo skin. (C) Optical image of E‐tattoo skin under stretched. (D) Voltage response to frowning and blinking movement, (E) Breathing, (F) Sleeping monitoring. (G) Pulse signals, (H) Jugular venous pulse (JVP), (I) Sound recognition, (J) Finger bending angles and the arm flexion, (K) Foot movement states. Reproduced with permission.[ 105 ] Copyright 2021, Wiley‐VCH
FIGURE 14
FIGURE 14
Application of self‐powered electronic skin in HMI. (A) Schematic diagram of the SUE‐skin. (B) Visual output of touch state at different times. (C) The electrical output and the chromaticity diagram of the E‐skin under sliding. (D) Touch demonstration for playing the audio. Reproduced with permission.[ 106 ] Copyright 2020, American Association for the Advancement of Science. Schematic diagram of sensor recognition of (E) hand bending and (F) movement. Reproduced with permission.[ 87 ] Copyright 2020, American Association for the Advancement of Science
FIGURE 15
FIGURE 15
Application of self‐powered electronic skin in VR. (A)Working diagrams, structural diagrams, mechanism diagrams, and physical diagrams of virtual electro‐touch installations. (B) Unit structure diagram and (C) physical diagram of virtual electro‐touch system. (D) The ET interface tested by a girl. (E) Schematic diagram of the test. Reproduced with permission.[ 107 ] Copyright 2021, American Association for the Advancement of Science
FIGURE 16
FIGURE 16
Application of self‐powered electronic skin in AI. (A) The sensing system of tactile perception. (B) Schematic diagram of bionic tactile sensing system. (C) The time‐frequency graphs of e‐skin toward different sandpapers. (D) The accuracy and (E) The loss in 20 training epochs. (F) Confusion diagram of real label and predicted label. Reproduced with permission.[ 108 ] Copyright 2021, Elsevier Ltd

References

    1. Hammock M. L., Chortos A., Tee B. C., Tok J. B., Bao Z., Adv. Mater. 2013, 25, 5997. - PubMed
    1. You I., Kim B., Park J., Koh K., Shin S., Jung S., Jeong U., Adv. Mater. 2016, 28, 6359. - PubMed
    1. Dharmasena R. D. I. G., Jayawardena K. D. G. I., Saadi Z., Yao X., Bandara R. M. I., Zhao Y., Silva S. R. P., Proc. IEEE 2019, 107, 2118.
    1. Dahiya R., Proc. IEEE 2019, 107, 247.
    1. Wang F. X., Wang M. J., Liu H. C., Zhang Y. L., Lin Q. H., Chen T., Sun L. N., Adv. Mater. Interfaces 2020, 7, 2000536.

LinkOut - more resources