

Anthocyanin-rich blue potato meals protect against polychlorinated biphenyl-mediated disruption of short-chain fatty acid production and gut microbiota profiles in a simulated human digestion model
- PMID: 37324735
- PMCID: PMC10266533
- DOI: 10.3389/fnut.2023.1130841
Anthocyanin-rich blue potato meals protect against polychlorinated biphenyl-mediated disruption of short-chain fatty acid production and gut microbiota profiles in a simulated human digestion model
Abstract
Background: Polychlorinated biphenyls (PCBs) are ubiquitous environmental pollutants associated with a wide variety of adverse human health outcomes. PCB 126 and PCB 153 are among the most prevalent congeners associated with human exposure. Emerging studies have suggested that PCB exposure leads to lower gut microbial diversity although their effects on microbial production of health promoting short-chain fatty acids (SCFAs) has been scarcely studied. Blue potatoes are rich in anthocyanins (ACNs), which is a class of polyphenols that promote the growth of beneficial intestinal bacteria such as Bifidobacterium and Lactobacillus and increase the generation of SCFAs. A batch-culture, pH-controlled, stirred system containing human fecal microbial communities was utilized to assess whether human gut microbiota composition and SCFA production are affected by: (a) PCB 126 and PCB 153 exposure; and (b) ACN-rich digests in the presence and absence of the PCB congeners.
Methods: Anthocyanin-rich blue potato meals (11.03 g) were digested over 12 h with and without PCB 126 (0.5 mM) and PCB 153 (0.5 mM) using an in vitro simulated gut digestion model involving upper gastrointestinal digestion followed by metabolism by human fecal microbiota. Fecal digests were collected for analysis of gut microbial and SCFA profiles.
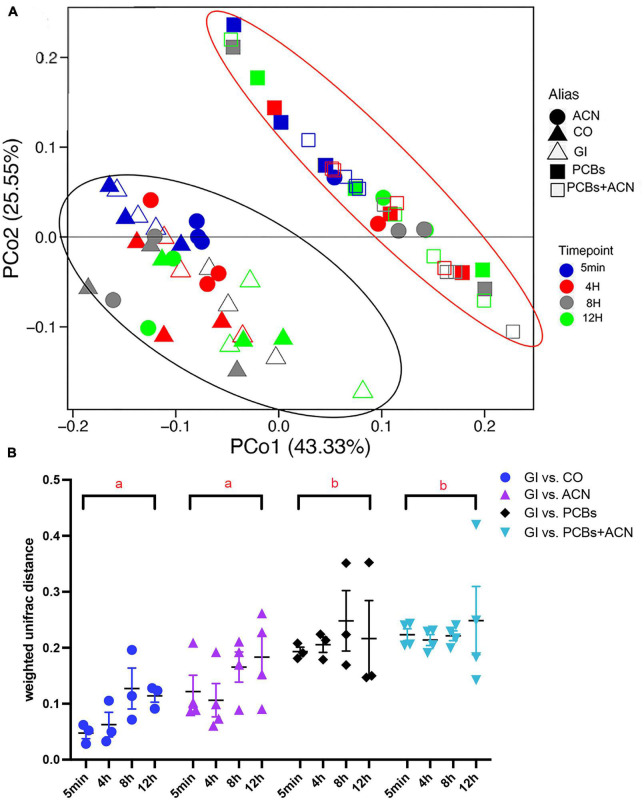
Results: Polychlorinated biphenyl-exposed fecal samples showed a significant (p < 0.05) decrease in species richness and a significantly (p < 0.05) different microbial community structure. PCB treatment was associated with an increased (p < 0.05) relative abundance of Akkermansia, Eggerthella, and Bifidobacterium and a decreased (p < 0.05) relative abundance of Veillonella, Streptococcus, and Holdemanella. ACN digests counteracted the altered abundances of Akkermansia and Bifidobacterium seen with the PCB treatment. PCB exposure was associated with a significant (p < 0.05) decrease in total SCFA and acetate concentrations. ACN digests were associated with significantly (p < 0.05) higher SCFA and acetate concentrations in the presence and absence of PCBs.
Conclusion: Human fecal matter exposed to PCB 126 and PCB 153 led to decreased abundance and altered gut microbiota profiles as well as lowered SCFA and acetate levels. Importantly, this study showed that prebiotic ACN-rich potatoes counteract PCB-mediated disruptions in human gut microbiota profiles and SCFA production.
Keywords: 16S rRNA gene amplicon sequencing; V3–V4 hypervariable regions; anthocyanins; gut microbiota; polychlorinated biphenyl 126; polychlorinated biphenyl 153; short-chain fatty acids; simulated gut model.
Copyright © 2023 Lu, MacPherson, Tremblay, Iskandar and Kubow.
Conflict of interest statement
CWM was employed in the Research and Development sector of Lallemand Health Solutions Inc., and NutraPharma Consulting Services, Inc. The remaining authors declare that the research was conducted in the absence of any commercial or financial relationships that could be construed as a potential conflict of interest.
Figures


Similar articles
-
Imbalance of Microbacterial Diversity Is Associated with Functional Prognosis of Stroke.Neural Plast. 2023 May 8;2023:6297653. doi: 10.1155/2023/6297653. eCollection 2023. Neural Plast. 2023. PMID: 37197229 Free PMC article.
-
Prebiotic effect of predigested mango peel on gut microbiota assessed in a dynamic in vitro model of the human colon (TIM-2).Food Res Int. 2019 Apr;118:89-95. doi: 10.1016/j.foodres.2017.12.024. Epub 2017 Dec 13. Food Res Int. 2019. PMID: 30898357
-
Simulated gastrointestinal digestion of beer using the simgi® model. Investigation of colonic phenolic metabolism and impact on human gut microbiota.Food Res Int. 2023 Nov;173(Pt 1):113228. doi: 10.1016/j.foodres.2023.113228. Epub 2023 Jul 4. Food Res Int. 2023. PMID: 37803545
-
Dietary fiber intervention on gut microbiota composition in healthy adults: a systematic review and meta-analysis.Am J Clin Nutr. 2018 Jun 1;107(6):965-983. doi: 10.1093/ajcn/nqy041. Am J Clin Nutr. 2018. PMID: 29757343
-
Dietary modulation of pubertal timing: gut microbiota-derived SCFAs and neurotransmitters orchestrate hypothalamic maturation via the gut-brain axis.J Endocrinol Invest. 2025 Jun 17. doi: 10.1007/s40618-025-02615-3. Online ahead of print. J Endocrinol Invest. 2025. PMID: 40526265 Review.
Cited by
-
Bioavailability of Anthocyanins: Whole Foods versus Extracts.Nutrients. 2024 May 7;16(10):1403. doi: 10.3390/nu16101403. Nutrients. 2024. PMID: 38794640 Free PMC article. Review.
References
-
- Agency for Toxic Substances and Disease Registry [ATSDR]. Toxicological profile for Polychlorinated Biphenyls (PCBs). Atlanta: U.S. Department of Health and Human Services; (2000). p. 1–4. - PubMed
-
- Singh K, Karthikeyan S, Vladisavljevic D, St-Amand A, Chan H. Factors associated with plasma concentrations of polychlorinated biphenyls (PCBs) and dichlorodiphenyldichloroethylene (p,p’-DDE) in the Canadian population. Int J Environ Health Res. (2019) 29:326–47. - PubMed
-
- Morales-Suarez-Varela M, Lopez Santana N, Marti Requena P, Beser Santos M, Peraita-Costa I, Llopis-Gonzalez A. Estimation of daily intake of polychlorinated biphenyls not similar to dioxins (NDL-PCB) from fish consumption in Spain in different population groups. Public Health Nutr. (2018) 21:2959–68. - PMC - PubMed
LinkOut - more resources
Full Text Sources