. 2023 May 29;19(9):2860-2878.
doi: 10.7150/ijbs.82417. eCollection 2023.

Limonin, a natural ERK2 agonist, protects against ischemic acute kidney injury

Affiliations

Limonin, a natural ERK2 agonist, protects against ischemic acute kidney injury

Xianke Zhou et al. Int J Biol Sci. .

Abstract

Acute kidney injury (AKI) is a refractory clinical syndrome with limited effective treatments. Amid AKI, activation of the extracellular signal-regulated kinase (ERK) cascade plays a critical role in promoting kidney repair and regeneration. However, a mature ERK agonist in treating kidney disease remains lacking. This study identified limonin, a member of the class of compounds known as furanolactones, as a natural ERK2 activator. Employing a multidisciplinary approach, we systemically dissected how limonin mitigates AKI. Compared to vehicles, pretreatment of limonin significantly preserved kidney functions after ischemic AKI. We revealed that ERK2 is a significant protein linked to the limonin's active binding sites through structural analysis. The molecular docking study showed a high binding affinity between limonin and ERK2, which was confirmed by the cellular thermal shift assay and microscale thermophoresis. Mechanistically, we further validated that limonin promoted tubular cell proliferation and reduced cell apoptosis after AKI by activating ERK signaling pathway in vivo. In vitro and ex vivo, blockade of ERK abolished limonin's capacity of preventing tubular cell death under hypoxia stress. Our results indicated that limonin is a novel ERK2 activator with strong translational potential in preventing or mitigating AKI.

Keywords: acute kidney injury; cell death; cell proliferation; extracellular signal-regulated kinase 2; limonin.


Conflict of interest statement

Competing Interests: The authors have declared that no competing interest exists.

Figures
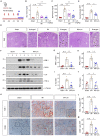
Figure 1
Figure 1
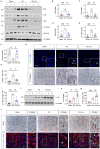
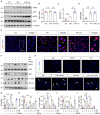
Limonin-treated mice were resistant to ischemic AKI. (A) Experimental design. The blue arrow indicates the timing of renal IRI surgery. The red arrows indicate the oral gavage of limonin. (B and C) Serum creatinine (SCr) and blood urea nitrogen (BUN) levels in different groups. (n = 5-11). (D) Representative micrographs show kidney injury in different groups. Asterisks in the boxed areas indicate injured tubules. Scale bar, 100 µm. (E) Quantitative assessment of kidney injury at 1 day after IRI. Data are presented as numbers of injured tubules per high power field (HPF). (n = 5). (F) Western blot analyses show KIM-1, NGAL, IL-6 and TNF-α expression in different groups. Quantitative data (G - J) are presented. Numbers (1-3) indicate each individual animal in a given group. (n = 5). (K) Micrographs show the expression of KIM-1 and CD68+ macrophage infiltration in different groups. Arrows in the boxes indicate positive staining. Scale bar, 100 µm. (L) Quantitative data of KIM-1+ tubules. (n = 5). (M) Quantitative data of CD68+ macrophages. (n = 5). **P < 0.01 versus sham controls; §§P < 0.01 versus IRI + limonin (40 mg/kg), ††P < 0.01 versus IRI + limonin (80 mg/kg), †P < 0.05 versus IRI + limonin (80 mg/kg).
Figure 2
Figure 2
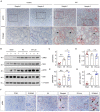
Limonin inhibits tubular cells apoptosis and promotes their proliferation. (A - F) Representative western blots (A) and quantitative data of p53 (B), Fas (C), Bax (D), cleaved caspase3 (E) and Survivin (F) are shown. (n = 5). (G) Representative micrographs show that apoptotic cells detected by TUNEL staining and immunostaining for cleaved caspase3. Arrows indicate apoptotic cells. Scale bar, 100 µm. Quantitative determination of TUNEL+ cells (H) and cleaved caspase3+ tubules (I) in different groups. (n = 5). (J - K) Representative Western blots (J) and quantitative data of c-Fos (K) are shown. (n = 5). (L) Cell proliferation was assessed by immunostaining for PCNA (upper panels) or co-immunostaining of EdU (green), basement membrane protein laminin (red) and nuclei (blue) (lower panels). Scale bar, 100 µm. (M) Quantitative determination of PCNA+ cells in different groups. (n = 5). **P < 0.01 versus sham controls; ††P < 0.01 versus IRI + limonin (80 mg/kg); †P < 0.05 versus IRI + limonin (80 mg/kg).
Figure 3
Figure 3
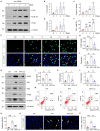
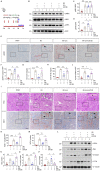
Limonin protects tubular cells against apoptosis and promotes their proliferation in vitro. HK-2 cells were incubated with limonin (20 nM) as indicated time. (A - D) Representative western blots (A) and quantitative data (B - D) show c-Fos, Cyclin D1, and PCNA levels in different groups. (n = 3). (E and F) EdU incorporation assay shows that limonin promoted tubular cell DNA synthesis. Representative EdU incorporation assay (E) and quantitative data (F) are shown. Scale bar, 50 µm. (n = 4). (G - L) limonin protects tubular cells against apoptosis induced by hypoxia/reoxygenation (H/R). HK-2 cells were pretreated with limonin (20 nM) for 2 h, then incubated in hypoxic condition (1% O2) for 24 h, and then reoxygenation for 2 h. Western blot (G) and quantitative data (H - L) show protein expression of PARP, Fas, FasL, FADD, and cleaved caspase3 in various groups. (n = 3). (M and N) Flow cytometry shows that limonin reduced H/R-induced cell apoptosis. Representative histograms (M) and quantitative data (N) are shown. (n = 6). (O and P) TUNEL staining (O) shows that limonin reduced H/R-induced cell apoptosis, and quantitative data (P) are presented. Scale bar, 50 µm. (n = 4). *P < 0.05, **P < 0.01 versus controls; ††P < 0.01, †P < 0.05 versus H/R.
Figure 4
Figure 4
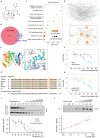
ERK2 is a direct target of limonin. (A) 2-D Structure of limonin. (B) Venn diagram shows the limonin and AKI-related targets. (C) KEGG enrichment for shared target proteins. The size of the bubble indicates the number of genetic factors. The bigger the bubble, the richer the path genes, and the redder the color indicates the pathway enrichment. (D) The PPI network of 166 common targets between AKI-related and limonin (upper panel). Zoom-in view of the PPI network of 10 Hub targets (lower panel). (E) The 3-D binding model between ERK and limonin. The green dotted lines represent the hydrogen bond. (F) MST analysis shows limonin binds to wtERK2-EGFP protein (blue), whereas the empty vector did not generate a binding curve (red). (G) Multiple-alignment analysis of human ERK2 and other species showed conservation of four sites. The mutant ERK2 was made by substituting Y34, V37, K52, and C164 residues (red font) with alanine. (H) MST analysis shows limonin binds to wtERK2-EGFP (blue) but not the mutant ERK2 (yellow). (I - J) limonin (20 μM) increases the thermal stability of ERK detected by the temperature-dependent cellular thermal shift assay (I) and the concentration-dependent cellular thermal shift assay at 52 °C (J). (n = 3).
Figure 5
Figure 5
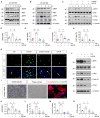
Limonin-mediated tubular cell proliferation depends on ERK phosphorylation in vitro. (A and B) HK-2 cells were treated with limonin (20 nM) for various periods of time as indicated. Representative Western blots show the levels of pMEK and pERK after short-term and long-term incubation. (C - F) HK-2 cells were treated with limonin (20 nM) alone or co-treated with U0126 (10 μM) for 24 h, and then cell lysates were subjected to western blot analyses for pERK, ERK, c-Myc, and PCNA. Representative Western blots (C) and quantitative data (D - F) are presented. (G and H) Representative EdU incorporation assay (G) and quantitative data (H) are shown. Arrows indicate proliferative cells. Scale bar, 50 µm. (n = 4). (I) Freshly isolated tubules and primary tubular cells are shown (left and middle panels). Scale bar, 500 µm. Primary tubular cells were co-immunostained with antibodies against E-cadherin (red) and vimentin (green) (right panel). Scale bar, 50 µm. (J) Representative western blots show protein expression of pERK, ERK, c-Myc, Cyclin D1, and PCNA after various treatments in mouse primary cultured tubular epithelial cells. (K - N) Quantitative data. (n = 3). *P < 0.05, **P < 0.01 versus controls; †P < 0.05, ††P < 0.01 versus limonin group.
Figure 6
Figure 6
Limonin-mediated protection of tubular cells against apoptosis depends on ERK phosphorylation in vitro. (A) Representative western blots show renal expression of pMEK, total MEK, pERK, and total ERK in different groups as indicated. Numbers (1-3) indicate each individual wells of cells. (B - D) Quantitative data are presented. **P < 0.01 versus controls; †P < 0.05 versus H/R, (n = 3). (E) Immunofluorescence staining of pERK in different group as indicated. Scale bar, 50 µm. Arrows indicate the nuclear translocation of ERK. (F) Representative Western blots show protein expression of pERK, total ERK, Bcl-2, cleaved caspase7 and Survivin after various treatments in HK-2 cells. (G - J) Graphic presentations are presented. *P < 0.05, **P < 0.01 versus control cells; † (or §) P < 0.05, §§P < 0.01 versus H/R; #P < 0.05, ##P < 0.01 versus H/R + limonin, (n = 3). (K and L) Representative micrographs of TUNEL staining (K) and quantitative data (L) are shown. Arrows indicate TUNEL-positive apoptotic cells. Scale bar, 50 µm. *P < 0.05 versus control cells; † (or §) P < 0.05 versus H/R; #P < 0.05 versus H/R + limonin. (n = 3).
Figure 7
Figure 7
ERK phosphorylation is a common response to AKI in humans and mice. (A) Representative micrographs show the abundance and localization of pERK proteins in healthy control and AKI patients as indicated. Scale bar, 100 µm. (B - E) Western blot analyses of renal pMEK, MEK, pERK and ERK protein expression after IRI in different groups as indicated. Representative western blot (B) and quantitative data (C - E) are shown. Numbers (1-3) indicate each individual animal in a given group. *P <0.05, **P <0.01 versus sham; †P <0.05 versus IRI + limonin (80 mg/kg). (n = 5). (F and G) Representative immunohistochemical staining (F) and quantitative data (G) show renal pERK expression in various groups as indicated. Arrows in the enlarged boxed areas indicate the pERK positive tubules. (n = 5). Scale bar, 100 µm. **P <0.01 versus sham; †P < 0.05 versus IRI + limonin (80 mg/kg).
Figure 8
Figure 8
Pharmacologic inhibition of ERK signaling aggravates kidney injury. (A) Experimental design. The blue arrows indicate the timing of renal IRI surgery. The green arrow indicates the timing of injecting U0126. (B - D) Western blot analyses show different groups' pMEK, MEK, pERK, and ERK expression. Representative western blot (B) and quantitative data (C - D) are presented. Numbers (1-3) indicate each individual animal in a given group. (n = 5). Representative immunohistochemical staining (E) and quantitative data (F) show renal pERK expression in various groups. Arrows in the enlarged boxed areas indicate the pERK+ tubules. Scale bar, 100 µm. (n = 5). (G and H) SCr and BUN levels in different groups. (n = 5). (I) Micrographs show kidney morphology and KIM-1 expression in different groups. Asterisks or arrows in the enlarged boxed areas indicate injured tubules. Scale bar, 100 µm. (J and K) Quantitative data are presented. (n = 5). (L - N) Western blot analyses show KIM-1 and NGAL expression in different groups. Representative western blot (L) and quantitative data (M - N) are presented. Numbers (1-3) indicate each individual animal in a given group. (n = 5). *P < 0.05, **P < 0.01 versus sham controls; †P < 0.05 versus IRI + U0126.
Figure 9
Figure 9
Pharmacologic inhibition of ERK abolishes renal protection of limonin after AKI. (A) Experimental design. The blue arrow indicates the timing of renal IRI surgery. The red arrows indicate the oral gavage of limonin. The green arrow indicates U0126 injection time. (B) Western blots show pMEK, MEK, pERK, and ERK levels in different groups. Numbers (1, 2) indicate each individual animal in a given group. (C and D) Quantitative data of pMEK and pERK. (n = 5). (E and F) Immunohistochemical staining (E) and quantitative data (F) show pERK expression in various groups. Arrows indicate the pERK+ tubules. Scale bar, 100 µm. (n = 5). (G and H) SCr and BUN levels in different groups. (n = 5). (I) Micrographs show kidney morphology and KIM-1 expression in different groups. Asterisks or arrows indicate injured tubules. Scale bar, 100 µm. (J and K) Quantitative data are presented. (n = 5). (L) Western blot analyses (L) show NGAL, Bax, cleaved caspase3, and c-Fos expression in different groups. (M - P) Quantitative data are presented. Numbers (1, 2) indicate each individual animal in a given group. (n = 5). *P < 0.05, **P < 0.01 versus sham controls; †P < 0.05, ††P < 0.01 versus IRI + limonin; §P < 0.05, §§P < 0.01 versus IRI + limonin + U0126.
Figure 10
Figure 10
Diagram shows that Limonin protect AKI. The schematic graph shows that limonin protects the kidneys against I/R injury through phosphorylating ERK to reduce apoptotic responses and enhance cell proliferation.

Similar articles

Cited by

References

    1. Rewa O, Bagshaw SM. Acute kidney injury-epidemiology, outcomes and economics. Nat Rev Nephrol. 2014;10:193–207. - PubMed
    1. Ronco C, Bellomo R, Kellum JA. Acute kidney injury. Lancet (London, England) 2019;394:1949–64. - PubMed
    1. Kellum JA, Romagnani P, Ashuntantang G, Ronco C, Zarbock A, Anders HJ. Acute kidney injury. Nat Rev Dis Primers. 2021;7:52. - PubMed
    1. Bagshaw SM, Wald R, Adhikari NKJ, Bellomo R, da Costa BR, Dreyfuss D. et al. Timing of Initiation of Renal-Replacement Therapy in Acute Kidney Injury. N Engl J Med. 2020;383:240–51. - PubMed
    1. Bhatt K, Wei Q, Pabla N, Dong G, Mi QS, Liang M. et al. MicroRNA-687 Induced by Hypoxia-Inducible Factor-1 Targets Phosphatase and Tensin Homolog in Renal Ischemia-Reperfusion Injury. J Am Soc Nephrol. 2015;26:1588–96. - PMC - PubMed