. 2023 Nov:28:e00317.
doi: 10.1016/j.jeca.2023.e00317. Epub 2023 Jun 12.

Effects of the first wave of COVID-19 pandemic on implied stock market volatility: International evidence using a google trend measure

Affiliations

Effects of the first wave of COVID-19 pandemic on implied stock market volatility: International evidence using a google trend measure

Stephanos Papadamou et al. J Econ Asymmetries. 2023 Nov.

Abstract

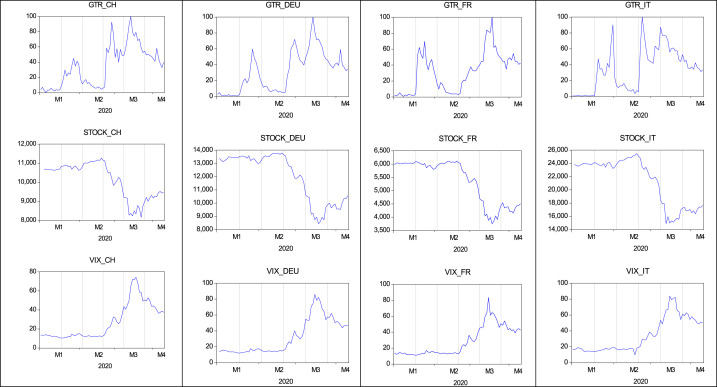
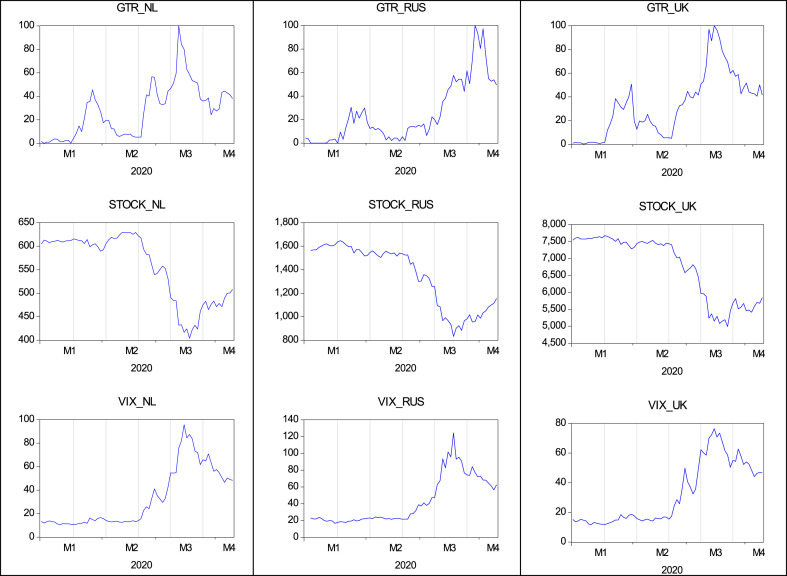
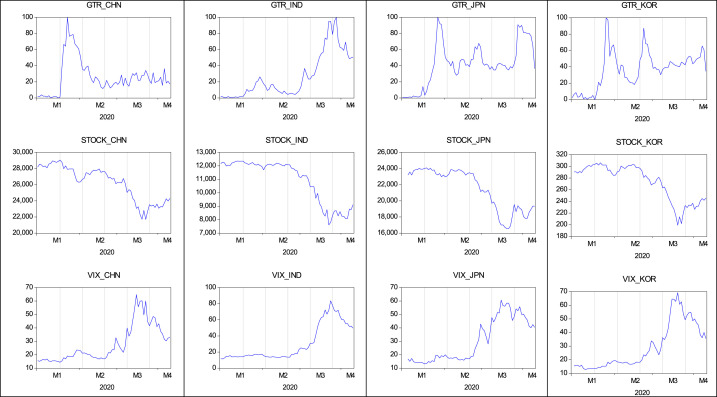
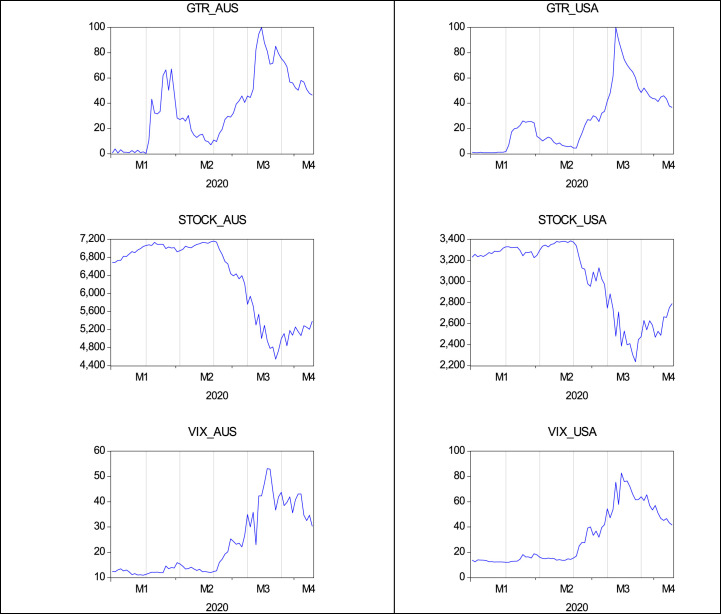
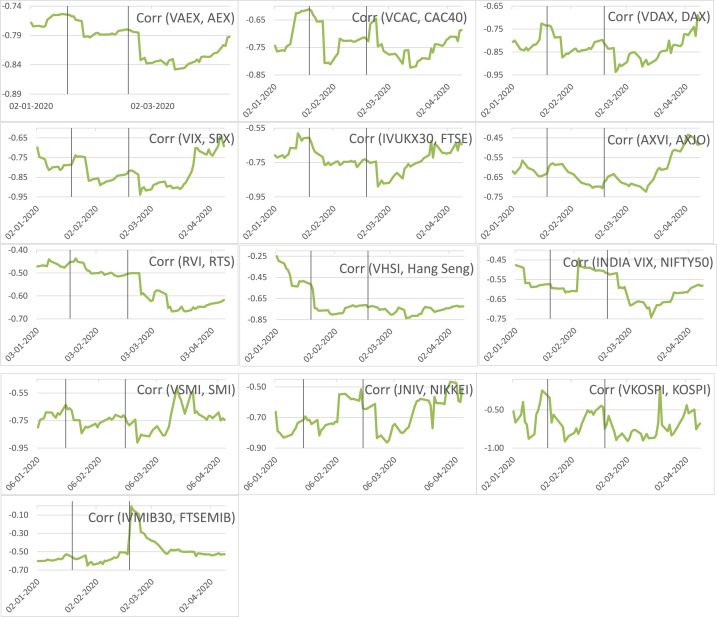
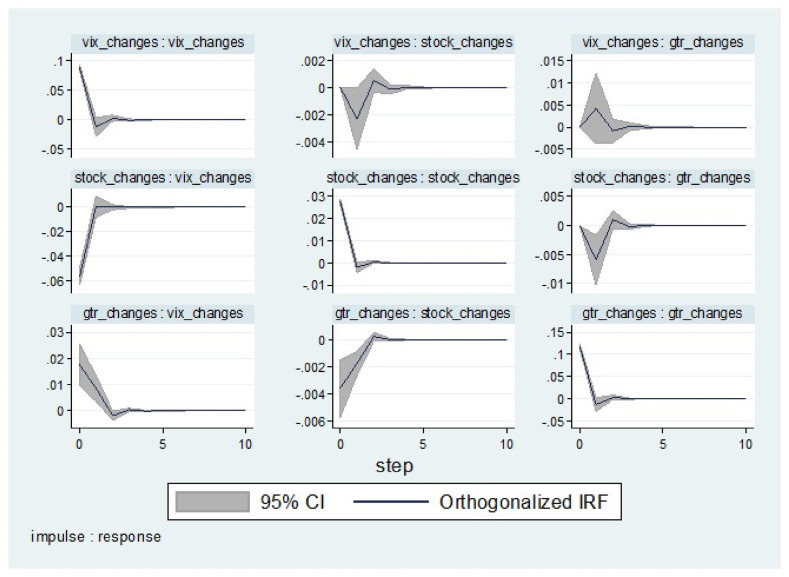
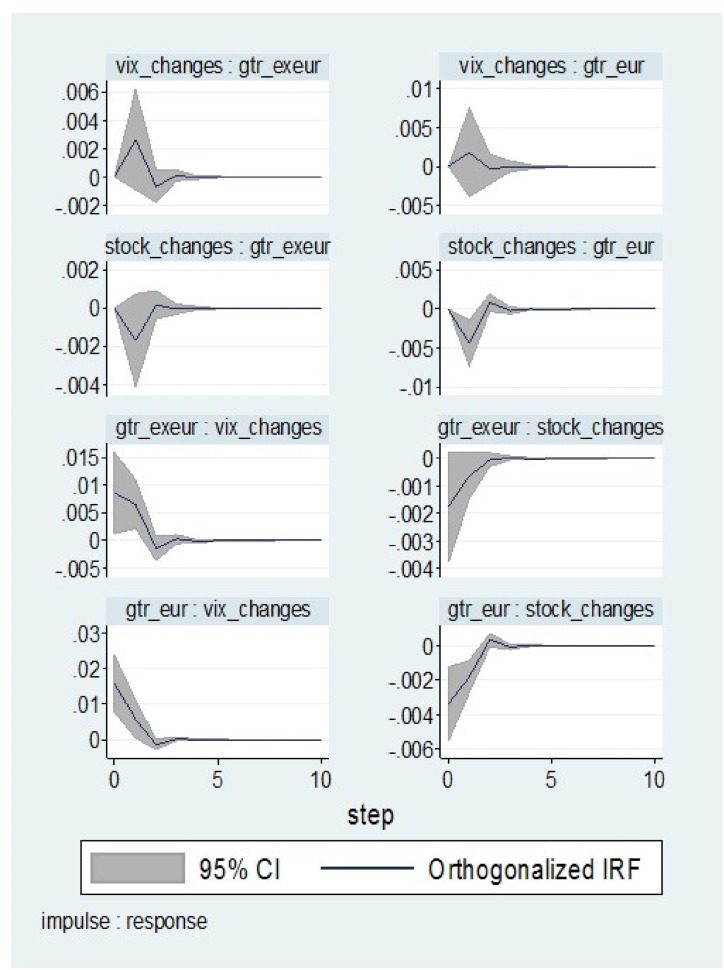
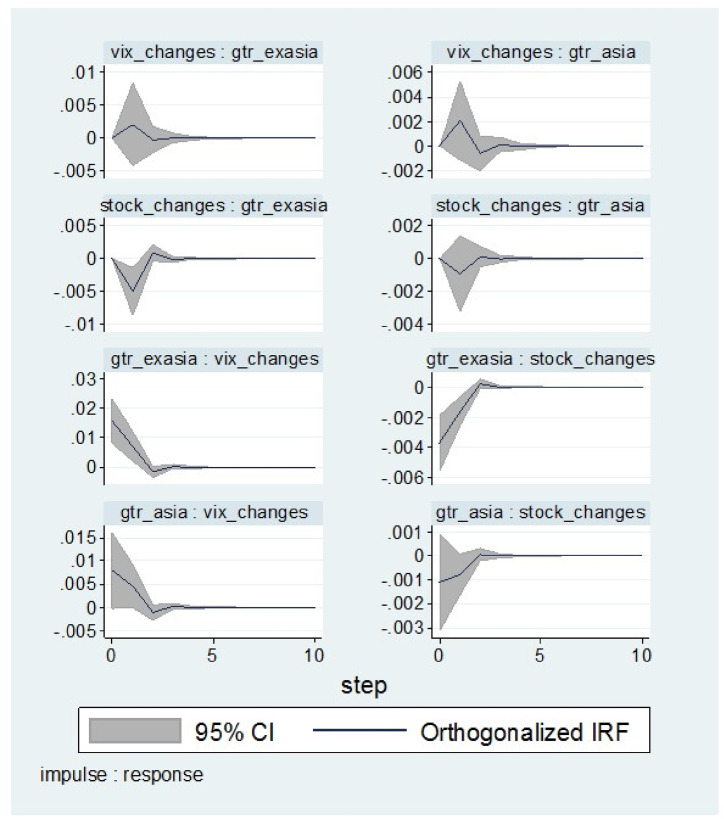
This paper investigates the relationship between investors' attention, as measured by Google search queries, and equity implied volatility during the COVID-19 outbreak. Recent studies show that search investors' behavior data is an extremely abundant repository of predictive data, and investor-limited attention increases when the uncertainty level is high. Our study using data from thirteen countries across the globe during the first wave of the COVID-19 pandemic (January-April 2020) examines whether the search "topic and terms" for the pandemic affect market participants' expectations about future realized volatility. With the panic and uncertainty about COVID-19, our empirical findings show that increased internet searches during the pandemic caused the information to flow into the financial markets at a faster rate and thus resulting in higher implied volatility directly and via the stock return-risk relation. More specifically for the latter, the leverage effect in the VIX becomes stronger as Google search queries intensify. Both the direct and indirect effects on implied volatility, highlight a risk-aversion channel that operates during the pandemic. We also find that these effects are stronger in Europe than in the rest of the world. Moreover, in a panel vector autoregression framework, we show that a positive shock on stock returns may soothe COVID-related Google searches in Europe. Our findings suggest that Google-based attention to COVID-19 leads to elevated risk aversion in stock markets.

Keywords: COVID-19 pandemic; Google trends; Implied volatility; Panel analysis; Stock returns.


Conflict of interest statement

The authors declare that they have no known competing financial interests or personal relationships that could have appeared to influence the work reported in this paper.

Figures

Fig. 1a
Fig. 1a
Google Trend on Coronavirus, Stock & VIX prices in European Countries. Notes: The horizontal lines of the figure present a) the GTR metric (Google Trend on Coronavirus) in each country, b) the Stock prices (stock prices of general index) in each country, c) the VIX prices (Implied Volatility index prices) in each country. The tickers for each country are presented as follows CH: Switzerland; DEU: Germany; FR: France; IT: Italy. M1, M2, M3, M4 in the x-axis of the sub-figures represent months of year 2020.
Fig. 1b
Fig. 1b
Google Trend on Coronavirus, Stock & VIX prices in European Countries. Notes: The horizontal lines of the figure present a) the GTR metric (Google Trend on Coronavirus) in each country, b) the Stock prices (stock prices of general index) in each country, c) the VIX prices (Implied Volatility index prices) in each country. The tickers for each country are presented as follows NL: Netherland; RUS: Russia; UK: United Kingdom. M1, M2, M3, M4 in the x-axis of the sub-figures represent months of year 2020.
Fig. 2
Fig. 2
Google Trend on Coronavirus, Stock & VIX prices in Asian Countries. Notes: The horizontal lines of the figure present a) the GTR metric (Google Trend on Coronavirus) in each country, b) the Stock prices (stock prices of general index) in each country, c) the VIX prices (Implied Volatility index prices) in each country. The tickers for each country are presented as follows CHN: China; IND: India; JPN: Japan; KOR: Korea. M1, M2, M3, M4 in the x-axis of the sub-figures represent months of year 2020.
Fig. 3
Fig. 3
Google Trend on Coronavirus, Stock & VIX prices in USA and Australia. Notes: The horizontal lines of the figure present a) the GTR metric (Google Trend on Coronavirus) in each country, b) the Stock prices (stock prices of general index) in each country, c) the VIX prices (Implied Volatility index prices) in each country. The tickers for each country are presented as follows USA: United States; AUS: Australia. M1, M2, M3, M4 in the x-axis of the sub-figures represent months of year 2020.
Fig. 4
Fig. 4
Temporal Dynamic correlations. Notes: Dynamic correlations between VIX index and stock market returns for each country. The vertical lines represent the following dates: 20/1/2020 and 19/2/2020. The abbreviations are analyzed as follows. VAEX, AEX indicate the volatility and stock market indices of the Netherland, respectively. VCAC, CAC40 indicate the French volatility and stock market indices, respectively. VDAX, DAX indicate the German volatility and stock market indices, respectively. VIX, SPX indicate the US volatility and stock market indices, respectively. IVUKX30, FTSE indicate the UK volatility and stock market indices, respectively. AXVI, AXJO indicate the Australian volatility and stock market indices, respectively. RVI, RTS indicate the Russian volatility and stock market indices, respectively. VHSI, Hang Seng indicate the Hong Kong volatility and stock market indices, respectively. INDIA VIX, NIFTY50 indicate the Indian volatility and stock market indices, respectively. VSMI, SMI indicate the Swiss volatility and stock market indices, respectively. JNIV, NIKKEI indicate the Japanese volatility and stock market indices, respectively. VKOSPI, KOSPI indicate the Korean volatility and stock market indices, respectively. IVMIB30, FTSEMIB indicate the Italian volatility and stock market indices, respectively.
Fig. 5
Fig. 5
Impulse response analysis for base PVAR model. Notes: This figure depicts the impulse response analysis between stock returns (stock_changes), volatility indices changes (VIX_changes) and Google trend metric (gtr_changes). The variable after symbol “:” is the variable that responds to a positive shock in variable before symbol “:”.
Fig. 6
Fig. 6
Impulse response analysis for PVAR model on European vs. non-European markets. Notes: This figure depicts the impulse response analysis between stock returns (stock_changes), volatility indices changes (VIX_changes) and Google trend metric (gtr_changes). gtr _eur refers to the Google trends metric on European markets and gtr_exeur on non-European markets (the rest markets in our sample). The variable after symbol “:” is the variable that responds to a positive shock in a variable before symbol “:”.
Fig. 7
Fig. 7
Impulse response analysis for PVAR model on Asian vs. non-Asian markets. Notes: This figure depicts the impulse response analysis between stock returns (stock_changes), volatility indices changes (VIX_changes), and Google trend metric (gtr_changes). gtr_asia refers to the Google trends metric on Asian markets and gtr _exasia on non-Asian markets (the rest markets in our sample). The variable after symbol “:” is the variable that responds to a positive shock in a variable before symbol “:”

References

    1. Abrigo M.R., Love I. Estimation of panel vector autoregression in Stata. STATA Journal. 2016;16(3):778–804.
    1. Afkhami M., Cormack L., Ghoddusi H. Google search keywords that best predict energy price volatility. Energy Economics. 2017;67:17–27.
    1. Akhtaruzzaman M., Benkraiem R., Boubaker S., Zopounidis C. COVID‐19 crisis and risk spillovers to developing economies: Evidence from Africa. Journal of International Development. 2022;34(4):898–918. - PMC - PubMed
    1. Akhtaruzzaman M., Boubaker S., Chiah M., Zhong A. COVID− 19 and oil price risk exposure. Finance Research Letters. 2021;42 - PMC - PubMed
    1. Akhtaruzzaman M., Boubaker S., Lucey B.M., Sensoy A. Is gold a hedge or a safe-haven asset in the COVID–19 crisis? Economic Modelling. 2021;102

LinkOut - more resources