. 2023 Jan 11;8(5):439-456.
doi: 10.1016/j.jacbts.2022.09.014. eCollection 2023 May.

Extracellular Vesicle-Associated TWEAK Contributes to Vascular Inflammation and Remodeling During Acute Cellular Rejection

Affiliations

Extracellular Vesicle-Associated TWEAK Contributes to Vascular Inflammation and Remodeling During Acute Cellular Rejection

Selvi Celik et al. JACC Basic Transl Sci. .

Abstract

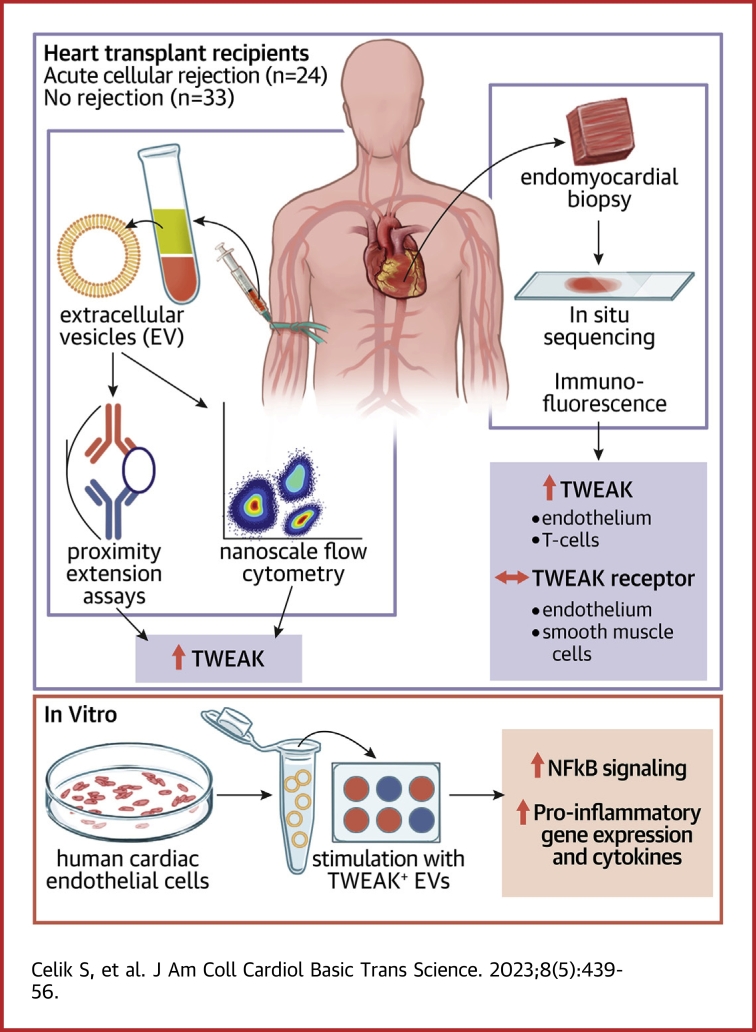
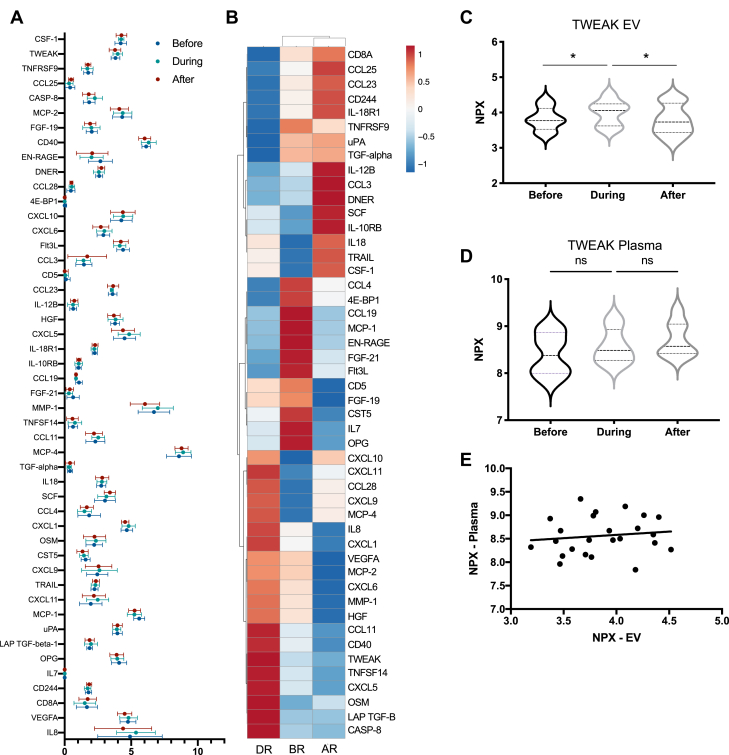
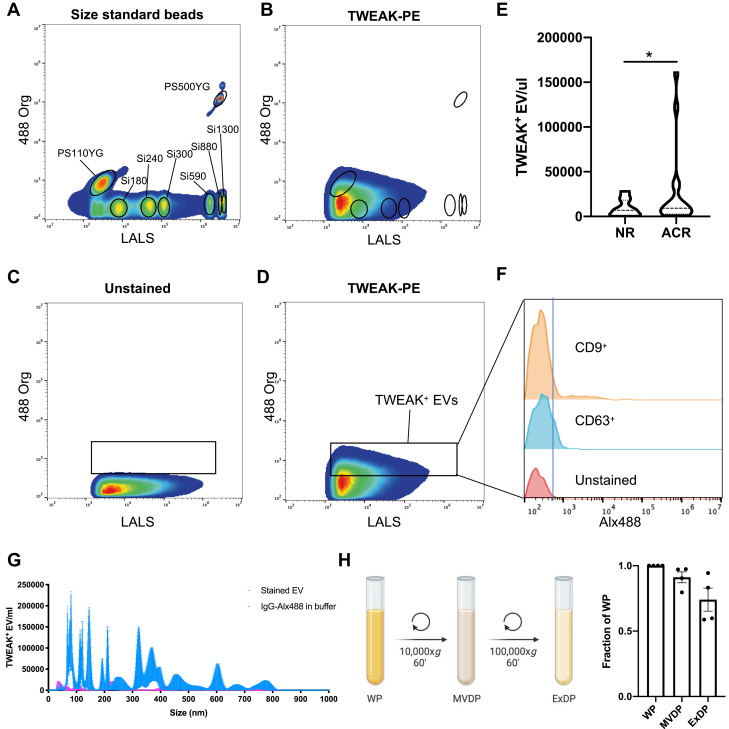
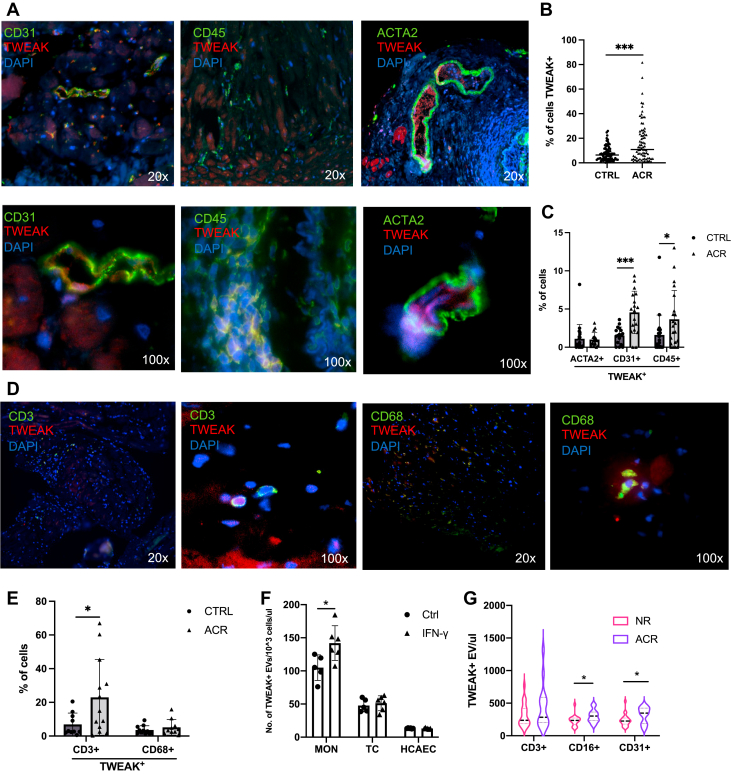
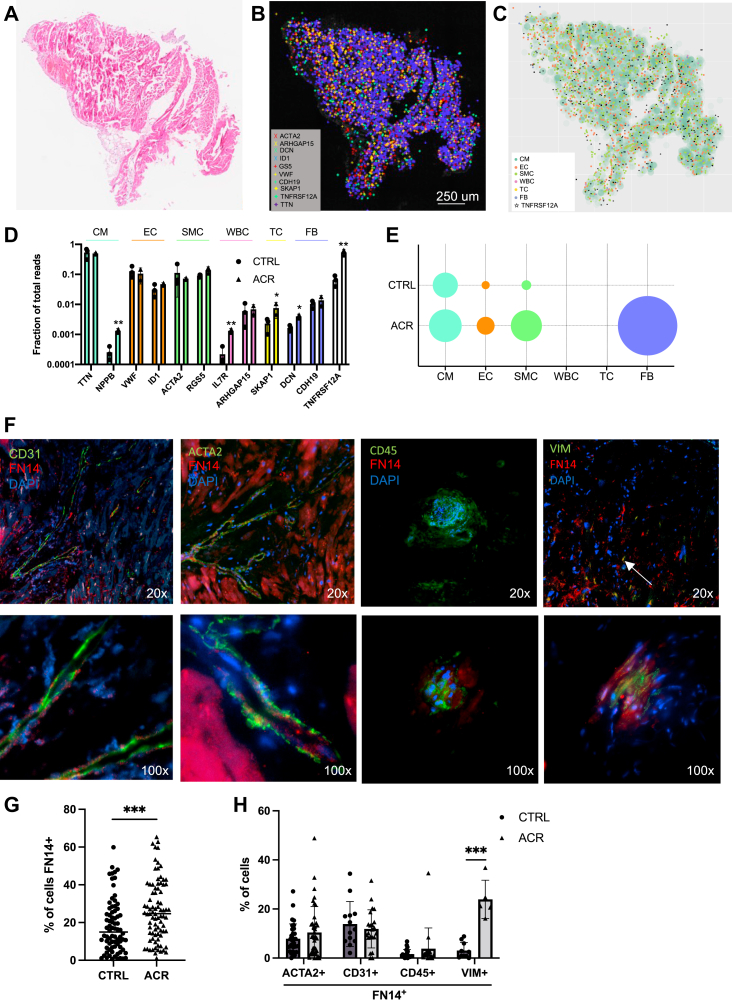
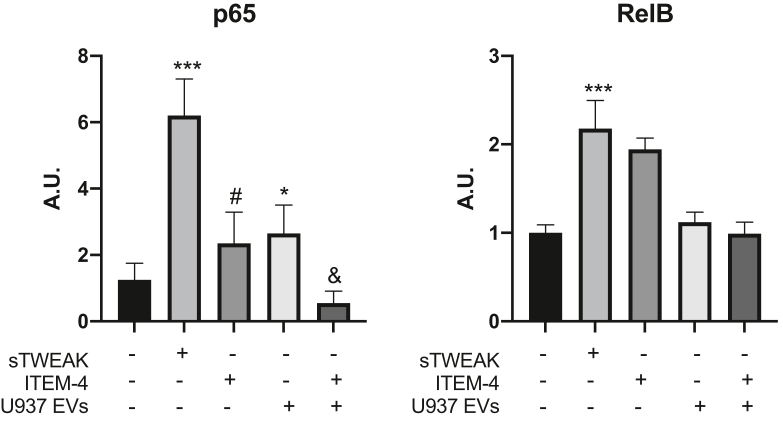
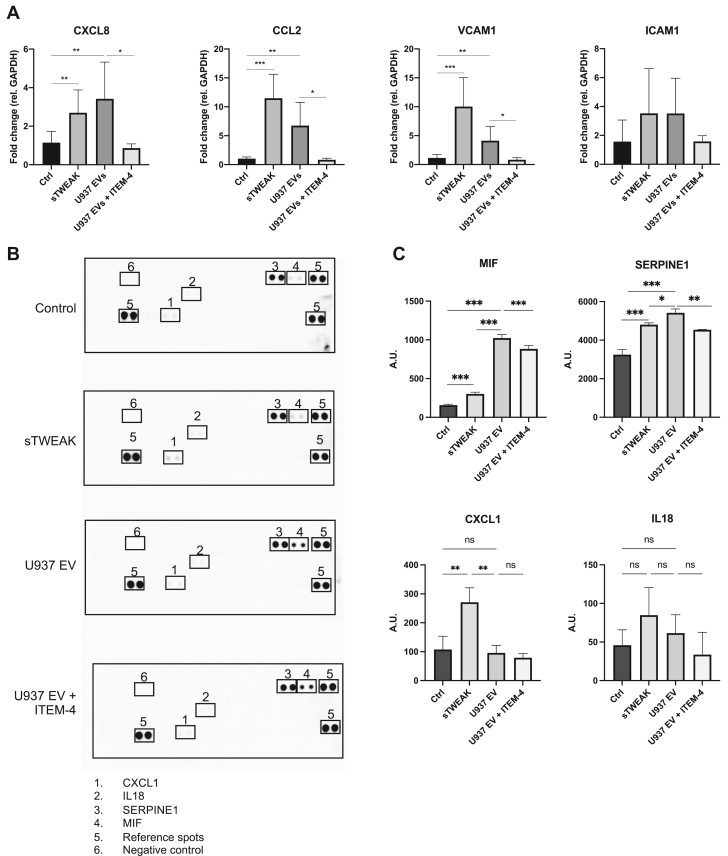
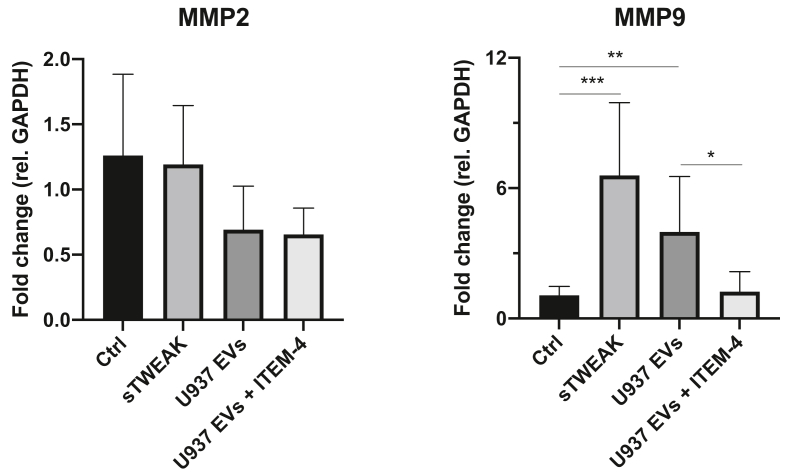
Acute cellular rejection (ACR) is a leading cause of graft loss and death after heart transplantation despite effective immunosuppressive therapies. The identification of factors that impair graft vascular barrier function or promote immune cell recruitment during ACR could provide new therapeutic opportunities for the treatment of patients who receive transplants. In 2 ACR cohorts, we found the extracellular vesicle-associated cytokine TWEAK to be elevated during ACR. Vesicular TWEAK promoted expression of proinflammatory genes and the release of chemoattractant cytokines from human cardiac endothelial cells. We conclude that vesicular TWEAK is a novel target with potential therapeutic implications in ACR.

Keywords: TWEAK; acute cellular rejection; chronic rejection; extracellular vesicle.


Conflict of interest statement

Dr Smith was supported by grants from the Swedish Heart-Lung Foundation (2019-0526), the Swedish Research Council (2021-02273), the European Research Council (ERC-STG-2015-679242), Skåne University Hospital, governmental funding of clinical research within the Swedish National Health Service, a generous donation from the Knut and Alice Wallenberg Foundation to the Wallenberg Center for Molecular Medicine in Lund, and funding from the Swedish Research Council (Linnaeus grant Dnr 349-2006-237, Strategic Research Area Exodiab Dnr 2009-1039) and Swedish Foundation for Strategic Research (Dnr IRC15-0067) to the Lund University Diabetes Center. Dr Gidlöf is supported by the Swedish Heart and Lung Foundation (2020-0532), the Crafoord Foundation, the Magnus Bergvall Foundation, the Åke Wiberg Foundation, the Royal Physiographic Society and the Maggie Stephens Foundation. All other authors have reported that they have no relationships relevant to the contents of this paper to disclose.

Figures

None
Graphical abstract
Figure 1
Figure 1
Proteomic Profiling of Extracellular Vesicles From Heart Transplant Recipients With ACR (A) Levels of 48 proteins measured with proximity extension assays in circulating EVs before, during, and after an episode of ACR (n = 8). (B) Heatmap showing mean protein expression across sample types. Unit variance scaling is applied to expression values, and clustering is preformed using Manhattan distance and average linkage. (C) Expression of TWEAK in EVs across sampling times (n = 8). ∗P < 0.05 comparing expression during ACR to before and after using repeated-measures ANOVA with correction for multiple comparisons through FDR. (D) Expression of TWEAK in plasma across sampling times (n = 8) using repeated-measures ANOVA with correction for multiple comparisons through FDR. (E) Correlation analysis of TWEAK expression in EVs and plasma (Pearson r = 0.131; P = 0.543). ACR = acute cellular rejection; ANOVA = analysis of variance; AR = after rejection; BR = before rejection; DR = during rejection; EV = extracellular vesicle; FDR = false discovery rate; NPX = normalized protein expression; ns = not significant; TWEAK = tumor necrosis factor–related weak inducer of apoptosis.
Figure 2
Figure 2
Characterization of TWEAK-Expressing EVs in Plasma (A to D) A nanoscale flow cytometry assay was set up to quantify TWEAK-expressing EVs in plasma samples. (A) A mixture of fluorescent polystyrene and nonfluorescent silica beads of uniform sizes were used to set a size-based gate for the submicron TWEAK+ particles seen in C. (B) A representative plasma sample stained with TWEAK-PE with the positions of the size-standard beads indicated with black circles. (C) An unstained plasma sample, showing the setting of the TWEAK+ EV gate. (D) A representative plasma sample stained with TWEAK-PE, showing the fraction of submicron TWEAK+ events. (E) Quantification of TWEAK+ EVs in plasma samples from patients with ACR (n = 16) and non-ACR control samples (n = 33) using nanoscale flow cytometry. ∗P < 0.05 using an unpaired Student’s t-test. (F) Histogram showing the fraction of TWEAK+ EVs that are also positive for exosomal markers CD9 and CD63. (G) Fluorescent nanoparticle tracking analysis of plasma EVs from a healthy volunteer stained with a TWEAK antibody. The mean number of fluorescent particles from 5 repeated measurements are shown. A negative control consisting of secondary antibody in buffer is shown for reference. (H) TWEAK ELISA was performed on whole plasma (WP), microvesicle-depleted plasma (MVDP), and exosome-depleted plasma (ExDP) from healthy volunteers (n = 4). Data are shown normalized to the quantity in WP. Alx488 = Alexa Fluor 488; IgG = immunoglobulin G; LALS = long-angle light scatter; NR = no rejection; Org = orange; PE = phycoerythrin; PS110YG = 110-nm fluorescent polystyrene bead; Si180 = 180-nm silica bead; other abbreviations as in Figure 1.
Figure 3
Figure 3
The Cellular Source of TWEAK Expression in Cardiac Allografts and Circulating EVs During ACR (A) Coimmunofluorescence staining for (left) TWEAK/CD31, (middle) TWEAK/CD45, and (right) TWEAK/ACTA2 in EMBs from patients with ACR. (B) Fraction of cells/field classified as TWEAK+ (n = 80 fields total for non-ACR, and n = 79 for ACR). ∗∗∗P < 0.001 using Mann-Whitney U test. (C) Fraction of cells/field classified as TWEAK+ and ACTA2+ (n = 37 fields total), CD31+ (n = 35), or CD45+ (n = 43). ∗P < 0.05, ∗∗∗P < 0.001 using unpaired Student’s t-tests. (D) Coimmunofluorescence staining for (left) TWEAK/CD3 and (right) TWEAK/CD68 in EMBs from patients with ACR. (E) Fraction of cells/field classified as TWEAK+ and CD3+ (n = 23 fields total) or CD68+ (n = 21). ∗P < 0.05 using an unpaired Student’s t-tests. (F) Nanoscale flow cytometric quantification of TWEAK+ EVs in cell supernatant from primary monocytes (MON), T cells (TC), and primary human cardiac endothelial cells (HCAEC) with and without stimulation with 100 ng/mL IFN-γ. ∗P < 0.05 using an unpaired Student’s t-test. (G) Nanoscale flow cytometric quantification of TWEAK+ EVs in plasma from patients with transplants with (n = 16) and without (n = 33) ACR. EVs were costained with TWEAK and cellular markers for T-cells (CD3), monocytes (CD16), and endothelial cells (CD31). ∗P < 0.05, ∗∗∗P < 0.001 using unpaired Student’s t-tests. DAPI = 4′,6-diamidino-2-phenylindole; EMB = endomyocardial biopsy; IFN = interferon; other abbreviations as in Figures 1 and 2.
Figure 4
Figure 4
Cell Type–Specific Expression of FN14 During ACR (A to E) In situ sequencing was performed on EMB tissue sections from patients with and without ACR (n = 3) using a 12-plex panel of probes specific for the FN14 gene TNFRSF12A and cell type–specific marker genes for cardiomyocytes (CM), endothelial cells (EC), smooth muscle cells (SMC), leukocytes (WBC), T cells (TC), and fibroblasts (FB). (A) Example of an EMB tissue section used for in situ sequencing. (B) In situ sequencing reads in an adjacent tissue section. (C) A virtual cell map based on the spatial distribution of marker gene reads. Depicted also are TNFRSF12A reads. (D) The fraction of reads for each gene compared to the total number of reads summarized across sample groups. ∗P < 0.05, ∗∗P < 0.01 using unpaired Student’s t-tests. (E) The enrichment of TNFRSF12A reads in each cell type was assessed using binomial tests. Circles are shown for cell types where P < 0.05 and the size of the circles are proportional to the log2 odds ratio. (F) Coimmunofluorescence staining for FN14 and CD31, ACTA2, CD45, and VIM in EMB tissue sections from patients with ACR. (G) Fraction of cells/field classified as FN14+ (n = 76 fields total for non-ACR, and n = 83 for ACR). P < 0.001 using Mann-Whitney U test. (H) Fraction of cells/field classified as FN14+ and ACTA2+ (n = 72 fields total), CD31+ (n = 35), CD45+ (n = 37), or VIM+ (n = 15). ∗∗∗P < 0.001 using an unpaired Student’s t-test. CTRL = control; VIM = vimentin; other abbreviations as in Figures 1 and 3.
Figure 5
Figure 5
Vesicular TWEAK Induces Canonical NF-κB Signaling Activation of NF-κB signaling was assayed in human cardiac endothelial cells after stimulation for 5 hours with 1 μg/mL of soluble recombinant TWEAK or 30,000 TWEAK+ U937 EVs/μL using immunobased quantification of the binding of p65 and RelB to NF-κB consensus motif-containing oligonucleotides. Some cells were pretreated with the FN14-blocking antibody ITEM-4 for 30 minutes before the addition of sTWEAK or U937 EVs. Results are based on 2 separate experiments with 3 biological replicates in each group. ∗∗∗P < 0.001 comparing untreated control cells with sTWEAK-treated cells. #P < 0.05 comparing sTWEAK vs sTWEAK + ITEM-4. ∗P < 0.05 comparing untreated control cells and cells treated with U937 EVs. &P < 0.05 comparing U937 EVs vs U937 EVs + ITEM-4 using ANOVA with FDR adjusting for multiple post hoc pairwise comparisons. A.U. = arbitrary units; NF-κB = nuclear factor κB; sTWEAK = soluble TWEAK; other abbreviations as in Figure 1.
Figure 6
Figure 6
Vesicular TWEAK Induces Proinflammatory Gene Expression in Cardiac Endothelial Cells (A) The expression levels of CXCL8, CCL2, VCAM1, and ICAM1 were assessed in human cardiac endothelial cells after stimulation for 5 hours with 1 μg/mL of soluble recombinant TWEAK or 30,000 TWEAK+ U937 EVs/μL using quantitative real-time polymerase chain reaction. Some cells were pretreated with the FN14-blocking antibody ITEM-4 for 30 minutes before the addition of sTWEAK or U937 EVs. ∗∗∗P < 0.001, ∗∗P < 0.01, ∗P < 0.05 using ANOVA with FDR adjusting for multiple comparisons. (B) Examples of immunoarrays with the detected cytokines in duplicates indicated. (C) Quantification of the immunoarray results (n = 3). Results are based on 2 or 3 separate experiments with 3 to 6 biological replicates in each group. ∗∗∗P < 0.001, ∗∗P < 0.01, ∗P < 0.05 using ANOVA with FDR adjusting for multiple post hoc pairwise comparisons. rel. GAPDH = relative to glyceraldehyde 3-phosphate dehydrogenase; other abbreviations as in Figures 1, 4, and 5.
Figure 7
Figure 7
Vesicular TWEAK Signaling Induces MMP2 Expression in Vascular Smooth Muscle Cells The expression levels of MMP2 and MMP9 were assessed in human coronary artery smooth muscle cells after stimulation for 5 hours with 1 μg/mL of soluble recombinant TWEAK or 30,000 TWEAK+ U937 EVs/μL using quantitative real-time polymerase chain reaction. Some cells were pretreated with the FN14-blocking antibody ITEM-4 for 30 minutes before the addition of sTWEAK or U937 EVs. Results are based on 2 separate experiments with 3 to 6 biological replicates in each group. ∗∗∗P < 0.001, ∗∗P < 0.01, ∗P < 0.05 using ANOVA with FDR adjusting for multiple post hoc pairwise comparisons. MMP = matrix metalloproteinase; other abbreviations as in Figures 1, 4, 5, and 6.

Similar articles

Cited by

References

    1. Taylor D.O., Edwards L.B., Aurora P., et al. Registry of the International Society for Heart and Lung Transplantation: twenty-fifth official adult heart transplant report—2008. J Heart Lung Transplant. 2008;27:943–956. - PubMed
    1. Lund L.H., Khush K.K., Cherikh W.S., et al. The registry of the International Society for Heart and Lung Transplantation: thirty-fourth adult heart transplantation report—2017; focus theme: allograft ischemic time. J Heart Lung Transplant. 2017;36:1037–1046. - PubMed
    1. Raichlin E., Edwards B.S., Kremers W.K., et al. Acute cellular rejection and the subsequent development of allograft vasculopathy after cardiac transplantation. J Heart Lung Transplant. 2009;28:320–327. - PubMed
    1. Sobieszczanska-Malek M., Korewicki J., Komuda K., et al. Heart transplantation and risk of cardiac vasculopathy development: what factors are important? Ann Transplant. 2017;22:682–688. - PMC - PubMed
    1. Sato T., Seguchi O., Ishibashi-Ueda H., et al. Risk stratification for cardiac allograft vasculopathy in heart transplant recipients—annual intravascular ultrasound evaluation. Circ J. 2016;80:395–403. - PubMed

LinkOut - more resources