. 2023 Feb 22;8(5):518-542.
doi: 10.1016/j.jacbts.2022.11.003. eCollection 2023 May.

zDHHC9 Regulates Cardiomyocyte Rab3a Activity and Atrial Natriuretic Peptide Secretion Through Palmitoylation of Rab3gap1

Affiliations

zDHHC9 Regulates Cardiomyocyte Rab3a Activity and Atrial Natriuretic Peptide Secretion Through Palmitoylation of Rab3gap1

Kobina Essandoh et al. JACC Basic Transl Sci. .

Abstract

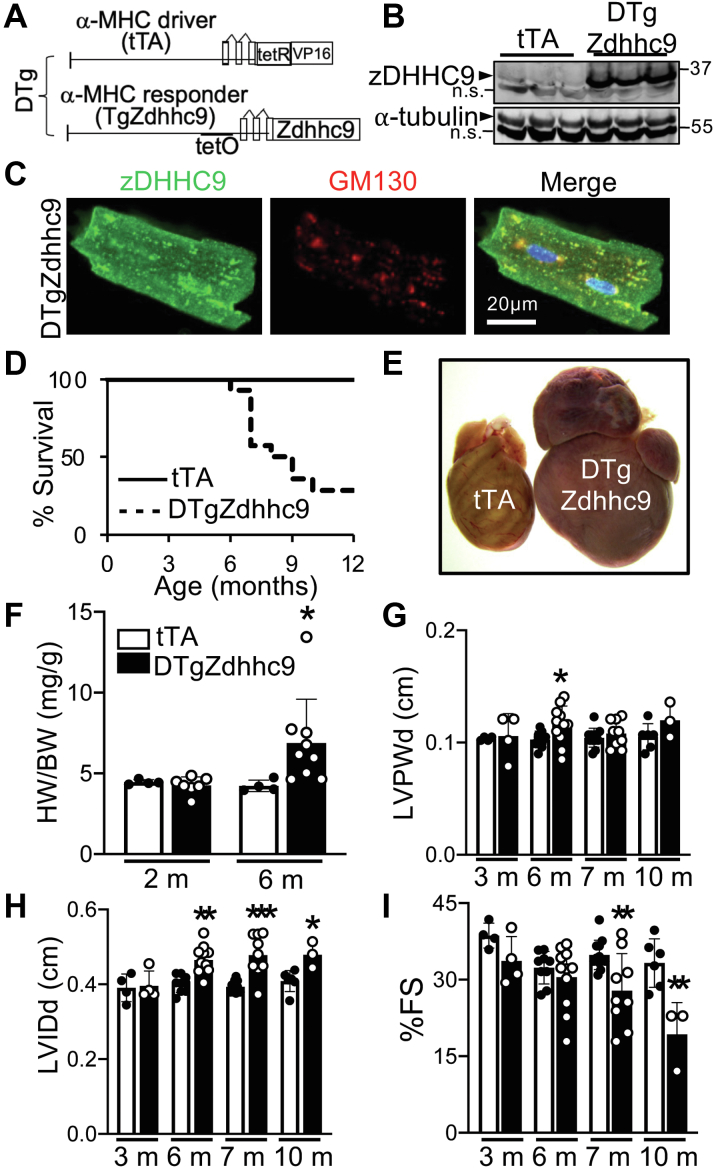
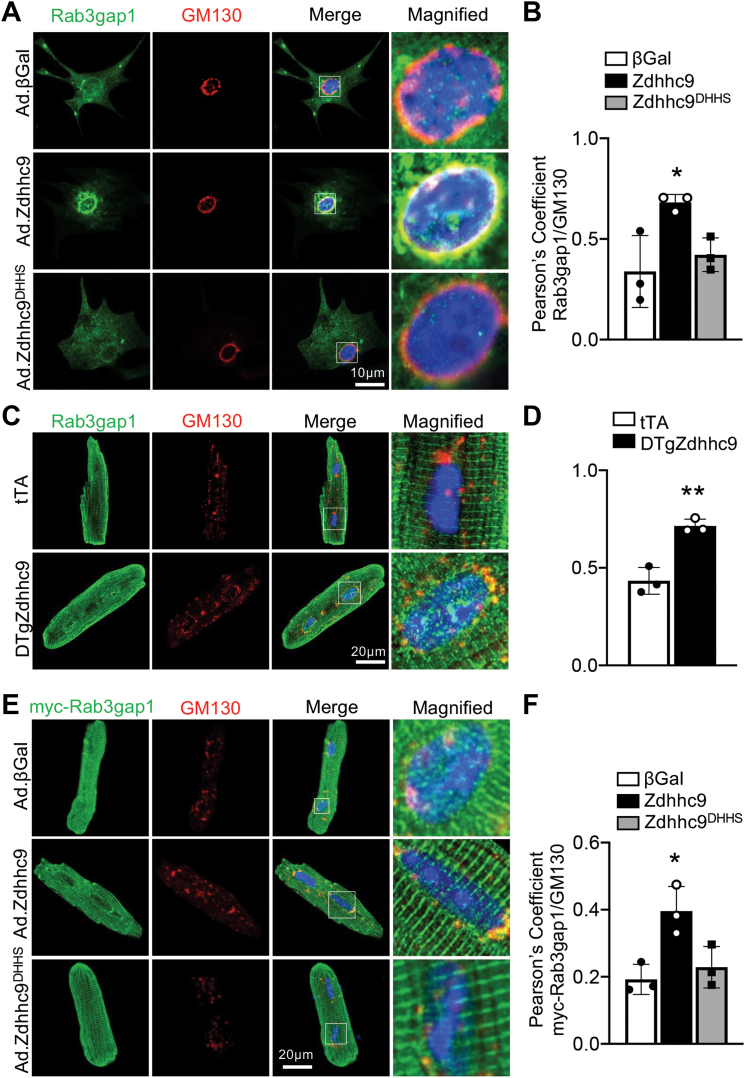
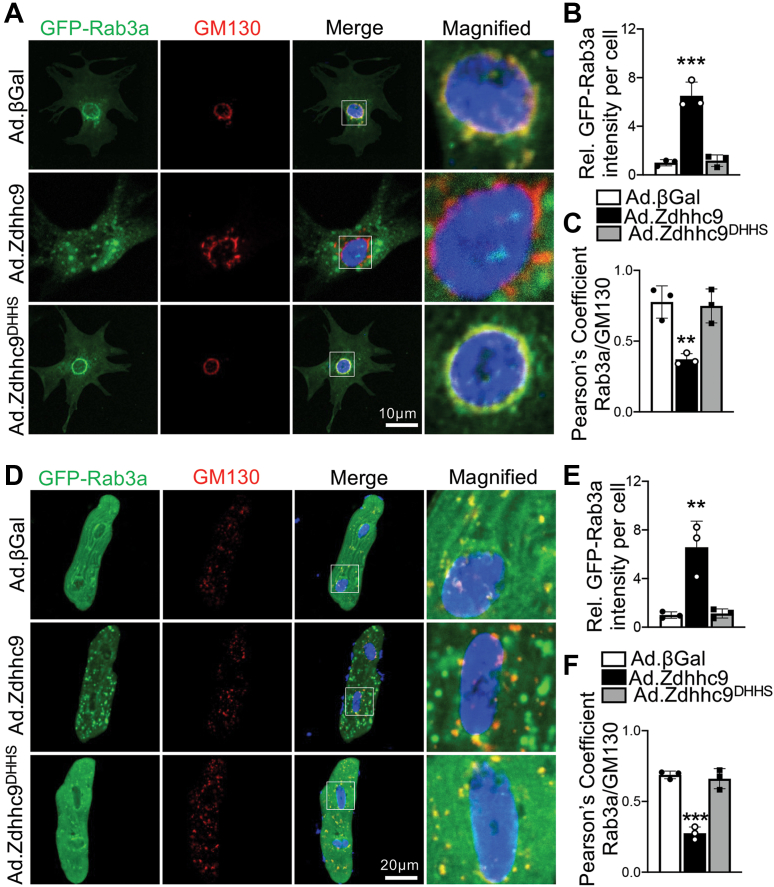
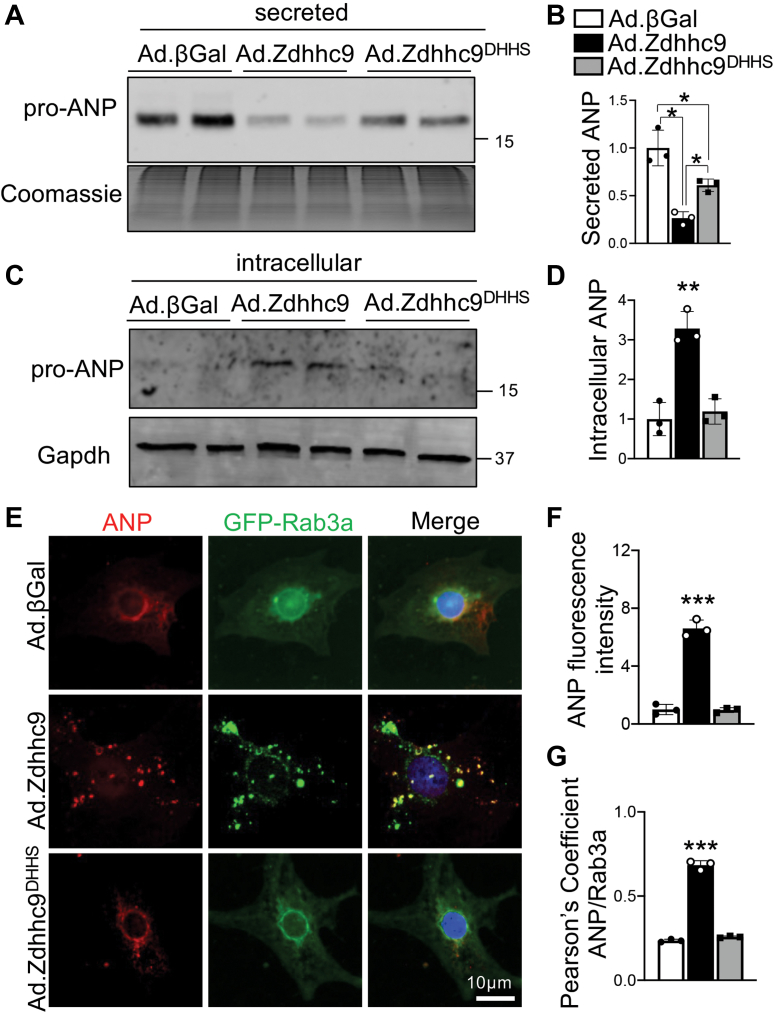
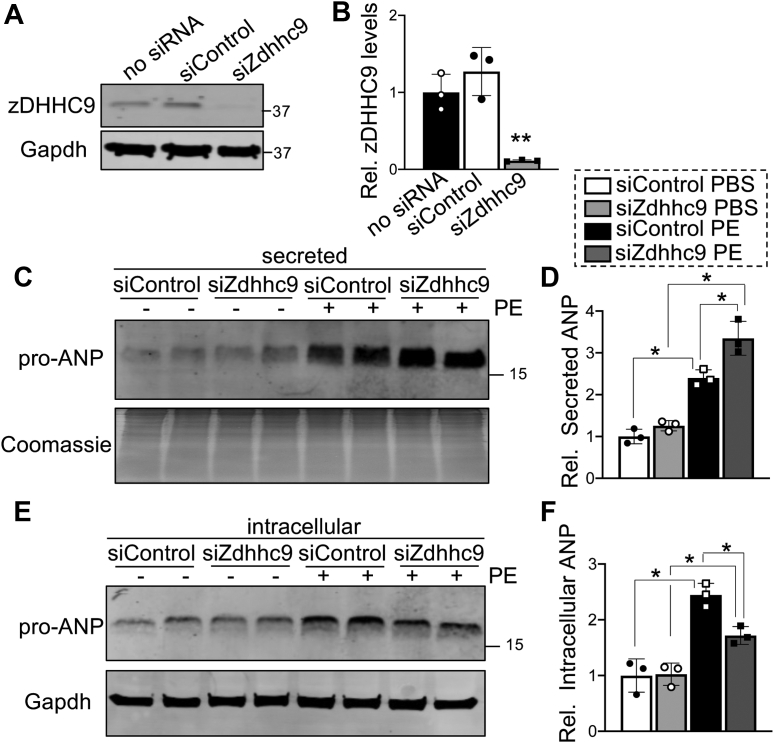
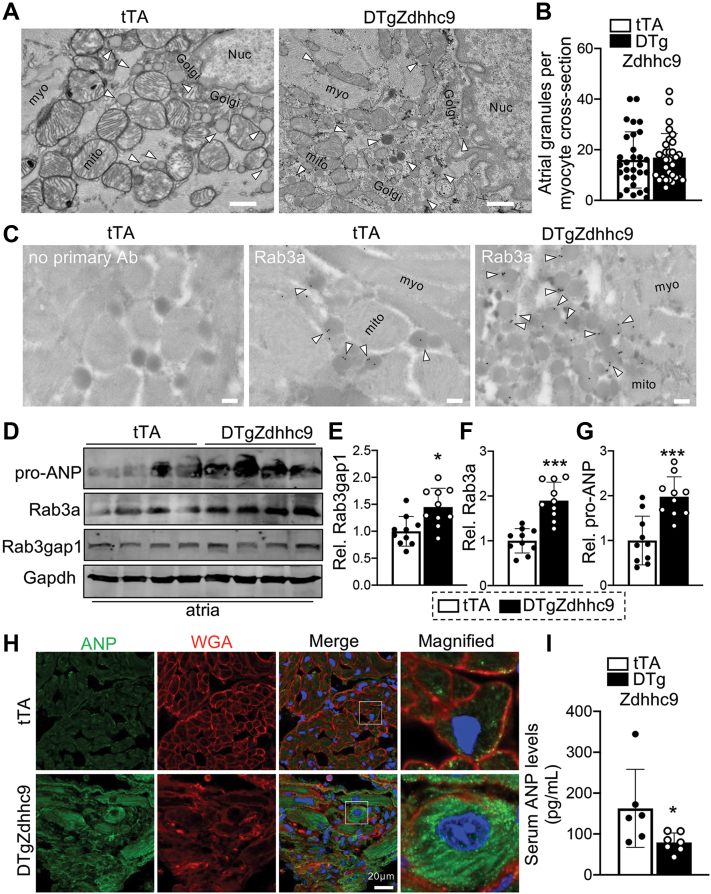
Production and release of natriuretic peptides by the stressed heart reduce cardiac workload by promoting vasodilation, natriuresis, and diuresis, which has been leveraged in the recent development of novel heart-failure pharmacotherapies, yet the mechanisms regulating cardiomyocyte exocytosis and natriuretic peptide release remain ill defined. We found that the Golgi S-acyltransferase zDHHC9 palmitoylates Rab3gap1 resulting in its spatial segregation from Rab3a, elevation of Rab3a-GTP levels, formation of Rab3a-positive peripheral vesicles, and impairment of exocytosis that limits atrial natriuretic peptide release. This novel pathway potentially can be exploited for targeting natriuretic peptide signaling in the treatment of heart failure.

Keywords: Rab3; atrial natriuretic peptide; exocytosis; heart failure; palmitoylation.


Conflict of interest statement

This work was supported by grants from the National Institutes of Health (R00HL136695 to Dr Brody) and the American Heart Association (827440 to Dr Essandoh). All other authors have reported that they have no relationships relevant to the content of this manuscript to disclose.

Figures

None
Graphical abstract
Figure 1
Figure 1
Overexpression of zDHHC9 in Mouse Cardiomyocytes Results in Cardiomyopathy (A) Schematic of bigenic tet-off system used to overexpress zDHHC9 in the heart. (B) Immunoblots showing expression of zDHHC9 in DTgZdhhc9 hearts compared with tTA controls. n.s. = nonspecific band. (C) Immunostaining for zDHHC9 (green) and GM130 (Golgi marker, red) in adult cardiomyocytes isolated from DTgZdhhc9 mice. (D) Kaplan-Meier survival curve showing mortality in transgenic mice with cardiomyocyte-specific expression of zDHHC9. n = 10 for tTA, n = 14 for DTgZdhhc9. (E) Gross cardiac morphology of tTA control compared with DTgZdhhc9 littermate that died at 6 months of age. (F) Heart weight to body weight ratios at 2 months and 6 months of age. n = 4-9. (G to I) Echocardiographic measurement of (G) left ventricular (LV) posterior-wall thickness (LVPWd) and (H) LV internal diameter (LVIDd) during diastole and (I) % fractional shortening (FS) at the indicated age. m = months. n = 3-13. ∗P < 0.05, ∗∗P < 0.01, ∗∗∗P < 0.001 compared with tTA controls, Student's t-test with Welch’s correction. Data are presented as mean ± SD.
Figure 2
Figure 2
zDHHC9 Activity Enhances Palmitoylation of Rab3gap1 in the Heart (A) Schematic showing procedure for Acyl resin-assisted capture (Acyl-RAC) to purify cysteine palmitoylated proteins for Western blotting or mass spectrometry (LC-MS). MMTS = methyl methanethiosulfonate. Adapted from Forrester et al. 2011. (B) Rab3gap1 palmitoylation in zDHHC9 transgenic hearts at 2 months of age. Acyl-RAC followed by immunoblotting to detect palmitoylated Rab3gap1 in DTgZdhhc9 hearts compared with tTA controls. n.s. = nonspecific band. (C,D) Quantification of (C) palmitoylated and (D) total Rab3gap1. ∗P < 0.05, compared with controls, Student's t-test with Welch’s correction. (E) Acyl-RAC followed by immunoblotting to detect palmitoylated Rab3gap1 in rat neonatal cardiomyocytes (RNCMs) transduced with adenoviruses to express wildtype zDHHC9 (Ad.Zdhhc9), enzymatically dead mutant zDHHC9 (Ad.Zdhhc9DHHS), or β-galactosidase (Ad.βGal) as a control and quantification of (F) palmitoylated and (G) total Rab3gap1. ∗P < 0.05, 1-way analysis of variance (ANOVA) with Tukey’s multiple comparisons test. Data are presented as mean ± SD.
Figure 3
Figure 3
zDHHC9 Regulates Rab3gap1 Localization in Cardiomyocytes (A) Representative images of RNCMs transduced with adenoviruses for wildtype zDHHC9 (Ad.Zdhhc9), enzymatically dead zDHHC9 (Zdhhc9DHHS), or βGal control and immunostained for endogenous Rab3gap1 (green) and GM130 (Golgi marker, red). (B) Quantification of Pearson’s correlation coefficients for colocalization of Rab3gap1 and GM130 in RNCMs. ∗P < 0.05, 1-way ANOVA with Tukey’s multiple comparisons test. (C) Representative images of adult cardiomyocytes from tTA and DTgZdhhc9 hearts, immunostained for endogenous Rab3gap1 (green) and GM130 (Golgi marker, red). (D) Quantification of Pearson’s correlation coefficients for colocalization of Rab3gap1 and GM130 in cardiomyocytes. ∗∗P < 0.01, compared with tTA controls, Student's t-test with Welch’s correction. (E) Representative images of adult mouse ventricular myocytes (AMVMs) transduced with adenovirus to express myc-tagged wildtype Rab3gap1 and wildtype zDHHC9 (Ad.Zdhhc9), enzymatically dead zDHHC9 (Zdhhc9DHHS), or βGal control followed by immunostaining for myc (Rab3gap1, green) and GM130 (Golgi marker, red). (F) Quantification of Pearson’s correlation coefficients for colocalization of myc-Rab3gap1 and GM130 in AMVMs. ∗P < 0.05, 1-way ANOVA with Tukey’s multiple comparisons test. n = 3 independent experiments with 60 to 90 cells analyzed for each experiment. Nuclei were stained blue with DAPI in A, C, and E. Data are presented as mean ± SD. Abbreviations as in Figures 1 and 2.
Figure 4
Figure 4
zDHHC9 Promotes Rab3a GTP Loading and Impairs Interaction of Rab3gap1 With Rab3a-GTP (A-C) Rab3a-GTP levels in zDHHC9 transgenic hearts. (A) Rab3a-GTP was affinity purified from cardiac lysates with GST-Rim1(1-200) followed by immunoblotting. Quantification of (B) Rab3a-GTP and (C) total Rab3a levels. ∗P < 0.05 compared with tTA controls, Student's t-test with Welch’s correction. (D to F) Rab3a-GTP levels in RNCMs transduced with adenovirus to express GFP-Rab3a and wildtype zDHHC9 (Ad.Zdhhc9), enzymatically dead zDHHC9 (Zdhhc9DHHS), or βGal control. (D) Rab3a-GTP was affinity purified from the indicated RNCM lysates with GST-Rim1(1-200) followed by immunoblotting. Quantification of (E) Rab3a-GTP and (F) total Rab3a levels. ∗∗P < 0.01, ∗∗∗P < 0.001, 1-way ANOVA with Tukey’s multiple comparisons test. (G to J) Interaction of Rab3a-GTP with Rab3gap1. AD-293 cells were cotransfected with the GFP-Rab3a-Q81L mutant, myc-tagged Rab3gap1, and plasmids encoding empty vector (pShuttle), zDHHC9, or the zDHHC9DHHS transferase-dead mutant. (G) Immunoprecipitation of Rab3aQ81L with anti-GFP or (H) Rab3gap1 with anti-myc followed by immunoblotting with the indicated antibodies. (I) Quantification of relative levels of Rab3gap1 coimmunoprecipitated with Rab3Q81L (anti-GFP), and (J) relative levels of Rab3Q81L coimmunoprecipitated with Rab3gap1 (anti-myc) as in G and H, respectively. n = 3 independent experiments. ∗P < 0.05, ∗∗P < 0.01 1-way ANOVA with Tukey’s multiple comparisons test. Data are presented as mean ± SD. Abbreviations as in Figures 1 and 2.
Figure 5
Figure 5
zDHHC9 Overexpression Enhances Accumulation of Rab3a-Positive Vesicles at the Cardiomyocyte Periphery (A) Representative images of RNCMs transduced with adenovirus to express GFP-Rab3a and wildtype zDHHC9 (Ad.Zdhhc9), enzymatically dead zDHHC9 (Zdhhc9DHHS), or βGal control and immunostained for the Golgi marker GM130 (red). Quantification of (B) relative GFP-Rab3a fluorescence intensity and (C) Pearson’s correlation coefficients for colocalization of GFP-Rab3a with GM130 in RNCMs. (D) Representative images AMVMs transduced with adenovirus to express GFP-Rab3a and wildtype zDHHC9 (Ad.Zdhhc9), enzymatically dead zDHHC9 (Zdhhc9DHHS), or βGal control and immunostained for the Golgi marker GM130 (red). Quantification of (E) relative GFP-Rab3a fluorescence intensity and (F) Pearson’s correlation coefficients for colocalization of GFP-Rab3a with GM130 in AMVMs. Nuclei were stained with DAPI (blue) in A and D. ∗∗P < 0.01, ∗∗∗P < 0.001, 1-way ANOVA with Tukey’s multiple comparisons test. n = 3 independent experiments with 60 to 90 cells analyzed for each experiment. Data are presented as mean ± SD. Abbreviations as in Figures 1 and 2.
Figure 6
Figure 6
zDHHC9 Overexpression Impairs Atrial Natriuretic Peptide Secretion in Cardiomyocytes (A) Immunoblotting and (B) quantification of atrial natriuretic peptide (ANP) in culture media from RNCMs transduced with adenoviruses to express wildtype zDHHC9 (Ad.Zdhhc9), enzymatically dead zDHHC9 (Zdhhc9DHHS), or βGal control. The membrane was Coomassie stained as a loading control. ∗P < 0.05, 1-way ANOVA with Tukey’s multiple comparisons test. (C) Immunoblotting and (D) quantification of intracellular ANP in cell lysates from RNCMs transduced with the indicated adenoviruses. Gapdh was used as a loading control. ∗∗ P<0.01, 1-way ANOVA with Tukey’s multiple comparisons test. (E) Representative images of RNCMs transduced with adenovirus to express GFP-Rab3a and wildtype zDHHC9 (Ad.Zdhhc9), enzymatically dead zDHHC9 (Zdhhc9DHHS), or βGal control and immunostained for endogenous ANP (red). Nuclei were stained with DAPI (blue). (F-G) Quantification of (F) relative ANP fluorescent intensity and (G) Pearson’s correlation coefficients for colocalization of GFP-Rab3a with ANP. ∗∗∗P < 0.001, 1-way ANOVA with Tukey’s multiple comparisons test. n = 3 independent experiments with 60 to 90 cells analyzed for each experiment. Data are presented as mean ± SD. Abbreviations as in Figures 1 and 2.
Figure 7
Figure 7
zDHHC9 Depletion Enhances Phenylephrine-induced Atrial Natriuretic Peptide Secretion (A) Immunoblotting and (B) quantification of zDHHC9 protein expression in RNCMs transfected with control siRNA (siControl) or siRNA targeting Zdhhc9 (siZdhhc9). ∗∗P < 0.01, 1-way ANOVA with Tukey’s multiple comparisons test. (C) Immunoblotting and (D) quantification of atrial natriuretic peptide (ANP) levels in culture media from RNCMs transfected with siControl or siZdhhc9 and treated with PBS or phenylephrine (PE). The membrane was Coomassie stained as a loading control. (E) Immunoblotting and (F) quantification of intracellular ANP in cell lysates from RNCMs transfected with siControl or siZdhhc9 with or without PE treatment. Gapdh was used as a loading control. ∗P < 0.05, 1-way ANOVA with Tukey’s multiple comparisons test. Data are presented as mean ± SD. Abbreviations as in Figures 1 and 2.
Figure 8
Figure 8
Knockdown of zDHHC9 Inhibits Phenylephrine-Induced Rab3gap1 Palmitoylation and Rab3a GTP Loading (A) Acyl-RAC followed by immunoblotting to detect palmitoylated Rab3gap1 in lysates of RNCMs transfected with siControl or siZdhhc9 and treated with PBS or phenylephrine (PE). Quantification of (B) palmitoylated and (C) total Rab3gap1 protein. n = 3 independent experiments. ∗∗P < 0.01, 1-way ANOVA with Tukey’s multiple comparisons test. (D) Immunoblotting and quantification of (E) Rab3a-GTP and (F) total Rab3a levels in siControl- or siZdhhc9-transfected RNCMs with adenoviral expression of GFP-Rab3a and treatment with PBS or PE. n = 3 independent experiments. ∗P < 0.05, 1-way ANOVA with Tukey’s multiple comparisons test. (G) Representative images of siControl- and siZdhhc9-transfected RNCMs with adenoviral expression of GFP-Rab3a and treatment with PBS or PE followed by immunostaining for endogenous ANP (red). Nuclei were stained with DAPI (blue). (H) Quantification of GFP-Rab3a and (I) ANP relative fluorescence intensity. ∗P < 0.05, 1-way ANOVA with Tukey’s multiple comparisons test. n = 3 independent experiments with 60 to 90 cells analyzed for each experiment. Data are presented as mean ± SD. Abbreviations as in Figures 1 and 2.
Figure 9
Figure 9
Atrial Natriuretic Peptide Secretion From Cardiomyocytes is Dependent on Rab3gap1 GAP Activity (A) Representative images of RNCMs transduced with adenoviruses for myc-tagged wildtype Rab3gap1 (Rab3gap1), a myc-tagged-GAP -deficient Rab3gap1 mutant (Rab3gap1R728A), or β-galactosidase control (βGal) and immunostained for myc (Rab3gap1, green) and GM130 (Golgi marker, red). (B) Representative images of RNCMs transduced with adenoviruses for GFP-Rab3a and either Rab3gap1, Rab3gap1R728A or βGal and immunostained for GM130 (Golgi marker, red). (C) Pearson’s correlation coefficients for colocalization of Rab3gap1 and GM130 in the indicated groups of RNCMs. n = 3 independent experiments with 60 to 90 cells analyzed for each experiment. (D) Quantification of GFP-Rab3a relative fluorescence intensity. n = 3 independent experiments with 60 to 90 cells analyzed for each experiment. (E) Immunoblotting and quantification of (F) Rab3a-GTP and (G) total Rab3a levels in RNCMs transduced with adenoviruses expressing βGal, Rab3gap1, or Rab3gap1R728A. Immunoblotting of (H) secreted and (I) intracellular ANP in RNCMs transduced with adenoviruses expressing βGal, Rab3gap1, or Rab3gap1R728A. Coomassie staining or immunoblotting for Gapdh were used as loading controls in H and I, respectively. Quantification of (J) secreted and (K) intracellular ANP levels in the indicated groups of RNCMs as shown in H and I, respectively. n = 3 independent experiments. ∗P < 0.05, ∗∗P < 0.01, and ∗∗∗P < 0.001, 1-way ANOVA with Tukey’s multiple comparisons test. Data are presented as mean ± SD. Abbreviations as in Figures 1 and 2.
Figure 10
Figure 10
Dysregulation of Rab3a, Rab3gap1, ANP, and Atrial Granule Morphology in zDHHC9 Overexpressing Hearts (A) Transmission electron microscopy images showing enhanced electron density of atrial granule core in zDHHC9-overexpressing hearts at 2 months of age: myofibrils (myo), mitochondria (mito), nucleus (Nuc) and Golgi apparatus (Golgi). Arrowheads indicate atrial granules. Scale bar = 600 nm. (B) Quantification of number of secretory granules per atrial myocyte cross-section in tTA and DTgZdhhc9 mice; 30 cells from 2 mice per genotype were quantified. (C) Rab3a subcellular localization at atrial granules. Transmission electron microscopy of tTA and DTgZdhhc9 atria with immunogold labeling of anti-Rab3a. Arrowheads indicate labeling of Rab3a at the periphery of secretory granules. There was minimal labeling on myofibrils (myo) and mitochondria (mito). Scale bar = 200 nm. (D) Immunoblotting and quantification of (E) Rab3gap1, (F) Rab3a, and (G) ANP protein levels in tTA and DTgZdhhc9 atria at 2 months of age. n =10 per genotype. (H) Representative images of immunostaining for ANP (green) and wheat germ agglutinin (WGA, red) staining to demarcate the cell membrane in cryosections from tTA and DTgZdhhc9 atria at 2 months of age. (F) Concentration of ANP (pg/mL) in serum from tTA and DTgZdhhc9 mice at 5 to 7 weeks of age. n =6 to 7. ∗P < 0.05, ∗∗∗P < 0.001 compared with tTA controls, Student's t-test with Welch’s correction. Data are presented as mean ± SD. Abbreviations as in Figures 1 and 2.

References

    1. Chamberlain L.H., Shipston M.J. The physiology of protein S-acylation. Physiol Rev. 2015;95:341–376. - PMC - PubMed
    1. Essandoh K., Philippe J.M., Jenkins P.M., Brody M.J. Palmitoylation: a fatty regulator of myocardial electrophysiology. Front Physiol. 2020;11:108. - PMC - PubMed
    1. Ernst A.M., Syed S.A., Zaki O., et al. S-palmitoylation sorts membrane cargo for anterograde transport in the Golgi. Dev Cell. 2018;47:479–493.e7. - PMC - PubMed
    1. Schmidt M.F., Schlesinger M.J. Fatty acid binding to vesicular stomatitis virus glycoprotein: a new type of post-translational modification of the viral glycoprotein. Cell. 1979;17:813–819. - PubMed
    1. Prescott G.R., Gorleku O.A., Greaves J., Chamberlain L.H. Palmitoylation of the synaptic vesicle fusion machinery. J Neurochem. 2009;110:1135–1149. - PubMed