. 2023 Aug;10(22):e2301110.
doi: 10.1002/advs.202301110. Epub 2023 Jun 16.

PDGF-BB-Dependent Neurogenesis Buffers Depressive-Like Behaviors by Inhibition of GABAergic Projection from Medial Septum to Dentate Gyrus

Affiliations

PDGF-BB-Dependent Neurogenesis Buffers Depressive-Like Behaviors by Inhibition of GABAergic Projection from Medial Septum to Dentate Gyrus

Hou-Hong Li et al. Adv Sci (Weinh). 2023 Aug.

Abstract

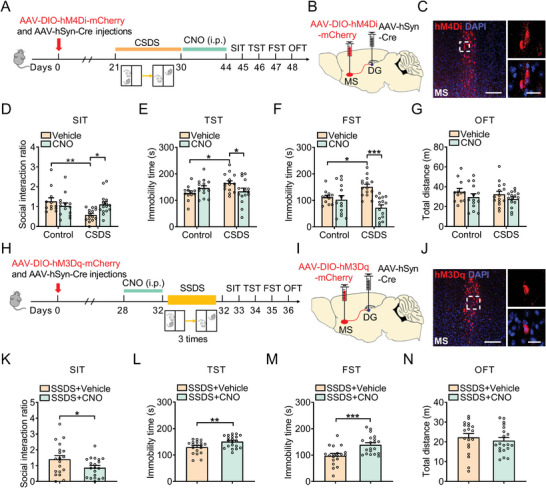
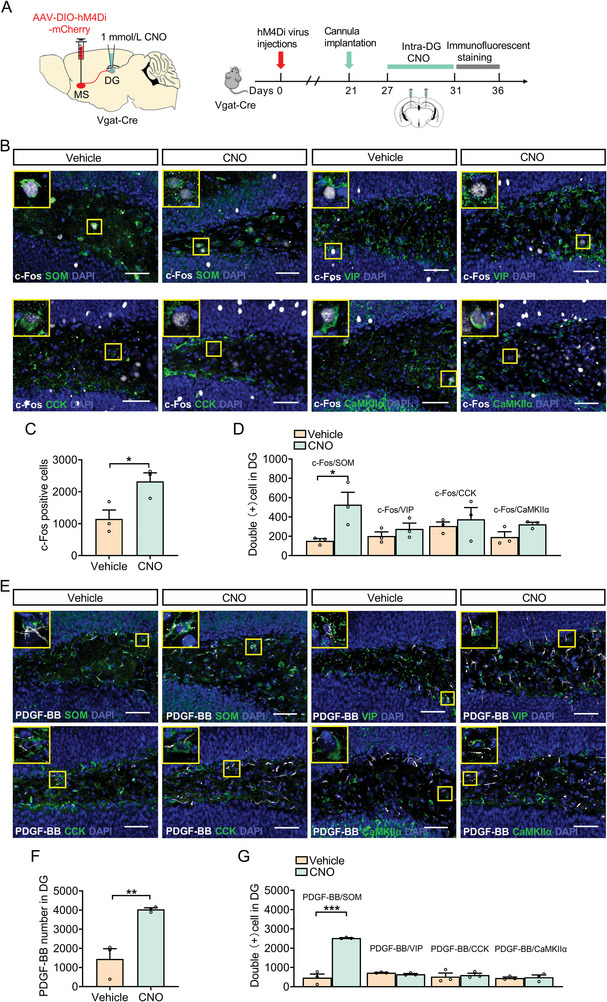
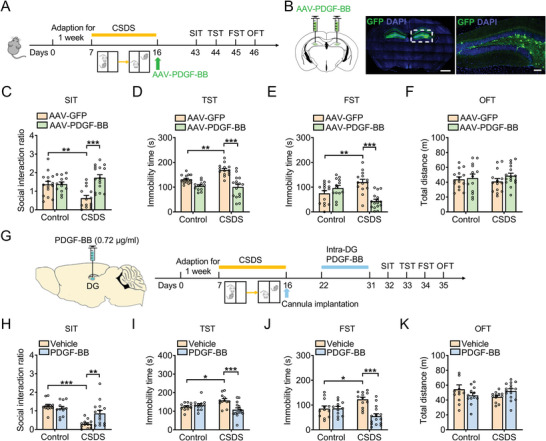
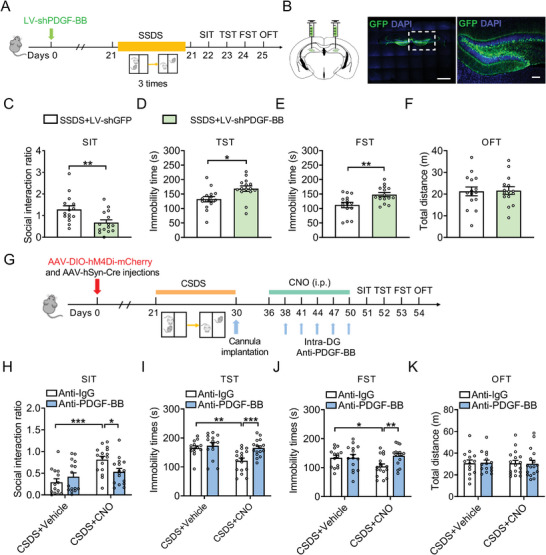
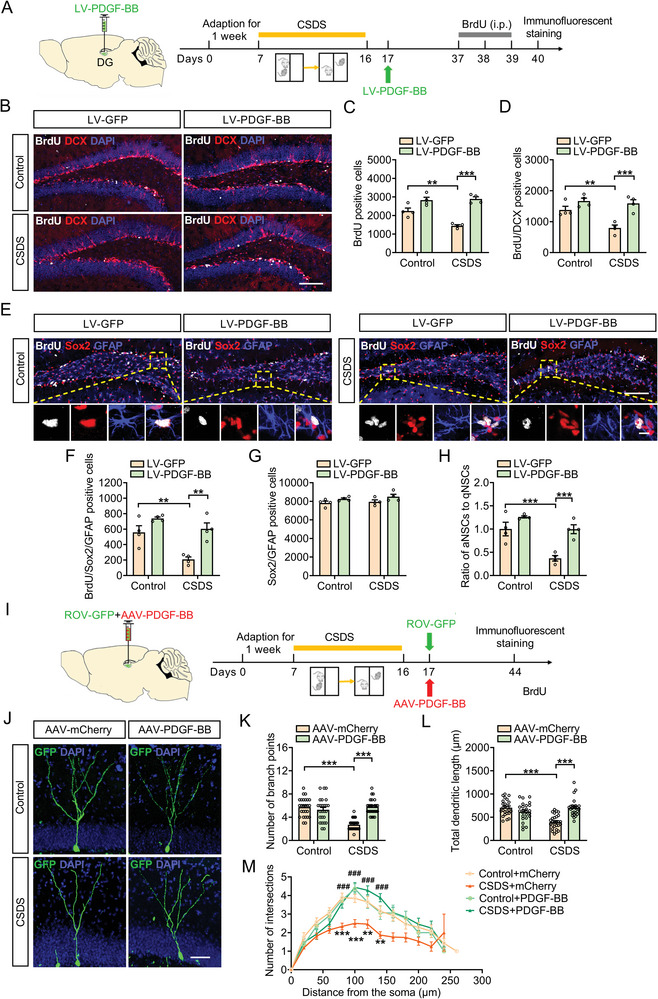
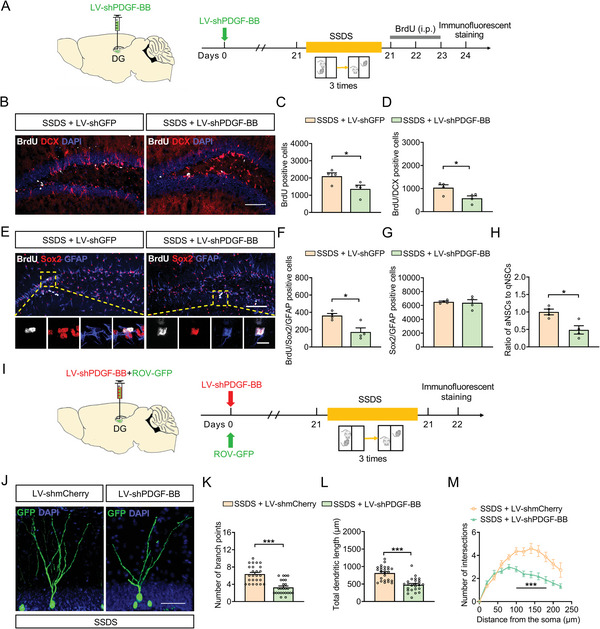
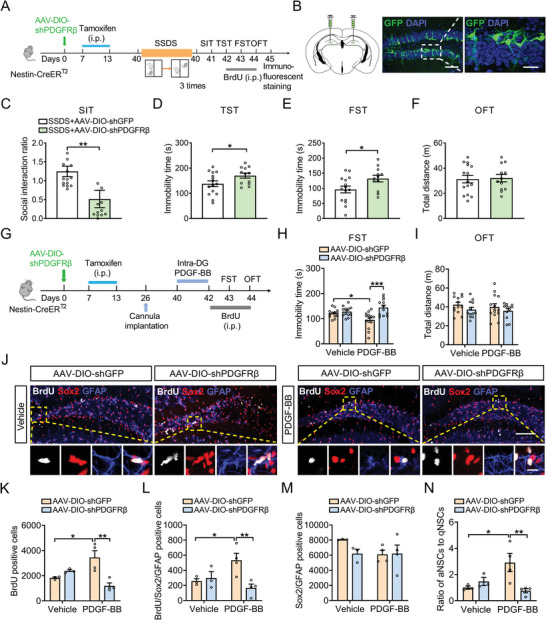
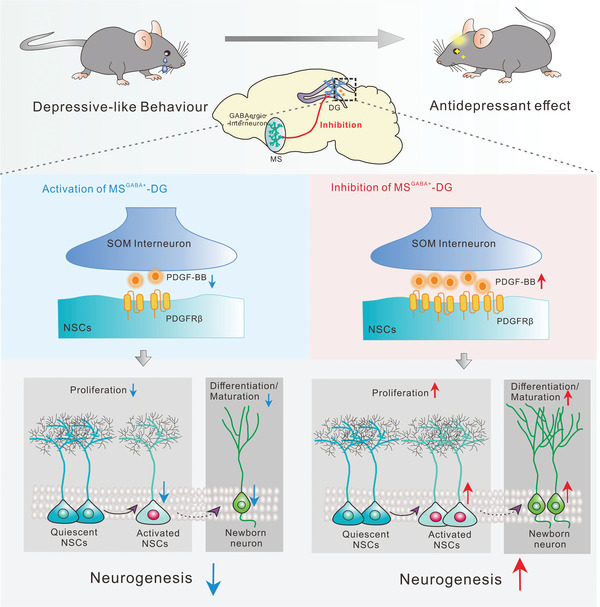
Hippocampal circuitry stimulation is sufficient to regulate adult hippocampal neurogenesis and ameliorate depressive-like behavior, but its underlying mechanism remains unclear. Here, it is shown that inhibition of medial septum (MS)-dentate gyrus (DG) circuit reverses the chronic social defeat stress (CSDS)-induced depression-like behavior. Further analysis exhibits that inhibition of gamma-aminobutyric acidergic neurons in MS projecting to the DG (MSGABA+ -DG) increases the expression of platelet-derived growth factor-BB (PDGF-BB) in somatostatin (SOM) positive interneurons of DG, which contributes to the antidepressant-like effects. Overexpression of the PDGF-BB or exogenous administration of PDGF-BB in DG rescues the effect of chronic stress on the inhibition of neural stem cells (NSCs) proliferation and dendritic growth of adult-born hippocampal neurons, as well as on depressive-like behaviors. Conversely, knockdown of PDGF-BB facilitates CSDS-induced deficit of hippocampal neurogenesis and promotes the susceptibility to chronic stress in mice. Finally, conditional knockdown platelet-derived growth factor receptor beta (PDGFRβ) in NSCs blocks an increase in NSCs proliferation and the antidepressant effects of PDGF-BB. These results delineate a previously unidentified PDGF-BB/PDGFRβ signaling in regulating depressive-like behaviors and identify a novel mechanism by which the MSGABA+ -DG pathway regulates the expression of PDGF-BB in SOM-positive interneurons.

Keywords: MS-DG pathway; PDGF-BB; depressive-like behaviors; neurogenesis.


Conflict of interest statement

The authors declare no conflict of interest.

Figures

Figure 1
Figure 1
Inhibition of MS‐DG pathway ameliorates depressive‐like behavior of mice. A) Experimental timeline of CSDS protocol and behavioral tests. B) Bilateral delivery of retrograde AAV‐expressing Cre‐recombinase in the DG and AAV carrying Cre‐dependent hM4Di‐mCherry into the MS of C57BL/6J mice. C) mCherry labeling (red) showing hM4Di‐expressing neuron in the DG at low (left) and high (right) magnification. Scale bar: 200 µm (left), 20 µm (right). D) Effects of chemogenetic inhibition of MS‐DG neurons on social interaction ratio in SIT. n = 12–15 per group. E) Effects of chemogenetic inhibition of MS‐DG neurons on the immobility time in TST. n = 12–15 per group. F) Effects of chemogenetic inhibition of MS‐DG neurons on the immobility time in FST. n = 12–15 per group. G) Effects of chemogenetic inhibition of MS‐DG neurons on the locomotor activity in OFT. n = 12–15 per group. H) Schematic of SSDS protocol detailing the timing for hM3Dq expression and behavioral tests. I) Bilateral delivery of retrograde AAV expressing Cre‐recombinase in the DG and AAV carrying Cre‐dependent hM3Dq‐mCherry into the MS of C57BL/6J mice. J) mCherry labeling (red) showing hM3Dq‐expressing neuron in the DG at low (left) and high (right) magnification. Scale bar: 200 µm (left), 20 µm (right). K) Effects of chemogenetic activation of MS‐DG neurons on social interaction ratio in SIT. n = 19–20 per group. L) Effects of chemogenetic activation of MS‐DG neurons on the immobility time in TST. n = 19–20 per group. M) Effects of chemogenetic activation of MS‐DG neurons on the immobility time in FST. n = 19–20 per group. N) Effects of chemogenetic inhibition of MS‐DG neurons on the locomotor activity in OFT. n = 19–20 per group. Data are expressed as mean ± SEM. Two‐way ANOVA followed by the Bonferroni's post hoc test (D–G), Student's t‐test (K–N). *p < 0.05, **p < 0.01, ***p < 0.001. The statistical details can be found in Table S4, Supporting Information.
Figure 2
Figure 2
Inhibition of MSGABA+‐DG projection increases PDGF‐BB expression in SOM‐positive neurons. A) Schematic of viral infusion and cannula implantation. Timeline of experimental procedure. B) Double‐stained c‐Fos (white) with SOM, VIP, CCK, and CaMKIIα (green) in the DG of mice treated with vehicle or CNO. Panels on the left are magnified images showing the colocalization of c‐Fos expression with SOM, VIP, CCK, and CaMKIIα. Scale bars: 50 µm. C) DREADD inhibition of MSGABA+‐DG projection led to an increase in c‐Fos expression in the DG. n = 3 per group. D) DREADD inhibition of MSGABA+‐DG projection led to an increase in c‐Fos expression in SOM‐positive neurons. n = 3 per group. E) Double‐stained PDGF‐BB (white) and SOM‐, VIP‐, CCK‐, and CaMKIIα (green)‐positive neurons in the DG of mice treated with vehicle or CNO. Panels on the left are magnified images showing the colocalization of PDGF‐BB expression with SOM, VIP, CCK, and CaMKIIα. Scale bars: 50 µm. F) DREADD inhibition of MSGABA+‐DG projection led to an increase in PDGF‐BB expression in DG. n = 3 per group. G) DREADD inhibition of MSGABA+‐DG projection led to an increase in PDGF‐BB expression in SOM‐positive neurons. n = 3 per group. Data are expressed as mean ± SEM. Student's t‐test (C, D, F, G). *p < 0.05, **p < 0.01, ***p < 0.001. The statistical details can be found in Table S4, Supporting Information.
Figure 3
Figure 3
Overexpression of PDGF‐BB reverses CSDS‐induced depressive‐like behaviors of mice. A) Experimental timeline of viral infusion, CSDS protocol, and behavioral tests. B) Representative photomicrographs of injection sites in the hippocampal DG and panels on the right are infected neurons. Scale bars: 1000 µm (left), 100 µm (right). C) Effects of PDGF‐BB overexpression on the social interaction ratio in SIT. n = 13–16 per group. D) Effects of PDGF‐BB overexpression on immobility time in TST. n = 13–16 per group. E) Effects of PDGF‐BB overexpression on the immobility time in FST. n = 13–16 per group. F) Effects of PDGF‐BB overexpression on the locomotor activity in OFT. n = 13–16 per group. G) Schematic timeline of CSDS protocol, PDGF‐BB treatment, and behavioral tests. H) Effects of PDGF‐BB treatment on the social interaction ratio in SIT. n = 12–15 per group. I) Effects of PDGF‐BB treatment on the immobility time in TST. n = 12–15 per group. J) Effects of PDGF‐BB treatment on the immobility time in FST. n = 12–15 per group. K) Effects of PDGF‐BB treatment on the locomotor activity in OFT. n = 12–15 per group. Data are expressed as mean ± SEM. Two‐way ANOVA followed by the Bonferroni's post hoc test (C–F, H–K). *p < 0.05, **p < 0.01, ***p < 0.001. The statistical details can be found in Table S4, Supporting Information.
Figure 4
Figure 4
Downregulation of PDGF‐BB in the DG promotes the susceptibility of mice to stress. A) Timeline of experiments of virus injection, SSDS protocol, and behavioral tests. B) Representative photomicrographs of injection sites in the hippocampal DG and panels on the right are infected neurons. Scale bars: 1000 µm (left), 100 µm (right). C) Effects of PDGF‐BB knockdown on the social interaction ratio of SIT in the mice exposed to SSDS. n = 15 per group. D) Effects of PDGF‐BB knockdown on the immobility time of TST in the mice exposed to SSDS. n = 15 per group. E) Effects of PDGF‐BB knockdown on the immobility time of FST in the mice exposed to SSDS. n = 15 per group. F) Effects of PDGF‐BB knockdown on the locomotor activity in OFT in the mice exposed to SSDS. n = 15 per group. G) Experimental design for anti‐PDGF‐BB treatment. H) Effects of CNO treatment for anti‐PDGF‐BB or anti‐IgG treated mice following CSDS on the social interaction ratio in SIT. n = 14–16 per group. I) Effects of CNO treatment for anti‐PDGF‐BB or anti‐IgG treated mice following CSDS on the immobility time in TST. n = 14–17 per group. J) Effects of CNO treatment for anti‐PDGF‐BB or anti‐IgG treated mice following CSDS on the immobility time in FST. n = 14–17 per group. K) Effects of CNO treatment for anti‐PDGF‐BB or anti‐IgG treated mice following CSDS on the locomotor activity in OFT. n = 14–17 per group. Data are expressed as mean ± SEM. Student's t‐test (C–F), Two‐way ANOVA followed by the Bonferroni's post hoc test (H–K). *p < 0.05, **p < 0.01, ***p < 0.001. The statistical details can be found in Table S4, Supporting Information.
Figure 5
Figure 5
Stress‐induced deficits in the adult hippocampal neurogenesis is blocked by PDGF‐BB overexpression. A) Experimental timelines for CSDS protocol, viral infection, and the BrdU injection protocol. B) Immunofluorescence images for BrdU (white), DCX (red) within the SGZ of the hippocampus in control or defeated mice injected with LV‐GFP or LV‐PDGF‐BB. Scale bar: 100 µm. C) Quantification of the number of BrdUpositive cells in SGZ of hippocampus after PDGF‐BB overexpression. n = 4 per group. D) Quantification of the number of BrdU/DCXpositive cells in SGZ of the hippocampus after PDGF‐BB overexpression. n = 4 per group. E) Immunofluorescence images for BrdU (white), Sox2 (red), and GFAP (blue) within the SGZ of the hippocampus in in control or defeated mice injected with LV‐GFP or LV‐PDGF‐BB. Panels on the below are magnified images showing that the colocalization of BrdU expression with GFAP and Sox2. Scale bar: 100 µm (top), 10 µm (below). F) Quantification of the number of BrdU/Sox2/GFAPpositive NSCs in SGZ of the hippocampus after PDGF‐BB overexpression. n = 4 per group. G) Quantification of the number of Sox2/GFAPpositive NSCs in SGZ of the hippocampus after PDGF‐BB overexpression. n = 4 per group. H) The ratio of aNSCs to qNSCs. n = 4 per group. I) Experimental timelines for CSDS protocol, PDGF‐BB treatment, and the virus injection protocol. J) Representative images of ROV‐GFP‐labeled newborn neurons in AAV‐mCherry or AAV‐PDGF‐BB‐injected mice 4 weeks after retrovirus injection. Scale bars: 50 µm. K) Quantification of branch number of ROV‐GFP‐labeled newborn neurons in AAV‐mCherry or AAV‐PDGF‐BB‐injected mice 4 weeks after retrovirus injection. n = 25–27 neurons per group. L) Quantification of dendritic length of ROV‐GFP‐labeled newborn neurons in AAV‐mCherry or AAV‐PDGF‐BB‐injected mice 4 weeks after retrovirus injection. n = 25–27 neurons per group. M) Sholl analysis of dendritic complexity of ROV‐GFP‐labeled newborn neurons in AAV‐mCherry or AAV‐PDGF‐BB‐injected mice 4 weeks after retrovirus injection. n = 23–27 neurons per group. Data are expressed as mean ± SEM. Two‐way ANOVA followed by the Bonferroni's post hoc test (C, D, F–H, K–M). *p < 0.05, **p < 0.01, ***p < 0.001. The statistical details can be found in Table S4, Supporting Information.
Figure 6
Figure 6
Downregulation of PDGF‐BB impairs adult hippocampal neurogenesis and dendritic morphogenesis of DG. A) Experimental timelines for viral infection, SSDS protocol, and BrdU injection. B) Immunofluorescence images for BrdU (white), DCX (red) within the SGZ of the hippocampus in control or SSDS‐treated mice injected with LV‐shGFP or LV‐shPDGF‐BB. Scale bar: 100 µm. C) Quantification of the number of BrdUpositive cells in the SGZ of hippocampus of mice injected with LV‐shGFP or LV‐shPDGF‐BB. n = 4 per group. D) Quantification of the number of BrdU/DCXpositive cells in the SGZ of hippocampus of mice injected with LV‐shGFP or LV‐shPDGF‐BB. n = 4 per group. E) Immunofluorescence images for BrdU (white), Sox2 (red), and GFAP (blue) in the SGZ of hippocampus of control or defeated injected with LV‐shGFP or LV‐shPDGF‐BB. Panels on the below are magnified images showing that the colocalization of BrdU expression with GFAP and Sox2. Scale bar: 100 µm (top), 10 µm (below). F) Quantification of the number of BrdU/Sox2/GFAPpositive NSCs in the SGZ of hippocampus of mice injected with LV‐shGFP or LV‐shPDGF‐BB. n = 4 per group. G) Quantification of the number of Sox2/GFAPpositive NSCs in the SGZ of hippocampus of mice injected with LV‐shGFP or LV‐shPDGF‐BB. n = 4 per group. H) The ratio of aNSCs to qNSCs. n = 4 per group. I) Experimental timelines for viral infection and SSDS protocol. J) Representative images of ROV‐GFP labeled newborn neurons in LV‐shmCherry or LV‐shPDGF‐BB‐injected stressed mice 4 weeks after retrovirus injection. Scale bars = 50 µm. K) Quantification of branch number of ROV‐GFP labeled newborn neurons in LV‐shmCherry or LV‐shPDGF‐BB‐injected stressed mice 4 weeks after retrovirus injection. n = 25 neurons per group. L) Quantification of dendritic length of ROV‐GFP labeled newborn neurons in LV‐shmCherry or LV‐shPDGF‐BB‐injected stressed mice 4 weeks after retrovirus injection. n = 25 neurons per group. M) Sholl analysis of dendritic complexity of ROV‐GFP labeled newborn neurons in LV‐shmCherry or LV‐shPDGF‐BB‐injected stressed mice 4 weeks after retrovirus injection. n = 17–25 neurons per group. All data are presented as the mean ± SEM. Student's t‐test (C, D, F–H, K–M). *p < 0.05, **p < 0.01, ***p < 0.001. The statistical details can be found in Table S4, Supporting Information.
Figure 7
Figure 7
Knockdown of PDGFRβ from NSCs leads to depressive‐like behaviors through impairing adult hippocampal neurogenesis. A) Experimental design of virus‐mediated delivery of PDGFRβ gene into Nestin‐CreERT2 mice, and the BrdU injection protocol. B) Stereotaxic injection of AAV‐DIO‐shGFP or AAV‐DIO‐shPDGFRβ into DG. Scale bar: 100 µm (left), 20 µm (right). C) Effects of PDGFRβ knockdown after SSDS on the social interaction ratio in SIT. n = 12–15 neurons per group. D) Effects of PDGFRβ knockdown after SSDS on the immobility time in TST. n = 12–15 neurons per group. E) Effects of PDGFRβ knockdown after SSDS on the immobility time in FST. n = 12–15 neurons per group. F) Effects of PDGFRβ knockdown after SSDS on the locomotor activity in OFT. n = 12–15 neurons per group. G) Schematic timeline of viral infection, PDGF‐BB treatment and BrdU injection. H) Effects of PDGF‐BB treatment on the immobility time in FST for AAV‐DIO‐shGFP and AAV‐DIO‐shPDGFRβ‐injected mice. n = 12–14 per group. I) Effects of PDGF‐BB treatment on the locomotor activity in the OFT for AAV‐DIO‐shGFP and AAV‐DIO‐shPDGFRβ‐injected mice. n = 12–14 per group. J) Immunofluorescence images for GFAP (blue), Sox2 (red), and BrdU (white) in the SGZ of the hippocampus in AAV‐DIO‐shGFP and AAV‐DIO‐shPDGFRβ‐injected mice treated with vehicle or PDGF‐BB. Panels on the below are magnified images showing that the colocalization of BrdU expression with GFAP and Sox2. Scale bar: 100 µm (top), 10 µm (below). K) Quantification of the number of BrdUpositive cells in the DG of hippocampus in AAV‐DIO‐shGFP and AAV‐DIO‐shPDGFRβ‐injected mice treated with vehicle or PDGF‐BB. n = 3–4 per group. L) Quantification of the number of BrdU/Sox2/GFAPpositive NSCs in the SGZ of the hippocampus in AAV‐DIO‐shGFP and AAV‐DIO‐shPDGFRβ‐injected mice treated with vehicle or PDGF‐BB. n = 3–4 per group. M) Quantification of the number of Sox2/GFAPpositive NSCs in the SGZ of the hippocampus in AAV‐DIO‐shGFP and AAV‐DIO‐shPDGFRβ‐injected mice treated with vehicle or PDGF‐BB. n = 3–4 per group. N) The ratio of aNSCs to qNSCs in the SGZ of the hippocampus in AAV‐DIO‐shGFP and AAV‐DIO‐shPDGFRβ‐injected mice treated with vehicle or PDGF‐BB. n = 3–4 per group. Data are expressed as mean ± SEM. Student's t‐test (C–F), Two‐way ANOVA followed by the Bonferroni's post hoc test (H, I, K–N). *p < 0.05, **p < 0.01, ***p < 0.001. The statistical details can be found in Table S4, Supporting Information.
Figure 8
Figure 8
A model depicting the role of PDGF‐BB in the CSDS‐induced depressive‐like behavior. Chronic chemogenetic inhibition of MS‐DG projection neurons induced the elevation of PDGF‐BB in SOM‐positive interneurons in the DG, which enhanced adult hippocampal neurogenesis via acting on PDGFRβ in the NSCs and alleviated CSDS‐induced depressive‐like behavior. On the contrary, activation of MS‐DG projection neurons induced depressive‐like behavior in the mice exposed to SSDS by decreasing the expression of PDGF‐BB in the DG, resulting in the impairment of adult hippocampal neurogenesis.

References

    1. Davis A. K., Barrett F. S., May D. G., Cosimano M. P., Sepeda N. D., Johnson M. W., Finan P. H., Griffiths R. R., JAMA Psychiatry 2021, 78, 481. - PMC - PubMed
    1. a) Belmaker R. H., Agam G., N. Engl. J. Med. 2008, 358, 55; - PubMed
    2. b) Cohen S., Janicki‐Deverts D., Miller G. E., JAMA, J. Am. Med. Assoc. 2007, 298, 1685; - PubMed
    3. c) Russo S. J., Nestler E. J., Nat. Rev. Neurosci. 2013, 14, 609. - PMC - PubMed
    1. a) Leuner B., Gould E., Annu. Rev. Psychol. 2010, 61, 111; - PMC - PubMed
    2. b) Yun S., Reynolds R. P., Masiulis I., Eisch A. J., Nat. Med. 2016, 22, 1239; - PMC - PubMed
    3. c) Boldrini M., Santiago A. N., Hen R., Dwork A. J., Rosoklija G. B., Tamir H., Arango V., Mann J. John, Neuropsychopharmacology 2013, 38, 1068; - PMC - PubMed
    4. d) Milne A., MacQueen G. M., Yucel K., Soreni N., Hall G. B., NeuroImage 2009, 47, 36. - PubMed
    1. a) Moss J., Toni N., BioEssays 2013, 35, 28; - PubMed
    2. b) Ming G. L., Song H., Neuron 2011, 70, 687. - PMC - PubMed
    1. Yun S., Reynolds R. P., Petrof I., White A., Rivera P. D., Segev A., Gibson A. D., Suarez M., DeSalle M. J., Ito N., Mukherjee S., Richardson D. R., Kang C. E., Ahrens‐Nicklas R. C., Soler I., Chetkovich D. M., Kourrich S., Coulter D. A., Eisch A. J., Nat. Med. 2018, 24, 658. - PMC - PubMed

Publication types

LinkOut - more resources