. 2023 Jul 21;51(13):6593-6608.
doi: 10.1093/nar/gkad527.

Achieving pan-microbiome biological insights via the dbBact knowledge base

Affiliations

Achieving pan-microbiome biological insights via the dbBact knowledge base

Amnon Amir et al. Nucleic Acids Res. .

Abstract

16S rRNA amplicon sequencing provides a relatively inexpensive culture-independent method for studying microbial communities. Although thousands of such studies have examined diverse habitats, it is difficult for researchers to use this vast trove of experiments when interpreting their own findings in a broader context. To bridge this gap, we introduce dbBact - a novel pan-microbiome resource. dbBact combines manually curated information from studies across diverse habitats, creating a collaborative central repository of 16S rRNA amplicon sequence variants (ASVs), which are assigned multiple ontology-based terms. To date dbBact contains information from more than 1000 studies, which include 1500000 associations between 360000 ASVs and 6500 ontology terms. Importantly, dbBact offers a set of computational tools allowing users to easily query their own datasets against the database. To demonstrate how dbBact augments standard microbiome analysis we selected 16 published papers, and reanalyzed their data via dbBact. We uncovered novel inter-host similarities, potential intra-host sources of bacteria, commonalities across different diseases and lower host-specificity in disease-associated bacteria. We also demonstrate the ability to detect environmental sources, reagent-borne contaminants, and identify potential cross-sample contaminations. These analyses demonstrate how combining information across multiple studies and over diverse habitats leads to better understanding of underlying biological processes.


Figures

Graphical Abstract
Graphical Abstract
Figure 1.
Figure 1.
Steps in adding entries to dbBact. Users add new entries in a wiki-like way, by uploading study results. a. For example, analyzing data from Ijaz et al. (36), we identified 189 ASVs that are more abundant in fecal samples of Scottish children with Crohn's disease compared to healthy controls (see Methods section). b. These ASVs are uploaded as a FASTA file. c. Associations between ASVs and phenotypes are called annotations, which are created by assigning a set of ontology terms and predicates that characterize the context. The 189 ASVs were annotated as ‘DIFFERENTIAL,’ i.e. having a higher relative abundance in children with Crohn's disease (‘HIGHER IN’ terms), compared to healthy controls (‘LOWER IN’ terms). The general background terms common to both groups, i.e. ‘homo sapiens,’ ‘feces’ and ‘glasgow’ are designated by ‘SOURCE.’ Terms may be selected from several ontologies (e.g. DOID (37), ENVO (38,39), GAZ (40), UBERON (41), EFO (42), and NCBI Taxonomy (12)), allowing easy and precise annotations. d. Uploading annotations may be performed either through the dbBact website, dedicated clients (i.e. Calour (43)) or by REST-API. For clarity, the following nomenclature holds throughout the manuscript where ‘reserved’ words appear in italics (e.g. experiment, sequence, annotation, term), predicates appear in all caps (e.g. ‘HIGHER IN,’ ‘LOWER IN,’ ‘SOURCE’), and specific term names follow the ontology convention of being lower case (e.g. ‘homo sapiens’).
Figure 2.
Figure 2.
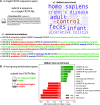
dbBact provides two basic query types: A. Uploading a FASTA file of ASVs results in a list of the most relevant annotations containing these sequences, and a ‘word cloud’ of best matching terms. In this example, a V4 ASV of Clostridium XIVa, which is highly abundant in fecal samples of chronic fatigue syndrome patients (CSF), as detected by Giloteaux et al. (44), was submitted. Panel a1 provides representative annotations containing the query ASV (the full list of ∼150 annotations appears in Supplementary File 3). dbBact found this ASV to have higher relative abundance in the disease group than in healthy controls in several studies (ulcerative colitis, irritable bowel disease, and lupus), and in antibiotic-treated mice supplemented with probiotics (last annotation arising from (45)). Panel a2 displays the word cloud summarizing the terms associated with the query ASV. The size corresponds to a term’s F1 score, while color designates the associated predicate, i.e. blue for ‘SOURCE’/’HIGHER IN’ terms, and red color preceded by a minus sign corresponds to ‘LOWER IN’ terms. Intensity corresponds to reliability, where the lighter the color the less annotations are associated with the term. Hence, this Clostridium XIVa query ASV is associated with human feces in dysbiosis states of ‘crohn's disease,’ ‘ulcerative colitis,’ ‘diarrhea,’ and ‘c. difficile infection’ (a full list of F1 scores per term appears in Supplementary File 7). B. By contrasting two groups of ASVs, dbBact identifies enriched terms characterizing each group. For example, 137 and 56 ASVs were submitted, corresponding to differentially abundant ASVs with higher relative abundance in fecal samples from domestic dogs and wolves living in zoos, respectively (data from (46)). Bar lengths show the normalized rank-mean difference for the top significantly enriched terms in the dog and wolf ASVs (green and red bars, respectively). Term enrichment is based on a non-parametric rank mean test with FDR < 0.1 using dsFDR (see the term enrichment analysis section in Methods). The numbers in the bar of each term correspond to the number of dbBact experiments in which the term differs significantly between the two ASV groups (numerator) and the total of dbBact experiments containing the term (denominator). Sequences that were more abundant in the wolf group are enriched in terms related to wolf, meat diet, and cheetah (Acinonyx jubatus).
Figure 3.
Figure 3.
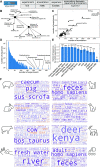
The scope and comprehensiveness of dbBact. A. Scope of dbBact release 2022.07 (used for the analysis presented in this paper). B. The number of experiments for representative disease categories based on the DOID ontology. C. Scatter plot of the total number of annotations and experiments in which each dbBact term appears. D. Histogram of the number of experiments in which each dbBact sequence appears. E. Knowledge base comprehensiveness. The fraction of ‘COMMON’ sequences from each experiment that have been annotated in additional experiments is shown for various terms. The number of experiments containing the term is designated above each bar. F. Comprehensiveness in a source tracking task. Sequences from eight sample types from Hägglund et al. were blindly submitted to dbBact. Their word clouds clearly display the sources of the samples (shown by the matched cartoon). Term sizes correspond to the F1 score of each term, combined for all sequences present in > 0.3 of the samples (for each sample type).
Figure 4.
Figure 4.
Sequence-based analysis provides more accurate genotype-to-phenotype associations compared to taxonomy-based associations. A,B. Two ASVs of the genus Blautia, that differ by nine bases over the 150nt Illumina read of the 16S rRNA V4 region are associated with opposite phenotypes, as discovered by dbBact. The two word clouds and annotations for each ASV, display ‘opposite’ associations with disease. The left ASV (A) is more prevalent in healthy subjects (‘good’ Blautia), whereas the other (B) is highly abundant in a series of disease-related annotations. Such differences can be traced through dbBact, but are completely missed by a taxonomy-based analysis. C. The number of disease-related annotations for the two Blautia ASVs across dbBact displays an opposite trend of being low and high in disease, for the ‘good’ and ‘bad’ Blautia, respectively. The total number of annotations in dbBact 2022.07.01 associated with the ‘good’ and ‘bad’ Blautia sequences is 377 and 124, respectively.
Figure 5.
Figure 5.
dbBact links caloric restriction associated bacteria to other phenotypes. A. Heatmap displaying bacterial relative abundances across fecal samples (rows) of low BMI individuals (BMI < 25) practicing either a caloric restriction diet (CR, n = 33) or without dietary restrictions (AMER, n = 66), over a set of sequences (columns) that are significantly higher in either group. A differential abundance test (rank-mean test with dsFDR = 0.1 multiple hypothesis correction) identified 136 bacteria whose relative abundance was higher in the CR group (S-CR) and 27 bacteria higher in the AMER group (S-AMER). B. dbBact terms (rows) enriched in the sequences appearing in panel A (columns in panels A and B are aligned). Heatmap values indicate the term score for each bacterium. Terms were identified using a non-parametric rank mean difference test with dsFDR = 0.1 (top 6 terms for each direction are shown; see Supplementary File 4 for full list of enriched terms). C. Summary of the top enriched terms in the CR and AMER diets (green and red bars, respectively). Bar length and numbers are as in Figure 2. D. Venn diagrams of dbBact annotations related to the terms ‘low bmi’ (right) and ‘high bmi’ (left). Green and red circles indicate the number of sequences associated with the term in the CR and AMER diets, respectively; the blue circle indicates the number of such sequences across dbBact as a whole. The intersections of ‘low bmi’ bacteria with the CR group are significantly higher (p = 7E-5, using two-sided Fisher's exact test), confirming the association. Similarly, the intersection of ‘high bmi’ annotated sequences across dbBact with the AMER group is significantly higher than that with the CR group (p = 3E-17, using two-sided Fisher's exact test).
Figure 6.
Figure 6.
dbBact leads to novel biological hypotheses. A. Summary of biological hypotheses derived from dbBact-based analysis of published studies. Details of each analysis are given in the corresponding Supplementary Results section. Row colors correspond to hypothesis ‘type’ (inter-host similarities – green; intra-host similarities – blue; inter-disease similarities – gray; environmental sources – brown; contamination detection – red). B-E. Analysis results related to conclusions shown in panel a. B. dbBact term word cloud for sequences found in sea otter oral samples shows resemblance to dogs’ and cats’ samples. C. Venn diagram showing number of dbBact sequences associated with the term ‘monkey’ across dbBact (blue), and their intersection with sequences found in individuals from the American Gut study, who consume a high (green) and low (red) number of fruits per week. Sequences in the high-fruit consumption group are significantly more associated with the term ‘monkey’ (Fisher's exact test p-value < 0.00001). D. dbBact term enrichment comparing water samples collected in Hunts Point and Soundview Park, along the Bronx River in New York. Sequences whose relative abundance was higher in Hunts Point (green, located upstream) show significant fresh-water-related term enrichment (dsFDR = 0.1). E.Term-based principal coordinate analysis (PCA) of fecal samples of one individual collected daily for one year. The first principal component is the ‘feces-skin’ axis, where higher values correspond to ‘skin’ (see Methods for details). The values of a subset of samples, shown in magenta, is high, indicating possible skin-derived contamination in these fecal samples.

References

    1. Smil V. The Earth's Biosphere: Evolution, Dynamics, and Change. 2003; MIT Press.
    1. Herlemann D.P.R., Labrenz M., Jürgens K., Bertilsson S., Waniek J.J., Andersson A.F.. Transitions in bacterial communities along the 2000 km salinity gradient of the Baltic Sea. ISME J. 2011; 5:1571–1579. - PMC - PubMed
    1. Bahram M., Hildebrand F., Forslund S.K., Anderson J.L., Soudzilovskaia N.A., Bodegom P.M., Bengtsson-Palme J., Anslan S., Coelho L.P., Harend H.et al. .. Structure and function of the global topsoil microbiome. Nature. 2018; 560:233–237. - PubMed
    1. Peiffer J.A., Spor A., Koren O., Jin Z., Tringe S.G., Dangl J.L., Buckler E.S., Ley R.E.. Diversity and heritability of the maize rhizosphere microbiome under field conditions. Proc. Natl. Acad. Sci. U.S.A. 2013; 110:6548–6553. - PMC - PubMed
    1. Muegge B.D., Kuczynski J., Knights D., Clemente J.C., González A., Fontana L., Henrissat B., Knight R., Gordon J.I.. Diet drives convergence in gut microbiome functions across mammalian phylogeny and within humans. Science. 2011; 332:970–974. - PMC - PubMed

Publication types