. 2023 Jul 14;108(8):1835-1874.
doi: 10.1210/clinem/dgad225.

Hormones and Aging: An Endocrine Society Scientific Statement

Affiliations

Hormones and Aging: An Endocrine Society Scientific Statement

Anne R Cappola et al. J Clin Endocrinol Metab. .

Abstract

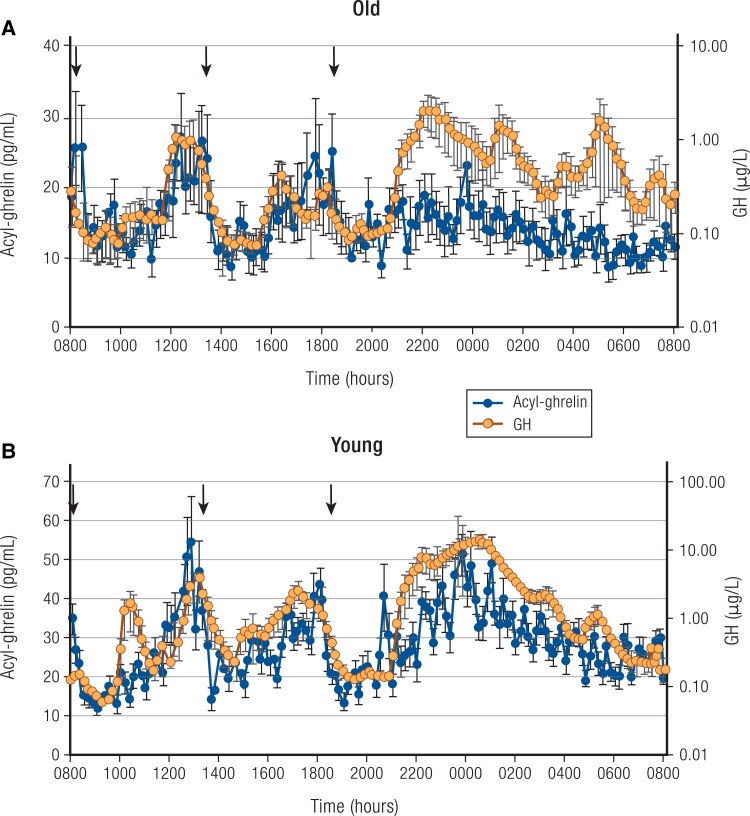
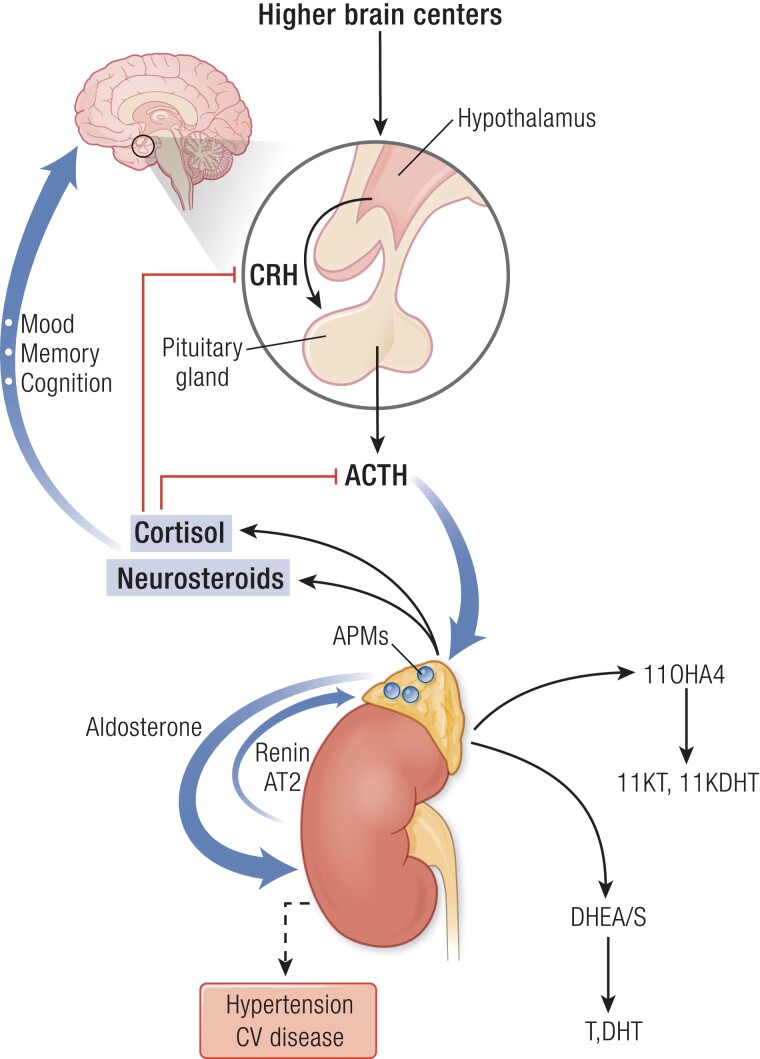
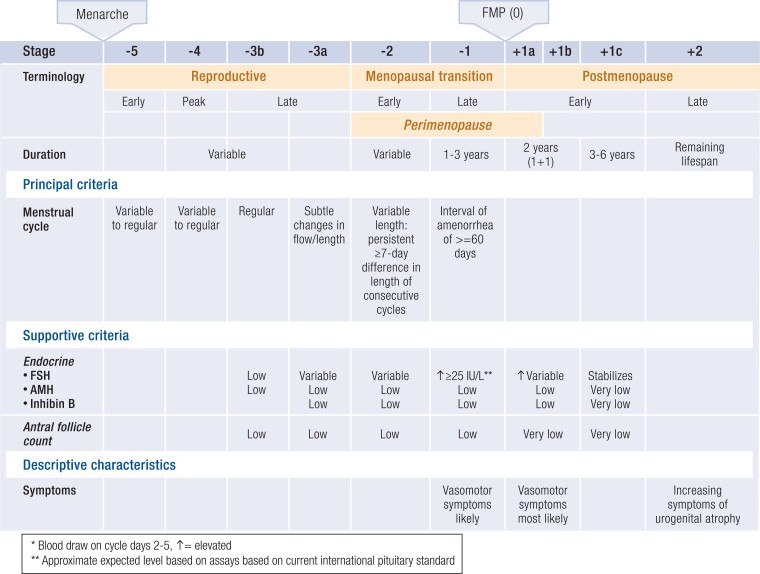
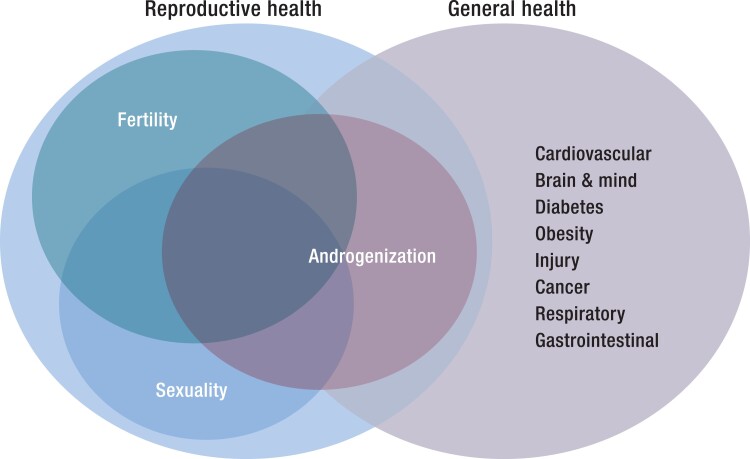
Multiple changes occur across various endocrine systems as an individual ages. The understanding of the factors that cause age-related changes and how they should be managed clinically is evolving. This statement reviews the current state of research in the growth hormone, adrenal, ovarian, testicular, and thyroid axes, as well as in osteoporosis, vitamin D deficiency, type 2 diabetes, and water metabolism, with a specific focus on older individuals. Each section describes the natural history and observational data in older individuals, available therapies, clinical trial data on efficacy and safety in older individuals, key points, and scientific gaps. The goal of this statement is to inform future research that refines prevention and treatment strategies in age-associated endocrine conditions, with the goal of improving the health of older individuals.

Keywords: adrenal; androgen; diabetes; endocrinology; estrogen; growth hormone; osteoporosis; thyroid; vitamin D; water metabolism.


Figures

Figure 1.
Figure 1.
24-hour mean (±SEM) profiles of acyl-ghrelin (left axis) and GH (right axis, note log scale) in 6 healthy older adults (A) and 8 healthy young men (B); young adults are included for comparison. Note different scales for old (upper panel) and young (lower panel) between groups. Arrows indicate standardized meals at 8:00 Am, 1:00 Pm, and 6:00 Pm. Subjects were allowed to sleep after 9:00 Pm. Also, note that in the older adults, GH was assayed in singlicates, which may contribute to some additional measurement variability in this group. Redrawn from Nass R et al (5). © Endocrine Society.
Figure 2.
Figure 2.
The hypothalamus integrates signals from the environment and higher brain centers to release corticotropin-releasing hormone (CRH), which stimulates pituitary production of adrenocorticotropin (ACTH). ACTH drives production of cortisol, as well as neurosteroids and their precursors, 11β-hydroxyandrostenedione (11OHA4), and dehydroepiandrosterone and its sulfate (DHEA[S]). Cortisol provides negative feedback (red lines) to the hypothalamus and pituitary, not just to cortisol but also to all other ACTH-stimulated steroids. DHEA and DHEAS can be metabolized to the androgens testosterone and dihydrotestosterone (T, DHT), whereas 11OHA4 is metabolized to the androgens 11-ketotestosterone (11KT) and 11-ketodihydrotestosterone (11KDHT). Cortisol and neurosteroids exert important actions on the brain that control mood, memory, and cognition. Independently, aldosterone is produced under the renin-angiotensin 2 (AT2) system, or autonomously such as from aldosterone-producing micronodules (APMs). Aldosterone regulates sodium balance, and aldosterone excess causes hypertension and cardiovascular (CV) disease. In aging, cortisol negative feedback is attenuated, and while DHEAS production falls, cortisol and 11OHA4 synthesis is preserved. APMs increase with age, and the potential deleterious effects of cortisol and aldosterone excess are magnified with aging.
Figure 3.
Figure 3.
The Staging of Reproductive Aging Workshop (STRAW)+10 staging system for reproductive aging in women. Abbreviations: AMH, anti-Mullerian hormone; FMP, final menstrual period; FSH, follicle-stimulating hormone. Redrawn from Harlow SD et al (59). © Endocrine Society.
Figure 4.
Figure 4.
Overlap of the 3 dimensions of men's reproductive health—fertility, sexuality and androgenization—with general health. There is overlap of all dimensions but greatest for androgenization.
Figure 5.
Figure 5.
Age-specific profile of serum testosterone in men. Left panel comprises 58 374 consecutive serum samples over 7 years measured in a single immunoassay and pathology laboratory with population centiles deduced by smoothed GAMLSS methodology. Right panel comprises 10 900 serum samples pooled from 3 population-based Australian studies showing the raw scatter (black dots), height and weight-adjusted scatter (red dots), and the smoothed median (green solid line) deduced by GAMLSS methodology. Redrawn and adapted from Handelsman DJ et al Ann Clin Biochem, 2015; 53(3):377-385, © SAGE Publications (left), and redrawn from Handelsman DJ et al (168), © 2015 European Society of Endocrinology (right).
Figure 6.
Figure 6.
Distribution of TSH concentrations in a reference population from the National Health and Nutrition Examination Survey. Redrawn from Surks MI & Hollowell JG (210). © Endocrine Society.
Figure 7.
Figure 7.
Prevalence of hip, spine, and all fractures in women by decade of age in the DUBBO study. The combination of hip and spine fractures comprised 24% of all fractures between ages 60 and 69, 44% between ages 70 and 79 years, and 67% in those 80 years and older. Redrawn and adapted Center JR et al (239). © Elsevier Ltd.
Figure 8.
Figure 8.
Relationship between age and hip fracture risk in women with femoral neck T-score values of < −1 and < −2.5. Redrawn and adapted from Kanis JA et al (251). © International Osteoporosis Foundation and National Osteoporosis Foundation.
Figure 9.
Figure 9.
Vitamin D metabolism. Reprinted with permission from Fuleihan GEH et al (283). © American Society for Bone and Mineral Research.
Figure 10.
Figure 10.
Natural history of progression from normal glucose tolerance to type 2 diabetes with aging, Baltimore Longitudinal Study of Aging. Redrawn from Meigs JB et al (345). © American Diabetes Association.
Figure 11.
Figure 11.
Plasma sodium concentration (Na+]) and total water intake in healthy older and younger subjects following 24 hours of dehydration. Baseline sodium concentrations before dehydration (Pre) and after dehydration (Post) are shown. Free access to water was allowed for 60 minutes following dehydration starting at time = 0 minutes. Cumulative water intake during the free drinking period by young and old subjects is depicted in the bar graph. Despite a greater initial increase in serum [Na+], older participants drank significantly less water, resulting in lesser correction of the elevated serum [Na+]. Redrawn with permission from Phillips PA, Johnston CI, & Gray L. Thirst and fluid intake in the elderly. In Ramsay DJ, Booth DA eds., Thirst: Physiological and Psychological Aspects. London; Springer-Verlag, 1991. © Springer-Verlag London Limited.
Figure 12.
Figure 12.
Total traveled way measured by the center of pressure during a dynamic walking test consisting of 3 stereotyped steps “in tandem,” eyes open, in 3 patients (A–C) with mild asymptomatic hyponatremia before (left) and after (right) correction. Patients are walking from right to left. Markedly irregular paths of the center of pressure were observed in the hyponatremia condition (arrows). Redrawn from Renneboog B et al (409). © Elsevier Inc.

Comment in

References

    1. United Nations, Department of Economic and Social Affairs, population division 2019. World Population Ageing 2019: Highlights (ST/ESA/SER.A/430).
    1. Zadik Z, Chalew SA, McCarter RJ Jr, Meistas M, Kowarski AA. The influence of age on the 24-hour integrated concentration of growth hormone in normal individuals. J Clin Endocrinol Metab. 1985;60(3):513‐516. - PubMed
    1. Giustina A, Veldhuis JD. Pathophysiology of the neuroregulation of growth hormone secretion in experimental animals and the human. Endocr Rev. 1998;19(6):717‐797. - PubMed
    1. Nass R, Pezzoli SS, Oliveri MC, et al. Effects of an oral ghrelin mimetic on body composition and clinical outcomes in healthy older adults: a randomized trial. Ann Intern Med. 2008;149(9):601‐611. - PMC - PubMed
    1. Nass R, Farhy LS, Liu J, et al. Age-dependent decline in acyl-ghrelin concentrations and reduced association of acyl-ghrelin and growth hormone in healthy older adults. J Clin Endocrinol Metab. 2014;99(2):602‐608. - PMC - PubMed