Review
. 2023 Jun;34(2):107-122.
doi: 10.1007/s00335-023-09997-w. Epub 2023 Jun 16.

A review of standardized high-throughput cardiovascular phenotyping with a link to metabolism in mice

Affiliations
Review

A review of standardized high-throughput cardiovascular phenotyping with a link to metabolism in mice

Jiri Lindovsky et al. Mamm Genome. 2023 Jun.

Abstract

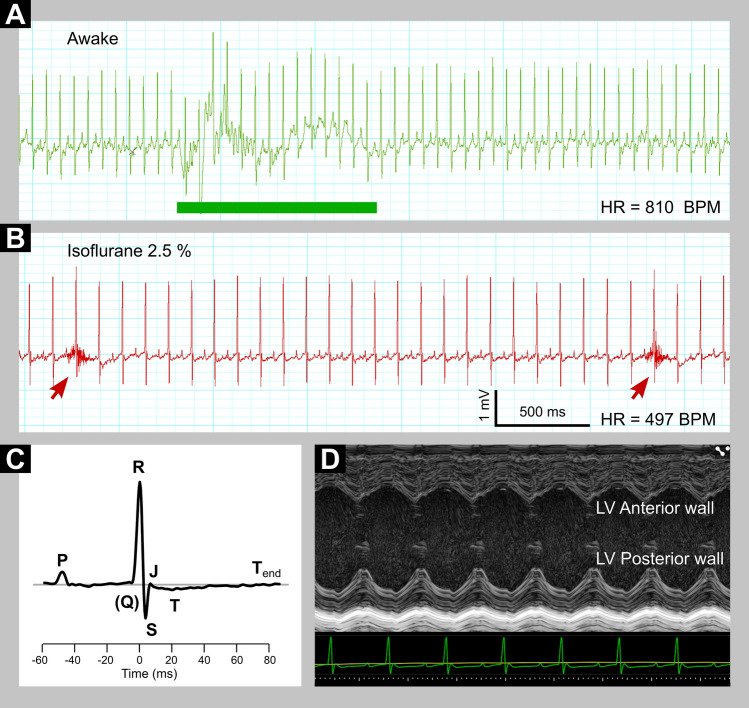
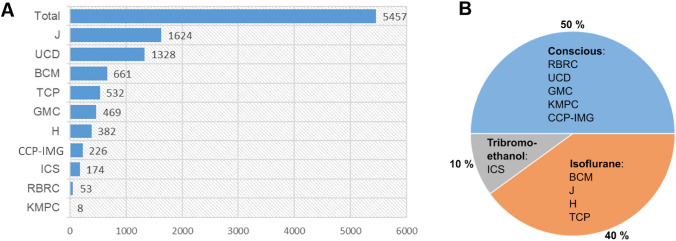
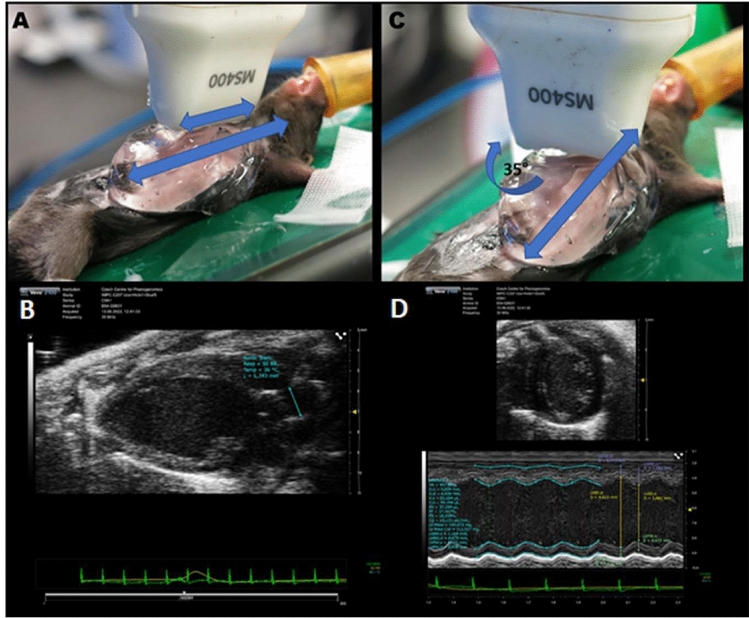
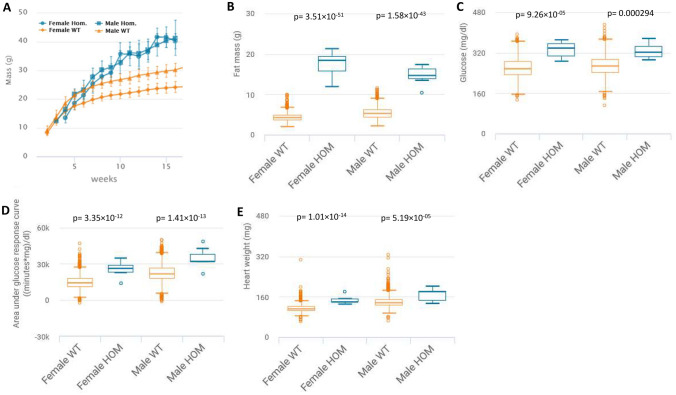
Cardiovascular diseases cause a high mortality rate worldwide and represent a major burden for health care systems. Experimental rodent models play a central role in cardiovascular disease research by effectively simulating human cardiovascular diseases. Using mice, the International Mouse Phenotyping Consortium (IMPC) aims to target each protein-coding gene and phenotype multiple organ systems in single-gene knockout models by a global network of mouse clinics. In this review, we summarize the current advances of the IMPC in cardiac research and describe in detail the diagnostic requirements of high-throughput electrocardiography and transthoracic echocardiography capable of detecting cardiac arrhythmias and cardiomyopathies in mice. Beyond that, we are linking metabolism to the heart and describing phenotypes that emerge in a set of known genes, when knocked out in mice, such as the leptin receptor (Lepr), leptin (Lep), and Bardet-Biedl syndrome 5 (Bbs5). Furthermore, we are presenting not yet associated loss-of-function genes affecting both, metabolism and the cardiovascular system, such as the RING finger protein 10 (Rfn10), F-box protein 38 (Fbxo38), and Dipeptidyl peptidase 8 (Dpp8). These extensive high-throughput data from IMPC mice provide a promising opportunity to explore genetics causing metabolic heart disease with an important translational approach.


Conflict of interest statement

The authors declare no competing interests.

Figures

Fig. 1
Fig. 1
Overview of different mouse ECGs. A Recording of conscious ECG. Green rectangle denotes a portion of signal with artifacts caused by animal movements. B ECG in Lead II configuration under isoflurane anesthesia is at the same scale as in A. Arrows indicate breath artifacts. C P-QRS-T complex of an anesthetized mouse, an average of 20 subsequent beats aligned at R peak. Note missing Q wave and negatively oriented wave T. D ECG monitoring at time of anesthetized sonography of the heart (e.g. echocardiography). Left ventricle (LV) was imaged in short axis M-mode to visualize the relation of anterior and posterior wall movement to ECG waves. Note: For a discussion of anesthetized versus non-anesthetized ECG please refer to the respective section on the main text
Fig. 2
Fig. 2
Overview of DR17 collection. A Total of 5457 knockout lines with ECG data classified by IMPC centers worldwide; data is presented in numbers of knockout mouse lines. Abbreviations for centers: Jackson Laboratory, USA (J); University of California, USA (UCD), Baylor College of Medicine, USA (BMC); Centre for Phenogenomics, Canada (TCP), German Mouse Clinic, Germany (GMC); Medical Research Council, Mary Lyon Center, Harwell, United Kingdom (H), Czech Centre for Phenogenomics, Institut of Molecular Genetics, Czech Republic (CCP-IMG), Institut Clinique de la Souris, France (ICS), RIKEN BioResource Research Center, Japan (RBRC) and Korean Mouse Phenotyping Center, Korea (KMPC)). B ECG data split by optional administration of anesthesia (%): conscious, isoflurane or tribromoethanol anesthesia
Fig. 3
Fig. 3
A ECGenie platform for recording a conscious ECG with the mouse in the red-squared center sitting on paw (touch sensitive) electrodes. B Visual Sonic recording platform for ECG recording under anesthesia; mouse is fixed with tape on a preheated plate, rectal probe and nose in cone; two positions are possible like belly-down or belly-up; here we show the latter possibility that allows simultaneous transthoracic imaging of the heart by ultrasonography
Fig. 4
Fig. 4
Overview of transthoracic echocardiography data in the IMPC split by centers and presented as numbers of KO-mouse lines
Fig. 5
Fig. 5
Transthoracic echocardiography in mice. The mouse is placed on the pre-heated platform, the paws of the mouse are fixed with tape, the chest of the mouse is shaved and ultrasound gel is applied. ECG and body temperature are monitored. A Position of the transducer (short blue arrow) during parasternal long axis recording, when the probe is oriented in the longitudinal direction of the long body axis (long blue arrow). Image of ultrasound record with ECG signal (in the bottom). B The PLAX is used for aorta diameter analysis (blue line). Position of the probe during parasternal short axis recording. C The probe is turned approximately 35° clockwise to a longitudinally oriented probe. D By rotating the transducer approximately 90° clockwise, parasternal short axis is obtained with an ultrasound image and AutoLV analysis. The papillary muscles are in one line (at the level of yellow arrows)
Fig. 6
Fig. 6
Overview of data collection in late adult (LA) mice. A Overview of KO-mouse lines phenotyped in LA classified by centers for TTE. B KO-mouse lines per center with ECG data in LA mice
Fig. 7
Fig. 7
Representative metabolic and cardiovascular phenotypes in the Bbs5-KO mouse. A Bbs5-KO mice show massively increased body weight (g) over time evident in male and female KO-mice when compared to controls. The charts show the results of measuring body weight curve in 7 Bbs5-KO female, 7 male Bbs5-KO mutants compared to 3520 female, 3515 male controls. B Bbs5-KO mice have enormously increased total body fat amount (g) from a body composition (DEXA lean/fat) assay compared to controls with a genotype*female p-value = 3.51 × 10−51 and genotype*male p-value = 1.58 × 10−43. The chart shows the results of measuring fat mass in 7 Bbs5-KO female, 7 male Bbs5-KO mutants compared to 1881 female, 1864 male controls. Statistics: Linear Mixed Model framework, LME, including weight with a phenotype threshold value of 1e-04 for both sexes equally. C Bbs5-KO mice have significantly increased glucose (mg/dl) from a clinical chemistry phenotypic assay compared to controls with a genotype*female p-value = 9.26 × 10−05 and genotype*male p-value = 0.000294. The chart shows the results of measuring fat mass in 7 Bbs5-KO female, 7 male Bbs5-KO mutants compared to 2209 female, 2194 male controls. Statistics: Linear Mixed Model framework, LME, including weight with a phenotype threshold value of 1e-04 for both sexes equally. D Bbs5-KO mice have significantly increased area under glucose response curve (minutes*mg/dl) from intraperitoneal glucose tolerance test (IPGTT) phenotypic assay compared to controls with a genotype*female p-value = 3.35 × 10−12 and genotype*male p-value = 1.41 × 10−13. The chart shows the results of measuring lean/body weight in 7 Bbs5-KO female, 7 male Bbs5-KO mutants compared to 2678 female, 2673 male controls. Statistics: Linear Mixed Model framework, LME, including weight with a phenotype threshold value of 1e-04 for both sexes equally. E Bbs5-KO mice have significantly increased heart weight from an organ weight phenotypic assay compared to controls with a genotype*female p-value = 1.01 × 10−14 and genotype*male p-value = 5.19 × 10−5. The chart shows the results of measuring of measuring heart weight in 6 Bbs5-KO female, 7 male Bbs5-KO mutants compared to 2253 female, 2219 male controls. Statistics: Linear Mixed Model framework, LME, including weight with a phenotype threshold value of 1e-04 for both sexes equally. High-level detail for this KO-mouse line can be accessed here: https://www.mousephenotype.org/data/genes/MGI:1919819
Fig. 8
Fig. 8
Representative metabolic and cardiovascular phenotypes in the Dpp8-KO mouse. A Dpp8-KO mice show increased body weight over time evident in male and female KO-mice when compared to controls. The charts show the results of measuring body weight curve in 8 Dpp8-KO female, 7 male Dpp8-KO mutants compared to 3677 female, 3685 male controls. B Dpp8-KO mice have significantly increased total body fat amount from a body composition (DEXA lean/fat) assay compared to controls with a genotype*female p-value = 8.47 × 10−05 and genotype*male p-value = 7.08 × 10−05. The chart shows the results of measuring fat mass in 8 Dpp8-KO female, 7 male Dpp8-KO mutants compared to 2626 female, 2568 male controls. Statistics: Linear Mixed Model framework, LME, including weight with a phenotype threshold value of 1e-04 for both sexes equally. C Dpp8-KO mice have significantly decreased lean/body weight from a body composition (DEXA lean/fat) assay compared to controls with a genotype*female p-value = 9.08 × 10−13 and genotype*male p-value = 0.0422. The chart shows the results of measuring lean/body weight in 8 Dpp8-KO female, 7 male Dpp8-KO mutants compared to 2615 female, 2559 male controls. Statistics: Linear Mixed Model framework, LME, including weight with a phenotype threshold value of 1e-04 for both sexes equally. D Dpp8-KO mice have significantly decreased heart rate from an electrocardiogram recording compared to controls with a genotype*male p-value = 3.59 × 10−06. The chart shows the results of measuring of measuring heart rate in 7 male Dpp8-KO mutants compared to 736 male controls (females not shown). Statistics: Linear Mixed Model framework, LME, including weight with a phenotype threshold value of 1e-04. E Dpp8-KO mice show significantly prolonged RR intervals from an electrocardiogram recording compared to controls with a genotype*male p-value = 5.17 × 10−08. The chart shows the results of measuring of measuring RR intervals in 7 male Dpp8-KO mutants compared to 736 male controls (females not shown). Statistics: Linear Mixed Model framework, LME, including weight with a phenotype threshold value of 1e-04. High-level detail for this KO-mouse line can be accessed here: https://www.mousephenotype.org/data/genes/MGI:1921638

References

    1. Basson CT, Bachinsky DR, Lin RC, Levi T, Elkins JA, Soults J, Grayzel D, Kroumpouzou E, Traill TA, Leblanc-Straceski J, Renault B, Kucherlapati R, Seidman JG, Seidman CE. Mutations in human TBX5 [corrected] cause limb and cardiac malformation in Holt-Oram syndrome. Nat Genet. 1997;15:30–35. doi: 10.1038/ng0197-30. - DOI - PubMed
    1. Boukens BJ, Rivaud MR, Rentschler S, Coronel R. Misinterpretation of the mouse ECG: 'musing the waves of Mus musculus'. J Physiol. 2014;592:4613–4626. doi: 10.1113/jphysiol.2014.279380. - DOI - PMC - PubMed
    1. Bowl MR, Brown SDM. Genetic landscape of auditory dysfunction. Hum Mol Genet. 2018;27:R130–R135. doi: 10.1093/hmg/ddy158. - DOI - PubMed
    1. Brown SD, Moore MW. The International Mouse Phenotyping Consortium: past and future perspectives on mouse phenotyping. Mamm Genome. 2012;23:632–640. doi: 10.1007/s00335-012-9427-x. - DOI - PMC - PubMed
    1. Bryda EC. The mighty mouse: the impact of rodents on advances in biomedical research. Mo Med. 2013;110:207–211. - PMC - PubMed

Publication types

LinkOut - more resources