

Genotoxicity of cytokines at chemotherapy-induced 'storm' concentrations in a model of the human bone marrow
- PMID: 37326959
- PMCID: PMC10448863
- DOI: 10.1093/mutage/gead018
Genotoxicity of cytokines at chemotherapy-induced 'storm' concentrations in a model of the human bone marrow
Abstract
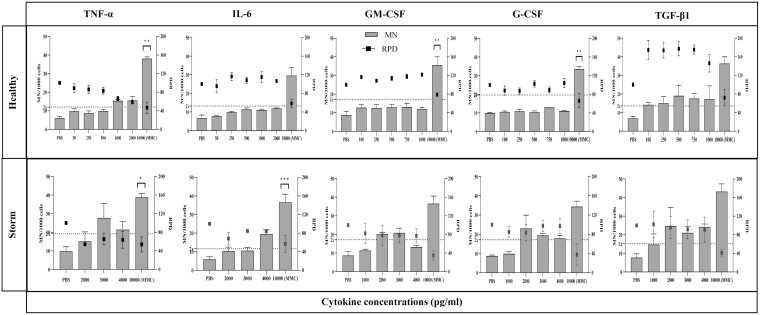
Donor cell leukaemia (DCL) is a complication of haematopoietic stem cell transplantation where donated cells become malignant within the patient's bone marrow. As DCL predominates as acute myeloid leukaemia, we hypothesized that the cytokine storm following chemotherapy played a role in promoting and supporting leukaemogenesis. Cytokines have also been implicated in genotoxicity; thus, we explored a cell line model of the human bone marrow (BM) to secrete myeloid cytokines following drug treatment and their potential to induce micronuclei. HS-5 human stromal cells were exposed to mitoxantrone (MTX) and chlorambucil (CHL) and, for the first time, were profiled for 80 cytokines using an array. Fifty-four cytokines were detected in untreated cells, of which 24 were upregulated and 10 were downregulated by both drugs. FGF-7 was the lowest cytokine to be detected in both untreated and treated cells. Eleven cytokines not detected at baseline were detected following drug exposure. TNFα, IL6, GM-CSF, G-CSF, and TGFβ1 were selected for micronuclei induction. TK6 cells were exposed to these cytokines in isolation and in paired combinations. Only TNFα and TGFβ1 induced micronuclei at healthy concentrations, but all five cytokines induced micronuclei at storm levels, which was further increased when combined in pairs. Of particular concern was that some combinations induced micronuclei at levels above the mitomycin C positive control; however, most combinations were less than the sum of micronuclei induced following exposure to each cytokine in isolation. These data infer a possible role for cytokines through chemotherapy-induced cytokine storm, in the instigation and support of leukaemogenesis in the BM, and implicate the need to evaluate individuals for variability in cytokine secretion as a potential risk factor for complications such as DCL.
Keywords: chemotherapy; concentrations; cytokines; genotoxicity; induced; storm.
© The Author(s) 2023. Published by Oxford University Press on behalf of the UK Environmental Mutagen Society.
Figures


Similar articles
-
IL-6 knockdown in a model of the human bone marrow, abrogates DNA damage induction in bystander cells post-chemotherapy induced cytokine release syndrome.Transl Oncol. 2024 Aug;46:102030. doi: 10.1016/j.tranon.2024.102030. Epub 2024 Jun 12. Transl Oncol. 2024. PMID: 38870677 Free PMC article.
-
G-CSF treatment of healthy pediatric donors affects their hematopoietic microenvironment through changes in bone marrow plasma cytokines and stromal cells.Cytokine. 2021 Mar;139:155407. doi: 10.1016/j.cyto.2020.155407. Epub 2020 Dec 28. Cytokine. 2021. PMID: 33383380
-
Growth factors and cytokines upregulate gelatinase expression in bone marrow CD34(+) cells and their transmigration through reconstituted basement membrane.Blood. 1999 May 15;93(10):3379-90. Blood. 1999. PMID: 10233890
-
The pro-Inflammatory cytokines effects on mobilization, self-renewal and differentiation of hematopoietic stem cells.Hum Immunol. 2020 May;81(5):206-217. doi: 10.1016/j.humimm.2020.01.004. Epub 2020 Mar 2. Hum Immunol. 2020. PMID: 32139091 Review.
-
Rhythms in human bone marrow and blood cells.Chronobiol Int. 2002 Jan;19(1):101-27. doi: 10.1081/cbi-120002594. Chronobiol Int. 2002. PMID: 11962670 Review.
Cited by
-
IL-6 knockdown in a model of the human bone marrow, abrogates DNA damage induction in bystander cells post-chemotherapy induced cytokine release syndrome.Transl Oncol. 2024 Aug;46:102030. doi: 10.1016/j.tranon.2024.102030. Epub 2024 Jun 12. Transl Oncol. 2024. PMID: 38870677 Free PMC article.
References
-
- Cancer Research UK (CRUK). Leukaemia (all subtypes combined statistics). 2022. https://www.cancerresearchuk.org/health-professional/cancer-statistics/s... (25 July 2022, date last accessed).
-
- Rieger K, Marinets O, Fietx T, et al. . Mesenchymal stem cells remain of host origin even a long time after allogeneic peripheral blood stem cell or bone marrow transplantation. Exp Hematol 2005;33:605–11. - PubMed
-
- Laver J, Jhanwar SC, O’Reilly RJ, et al. . Host origin of the human hematopoietic microenvironment following allogeneic bone marrow transplantation. Blood 1987;70:1966–8. - PubMed
-
- Kemp K, Morse R, Sanders K, et al. . Alkylating chemotherapeutic agents cyclophosphamide and melphalan cause functional injury to human bone marrow-derived mesenchymal stem cells. Ann Haematol 2011;90:777–89. - PubMed
MeSH terms
Substances
LinkOut - more resources
Full Text Sources
Research Materials
