. 2023 Aug 22;7(16):4492-4504.
doi: 10.1182/bloodadvances.2023009827.

Allelic variation of KIR and HLA tunes the cytolytic payload and determines functional hierarchy of NK cell repertoires

Affiliations

Allelic variation of KIR and HLA tunes the cytolytic payload and determines functional hierarchy of NK cell repertoires

Camille Philippon et al. Blood Adv. .

Abstract

The functionality of natural killer (NK) cells is tuned during education and is associated with remodeling of the lysosomal compartment. We hypothesized that genetic variation in killer cell immunoglobulin-like receptor (KIR) and HLA, which is known to influence the functional strength of NK cells, fine-tunes the payload of effector molecules stored in secretory lysosomes. To address this possibility, we performed a high-resolution analysis of KIR and HLA class I genes in 365 blood donors and linked genotypes to granzyme B loading and functional phenotypes. We found that granzyme B levels varied across individuals but were stable over time in each individual and genetically determined by allelic variation in HLA class I genes. A broad mapping of surface receptors and lysosomal effector molecules revealed that DNAM-1 and granzyme B levels served as robust metric of the functional state in NK cells. Variation in granzyme B levels at rest was tightly linked to the lytic hit and downstream killing of major histocompatibility complex-deficient target cells. Together, these data provide insights into how variation in genetically hardwired receptor pairs tunes the releasable granzyme B pool in NK cells, resulting in predictable hierarchies in global NK cell function.


Conflict of interest statement

Conflict-of-interest disclosure: K.-J.M. is a consultant with ownership interests at Fate Therapeutics and Vycellix; reports research funding from Fate Therapeutics, Oncopeptides, and Merck; has a royalty agreement with Fate Therapeutics through the licensing of intellectual property; and has received honoraria from Oncopeptides and Cytovia. B.Ö. is a consultant and has ownership interest at Vycellix, and receives research support from Affimed. The remaining authors declare no competing financial interests.

Figures

None
Graphical abstract
Figure 1.
Figure 1.
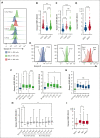
HLA class I alleles affect the granzyme B loading in NK cells. (A) Granzyme B expression in KIR2DL1+ (blue), KIR2DL3+ (green), or KIR3DL1+ (orange) NK cells from donors with different HLA-C backgrounds (one representative experiment shown). (B) Granzyme B expression in KIR2DL3+ NK cells compared with the receptor-negative (Nil) NK cells from the same donor. C1/C1 donors (n = 143), C1/C2 donors (n = 147), and C2/C2 donors (n = 43). (C) Granzyme B expression in KIR2DL1+ NK cells compared with the Nil NK cells from the same C1/C1 donors (n = 140), C1/C2 donors (n = 128), and C2/C2 donors (n = 43). (D) Granzyme B expression in KIR3DL1+ NK cells compared with the Nil NK cells from the same Bw4- donors (n = 78) and Bw4+ donors (n = 170). (E) Granzyme B expression in KIR2DL1+ (blue), KIR2DL3+ (green), or KIR3DL1+ (orange) NK cells from donors with specific HLA alleles, HLA-C∗04 or HLA-C∗02; HLA-C∗03 or HLA-C∗07; Bw4-80T or Bw4-I80, respectively. (F) Granzyme B expression in KIR2DL3+ NK cells compared with the Nil NK cells from the same donor stratified by HLA-C1 alleles. C1/C1 donors (n = 140) and C2/C2 donors (n = 43). (G) Granzyme B expression in KIR2DL1+ NK cells compared with the Nil NK cells from the same donor stratified by HLA-C2 alleles. C1/C1 donors (n = 140) and C2/C2 donors (n = 43). (H) Granzyme B expression in KIR2DL3+ NK cells compared with the KIR2DL1+ NK cells from the same donor stratified by HLA-C1 and C2 alleles. C1/C2 donors (n = 125). (I) Granzyme B expression in KIR3DL1+ NK cells compared with the Nil NK cells from the same donor stratified by Bw4 alleles. Bw4 donors (n = 179). (B-D) Self-KIR NK cells are represented in red, and the nonself KIR NK cells are represented in blue. Each dot represents 1 donor. Whiskers show the fifth to 95th percentile. Bars show the median. One-way ANOVA tests followed by Kruskal-Wallis’ multiple comparison tests were performed in panels B, C and F-I. Mann-Whitney U test was performed in panel D. ∗∗∗∗P < .0001; ∗∗∗P < .001; ∗∗P < .01; and ∗P < .05. ANOVA, analysis of variance; MFI, median fluorescence intensity.
Figure 2.
Figure 2.
Granzyme B loading is genetically hardwired and stable over time. (A) Dot plot representing the delta of granzyme B loading in either repeated samplings (sampling 1 vs sampling 2) or random pairing, calculated as the difference in granzyme B content between 2 randomly selected donors (donor pair) with the indicated genotype. (B) Granzyme B content of educated NK cells/Nil NK cells is shown for each donor and stratified based on the HLA-C background, either C1/C1, C1/C2 or Bw4. Each dot represents 1 donor, and bars show the median. Identification of donors with very high granzyme B content in their NK cells based on the interquartile range rule (outliers in red, blue or green). (C) Allelic distribution in KIR2DL3 granzyme Bhigh donors (n = 9) compared with other C1C1 donors (n = 148). (D) Allelic distribution KIR2DL3+ and KIR2DL1+ granzyme Bhigh donors (n = 12 and n = 4, respectively) among C1/C2 donors, compared with other C1/C2 donors (n = 110). (E) Allelic distribution in KIR3DL1+ granzyme Bhigh donors (n = 11) among Bw4+ donors compared with other Bw4+ donors (n = 159). One-way ANOVA tests followed by Kruskal-Wallis multiple comparison tests were performed. (D-F) The pie charts represent the frequencies of donors with specific HLA-C or Bw4 alleles in the outlier population and in the general population. The outliers are identified with the interquartile range formula. Χ tests were performed. ∗∗∗∗P < .0001; ∗∗∗P < .001; ∗∗P <.01; and ∗P < .05.
Figure 3.
Figure 3.
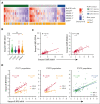
Differences in granzyme B loading at the bulk level can be explained by the differences observed in the educated population of NK cells. (A) Heatmap representing the granzyme B expression (MFI) using z-score normalization. C1/C1 donors (n = 37), C1/C2 donors (n = 42), and C2/C2 donors (n = 12). (B) Granzyme B expression in the bulk NK population were compared with receptor-negative (Nil) NK cells from the same donor and stratified by the HLA class I background of the donors. (C) Correlation analyses between granzyme B expression in the bulk NK population with the granzyme B loading in the CD57+ subset and NKG2A+ subset of NK cells. (D) Correlation analysis between granzyme B expression in the bulk NK population and granzyme B levels in the educated NK cells. Each dot represents 1 donor. R is the Pearson coefficient. One-way ANOVA tests followed by Kruskal-Wallis multiple comparison tests were performed in panel B. ∗∗∗∗P < .0001; ∗∗∗P < .001; ∗∗ P < .01; and ∗P < .05.
Figure 4.
Figure 4.
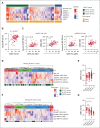
A refined phenotypic metric based on DNAM-1 and granzyme B levels. (A) Heatmap representing the DNAM-1 expression (MFI), using z-score normalization. C1/C1 donors (n = 37), C1/C2 donors (n = 42), and C2/C2 donors (n = 12). (B) Correlation between the percentage of educated NK cells and degranulation rates. (C) Correlation between DNAM-1 expression and granzyme B content in KIR2DL3+ or KIR2DL1+ NK cells with the degranulation rate of the same subset of NK cells. Negative correlation between KIR expression intensity and degranulation rate. (D) Unsupervised K-means clustering of the donors in the missing HLA-C1 context, based on DNAM-1 expression, granzyme B content and the size of the different educated subsets (n = 80). (E) Summary graph of the degranulation response (CD107a) in clusters from 1 to 4. (F) Unsupervised K-means clustering of the donors in the missing HLA-C2 context, based on DNAM-1 expression, granzyme B content, and the size of the different educated subsets (n = 54). (G) Summary graph of the degranulation response (CD107a) in clusters from 1 to 4. Each dot represents 1 donor. R is the Pearson coefficient. One-way ANOVA tests followed by Tukey multiple comparison tests were performed in panels D and E. ∗∗∗∗P < .0001; ∗∗∗P < .001; ∗∗P < .01; and ∗P < .05.
Figure 5.
Figure 5.
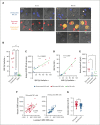
Educated NK cells contain more granzyme B than uneducated. (A) Imaging of CTV-labeled sorted educated or uneducated NK cells (red and blue respectively) coincubated with K562 for 0 or 60 min and stained for GranToxiLux plus (orange). (B) Bar graph representing percentage of K562 positive for GranToxiLux after 1 hour challenge with either educated or uneducated NK cells (E:T) ratio of (2:1), or no NK cells. (C) Correlation between granzyme B content of NK cells measured preassay correlates with the percentage of K562 positive for GranToxiLux. (D) Correlation of GranToxiLux positive K562 cells and DCM+ cells. (E) Soluble granzyme B measured in the supernatant after stimulation of NK cells by CD16 crosslinking compared with unstimulated NK cells as baseline. (F) Correlation between granzyme B content of NK cells measured preassay with the amount of granzyme B lost by NK cells during the degranulation assay using K562 (n = 49). (G) Number of granules mobilized per kill in educated and uneducated NK cells (n = 49). (B-G) Self- KIR NK cells are represented in red and the nonself KIR NK cells in blue. Whiskers show the fifth to 95th percentiles. Bars show the median. One-way ANOVA tests followed by Tukey multiple comparison tests were performed in panels B and E. R is the Pearson coefficient in panels C, D, and F. Unpaired t test was performed in panel G. ∗∗∗∗P < .0001; ∗∗∗P < .001; ∗∗P < .01; and ∗P < .05. CTV, CellTrace Violet; DCM, dead cell marker.

References

    1. Lanier LL. NK cell recognition. Annu Rev Immunol. 2005;23:225–274. - PubMed
    1. Parham P, Norman PJ, Abi-Rached L, Guethlein LA. Human-specific evolution of killer cell immunoglobulin-like receptor recognition of major histocompatibility complex class I molecules. Philos Trans R Soc Lond B Biol Sci. 2012;367(1590):800–811. - PMC - PubMed
    1. Maccari G, Robinson J, Hammond JA, Marsh SGE. The IPD project: a centralised resource for the study of polymorphism in genes of the immune system. Immunogenetics. 2020;72(1-2):49–55. - PMC - PubMed
    1. Hilton HG, Guethlein LA, Goyos A, et al. Polymorphic HLA-C receptors balance the functional characteristics of KIR haplotypes. J Immunol. 2015;195(7):3160–3170. - PMC - PubMed
    1. Brodin P, Lakshmikanth T, Johansson S, Karre K, Hoglund P. The strength of inhibitory input during education quantitatively tunes the functional responsiveness of individual natural killer cells. Blood. 2009;113(11):2434–2441. - PubMed

Publication types