. 2023 Aug 15;29(16):3214-3224.
doi: 10.1158/1078-0432.CCR-22-1871.

Gold Nanostars Obviate Limitations to Laser Interstitial Thermal Therapy (LITT) for the Treatment of Intracranial Tumors

Affiliations

Gold Nanostars Obviate Limitations to Laser Interstitial Thermal Therapy (LITT) for the Treatment of Intracranial Tumors

Ethan S Srinivasan et al. Clin Cancer Res. .

Abstract

Purpose: Laser interstitial thermal therapy (LITT) is an effective minimally invasive treatment option for intracranial tumors. Our group produced plasmonics-active gold nanostars (GNS) designed to preferentially accumulate within intracranial tumors and amplify the ablative capacity of LITT.

Experimental design: The impact of GNS on LITT coverage capacity was tested in ex vivo models using clinical LITT equipment and agarose gel-based phantoms of control and GNS-infused central "tumors." In vivo accumulation of GNS and amplification of ablation were tested in murine intracranial and extracranial tumor models followed by intravenous GNS injection, PET/CT, two-photon photoluminescence, inductively coupled plasma mass spectrometry (ICP-MS), histopathology, and laser ablation.

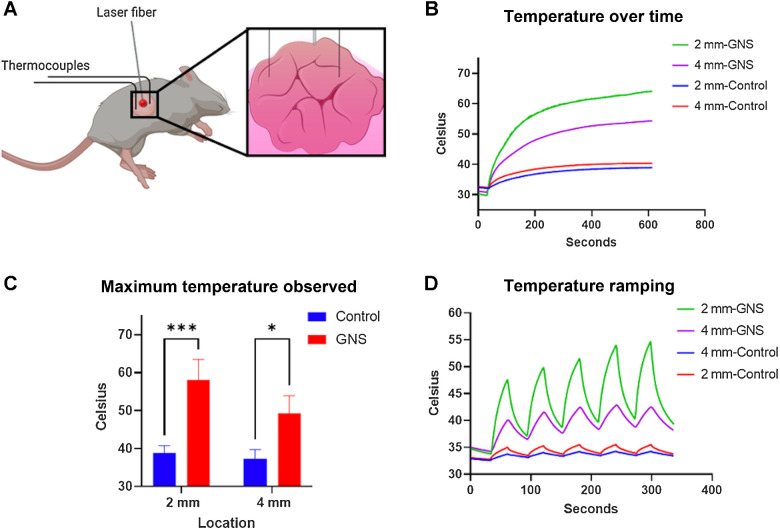
Results: Monte Carlo simulations demonstrated the potential of GNS to accelerate and specify thermal distributions. In ex vivo cuboid tumor phantoms, the GNS-infused phantom heated 5.5× faster than the control. In a split-cylinder tumor phantom, the GNS-infused border heated 2× faster and the surrounding area was exposed to 30% lower temperatures, with margin conformation observed in a model of irregular GNS distribution. In vivo, GNS preferentially accumulated within intracranial tumors on PET/CT, two-photon photoluminescence, and ICP-MS at 24 and 72 hours and significantly expedited and increased the maximal temperature achieved in laser ablation compared with control.

Conclusions: Our results provide evidence for use of GNS to improve the efficiency and potentially safety of LITT. The in vivo data support selective accumulation within intracranial tumors and amplification of laser ablation, and the GNS-infused phantom experiments demonstrate increased rates of heating, heat contouring to tumor borders, and decreased heating of surrounding regions representing normal structures.


Figures

Figure 1. Representative clinical LITT images, GNS characterization, and Monte Carlo simulations. A, Cross-sectional MRI of patient with a metastatic brain tumor undergoing LITT with TDT lines depicted. The yellow line indicates tissue heated the equivalent of 43°C for at least 2 minutes (no permanent damage), the blue line 43°C for 10 minutes (irreversibly damaged), and the teal line 43°C for 60 minutes (coagulative necrosis). B, Intraoperative MRI images from 4 patients with metastatic brain tumors who underwent LITT. The red line indicates the borders of the contrast-enhancing tumor volume. The blue line indicates the blue TDT boundary, identifying tissue heated to the equivalent of 43°C for 10 minutes and considered “irreversibly damaged.” C, TEM image of a single GNS engineered to have absorption near 1,064 nm D, Vis-NIR extinction spectrum of synthesized 0.1 nmol/L GNS nanoparticles (Black, Au_15; Red, Au_25; Blue, Au_35) in water solution. E, Simplified tissue models for photothermal simulations. Control tumor model without GNS (top) and experimental tumor model with a spherical volume of GNS (bottom). F–I, Monte Carlo simulations of photon absorption in gray matter brain tissue models. Absorption map and profile for models without GNS (F and G). The dashed circle in this control group corresponds to the analogous GNS region of the experimental model region. Absorption map and profile for a tumor model with GNS embedded (H and I). (Created with BioRender.com.)
Figure 1.
Representative clinical LITT images, GNS characterization, and Monte Carlo simulations. A, Cross-sectional MRI of patient with a metastatic brain tumor undergoing LITT with TDT lines depicted. The yellow line indicates tissue heated the equivalent of 43°C for at least 2 minutes (no permanent damage), the blue line 43°C for 10 minutes (irreversibly damaged), and the teal line 43°C for 60 minutes (coagulative necrosis). B, Intraoperative MRI images from 4 patients with metastatic brain tumors who underwent LITT. The red line indicates the borders of the contrast-enhancing tumor volume. The blue line indicates the blue TDT boundary, identifying tissue heated to the equivalent of 43°C for 10 minutes and considered “irreversibly damaged.” C, TEM image of a single GNS engineered to have absorption near 1,064 nm D, Vis-NIR extinction spectrum of synthesized 0.1 nmol/L GNS nanoparticles (Black, Au_15; Red, Au_25; Blue, Au_35) in water solution. E, Simplified tissue models for photothermal simulations. Control tumor model without GNS (top) and experimental tumor model with a spherical volume of GNS (bottom). FI, Monte Carlo simulations of photon absorption in gray matter brain tissue models. Absorption map and profile for models without GNS (F and G). The dashed circle in this control group corresponds to the analogous GNS region of the experimental model region. Absorption map and profile for a tumor model with GNS embedded (H and I). (Created with BioRender.com.)
Figure 2. Phantom tumor models and LITT administration. A, Diagram of phantom tumor models. The external cube consists of a 12×12×10-cm solid agarose gel and the internal cylinder a 2.5-cm radius solid agarose gel either with embedded GNS (left) or without (right). Temperature was measured within the tumor phantom at the indicated locations 2 cm from the laser source (Ctrl2 cm and GNS2 cm). B, Representative images from temperature monitoring of GNS-infused (left) and control (right) tumor phantoms during administration of LITT. The yellow TDT line shown represents tissue exposed to the thermal equivalent of 43°C for at least 2 minutes. C, Graph of temperatures measured 2 cm from the laser probe tip in the GNS-infused model (GNS phantom) and control (Control phantom) during the administration of LITT. Equations for simple linear regressions shown. D, Representative images from temperature monitoring of cylinder (left)- and hourglass (right)-shaped GNS-infused tumor phantoms during administration of LITT. E, Diagram of split phantom tumor model. The external cube consists of a 12×12×10-cm solid agarose gel. The internal cylinder has a radius of 2 cm with half containing GNS. Temperatures were monitored at the indicated positions, on the tumor phantom boundary 2 cm from the laser source (Ctrl2 cm and GNS2 cm) and 0.5 cm outside the tumor phantom border (2.5 cm total from the laser source, Ctrl2.5 cm and GNS2.5 cm). F, Representative image from temperature monitoring of split tumor phantom during administration of LITT. G, Graph of temperatures measured in the split phantom model infused with GNS as shown in E. Temperature was recorded at the tumor phantom border (GNS2 cm) and 0.5 cm beyond the border (GNS2.5 cm) during the administration of LITT. Equations for simple linear regressions are shown. H, Graph of temperatures measured in the split phantom model without GNS as shown in E. Temperature was recorded at the tumor phantom border (Ctrl2 cm) and 0.5 cm beyond the border (Ctrl2.5 cm) during the administration of LITT. Equations for simple linear regressions are shown. (Created with BioRender.com.)
Figure 2.
Phantom tumor models and LITT administration. A, Diagram of phantom tumor models. The external cube consists of a 12×12×10-cm solid agarose gel and the internal cylinder a 2.5-cm radius solid agarose gel either with embedded GNS (left) or without (right). Temperature was measured within the tumor phantom at the indicated locations 2 cm from the laser source (Ctrl2 cm and GNS2 cm). B, Representative images from temperature monitoring of GNS-infused (left) and control (right) tumor phantoms during administration of LITT. The yellow TDT line shown represents tissue exposed to the thermal equivalent of 43°C for at least 2 minutes. C, Graph of temperatures measured 2 cm from the laser probe tip in the GNS-infused model (GNS phantom) and control (Control phantom) during the administration of LITT. Equations for simple linear regressions shown. D, Representative images from temperature monitoring of cylinder (left)- and hourglass (right)-shaped GNS-infused tumor phantoms during administration of LITT. E, Diagram of split phantom tumor model. The external cube consists of a 12×12×10-cm solid agarose gel. The internal cylinder has a radius of 2 cm with half containing GNS. Temperatures were monitored at the indicated positions, on the tumor phantom boundary 2 cm from the laser source (Ctrl2 cm and GNS2 cm) and 0.5 cm outside the tumor phantom border (2.5 cm total from the laser source, Ctrl2.5 cm and GNS2.5 cm). F, Representative image from temperature monitoring of split tumor phantom during administration of LITT. G, Graph of temperatures measured in the split phantom model infused with GNS as shown in E. Temperature was recorded at the tumor phantom border (GNS2 cm) and 0.5 cm beyond the border (GNS2.5 cm) during the administration of LITT. Equations for simple linear regressions are shown. H, Graph of temperatures measured in the split phantom model without GNS as shown in E. Temperature was recorded at the tumor phantom border (Ctrl2 cm) and 0.5 cm beyond the border (Ctrl2.5 cm) during the administration of LITT. Equations for simple linear regressions are shown. (Created with BioRender.com.)
Figure 3. In vivo GNS accumulation. A, Coronal PET/CT scan of brains from CT2A tumor-bearing (TB-A, TB-B, TB-C, and TB-D) and non–tumor-bearing (NTB) mice 10 minutes, 24 hours, and 72 hours after intravenous injection of 124I-GNS nanoprobes. B, H&E stains of CT2A and B16F0 intracranial tumors. C and D, Two-photon photoluminescence imaging of DAPI-stained tumor and surrounding brain tissue at 10 minutes, 24 hours, and 72 hours after intravenous administration of GNS or control sterile PBS.
Figure 3.
In vivo GNS accumulation. A, Coronal PET/CT scan of brains from CT2A tumor-bearing (TB-A, TB-B, TB-C, and TB-D) and non–tumor-bearing (NTB) mice 10 minutes, 24 hours, and 72 hours after intravenous injection of 124I-GNS nanoprobes. B, H&E stains of CT2A and B16F0 intracranial tumors. C and D, Two-photon photoluminescence imaging of DAPI-stained tumor and surrounding brain tissue at 10 minutes, 24 hours, and 72 hours after intravenous administration of GNS or control sterile PBS.
Figure 4. In vivo GNS amplification of LITT. A, Schematic of the experimental setup for mouse tumor ablation and real-time temperature monitoring. Inset, tumor with optical fiber emitting 1,064-nm light and two thermocouples for temperature monitoring. B, Temperature versus time comparison between animals with and without GNS during constant heating. C, Summary data of maximum temperature reached by all animals with and without GNS during constant heating, N = 3 per group. D, Temperature versus time comparison between animals with and without GNS when the laser was alternated on and off every 30 seconds. (Created with BioRender.com.)
Figure 4.
In vivo GNS amplification of LITT. A, Schematic of the experimental setup for mouse tumor ablation and real-time temperature monitoring. Inset, tumor with optical fiber emitting 1,064-nm light and two thermocouples for temperature monitoring. B, Temperature versus time comparison between animals with and without GNS during constant heating. C, Summary data of maximum temperature reached by all animals with and without GNS during constant heating, N = 3 per group. D, Temperature versus time comparison between animals with and without GNS when the laser was alternated on and off every 30 seconds. (Created with BioRender.com.)

References

    1. Fecci PE, Champion CD, Hoj J, McKernan CM, Goodwin CR, Kirkpatrick JP, et al. . The evolving modern management of brain metastasis. Clin Cancer Res 2019;25:6570–80. - PMC - PubMed
    1. Achrol AS, Rennert RC, Anders C, Soffietti R, Ahluwalia MS, Nayak L, et al. . Brain metastases. Nat Rev Dis Primer 2019;5:1–26. - PubMed
    1. Holste KG, Orringer DA. Laser interstitial thermal therapy. Neurooncol Adv 2019;2:vdz035. - PMC - PubMed
    1. Barnett GH, Voigt JD, Alhuwalia MS. A systematic review and meta-analysis of studies examining the use of brain laser interstitial thermal therapy versus craniotomy for the treatment of high-grade tumors in or near areas of eloquence: an examination of the extent of resection and major complication rates associated with each type of surgery. Ster Funct Neurosurg 2016;94:164–73. - PubMed
    1. Prince E, Hakimian S, Ko AL, Ojemann JG, Kim MS, Miller JW. Laser interstitial thermal therapy for epilepsy. Curr Neurol Neurosci Rep 2017;17:63. - PubMed

Publication types