. 2023 Jun 23;8(84):eade7652.
doi: 10.1126/sciimmunol.ade7652. Epub 2023 Jun 16.

Hexokinase dissociation from mitochondria promotes oligomerization of VDAC that facilitates NLRP3 inflammasome assembly and activation

Affiliations

Hexokinase dissociation from mitochondria promotes oligomerization of VDAC that facilitates NLRP3 inflammasome assembly and activation

Sung Hoon Baik et al. Sci Immunol. .

Abstract

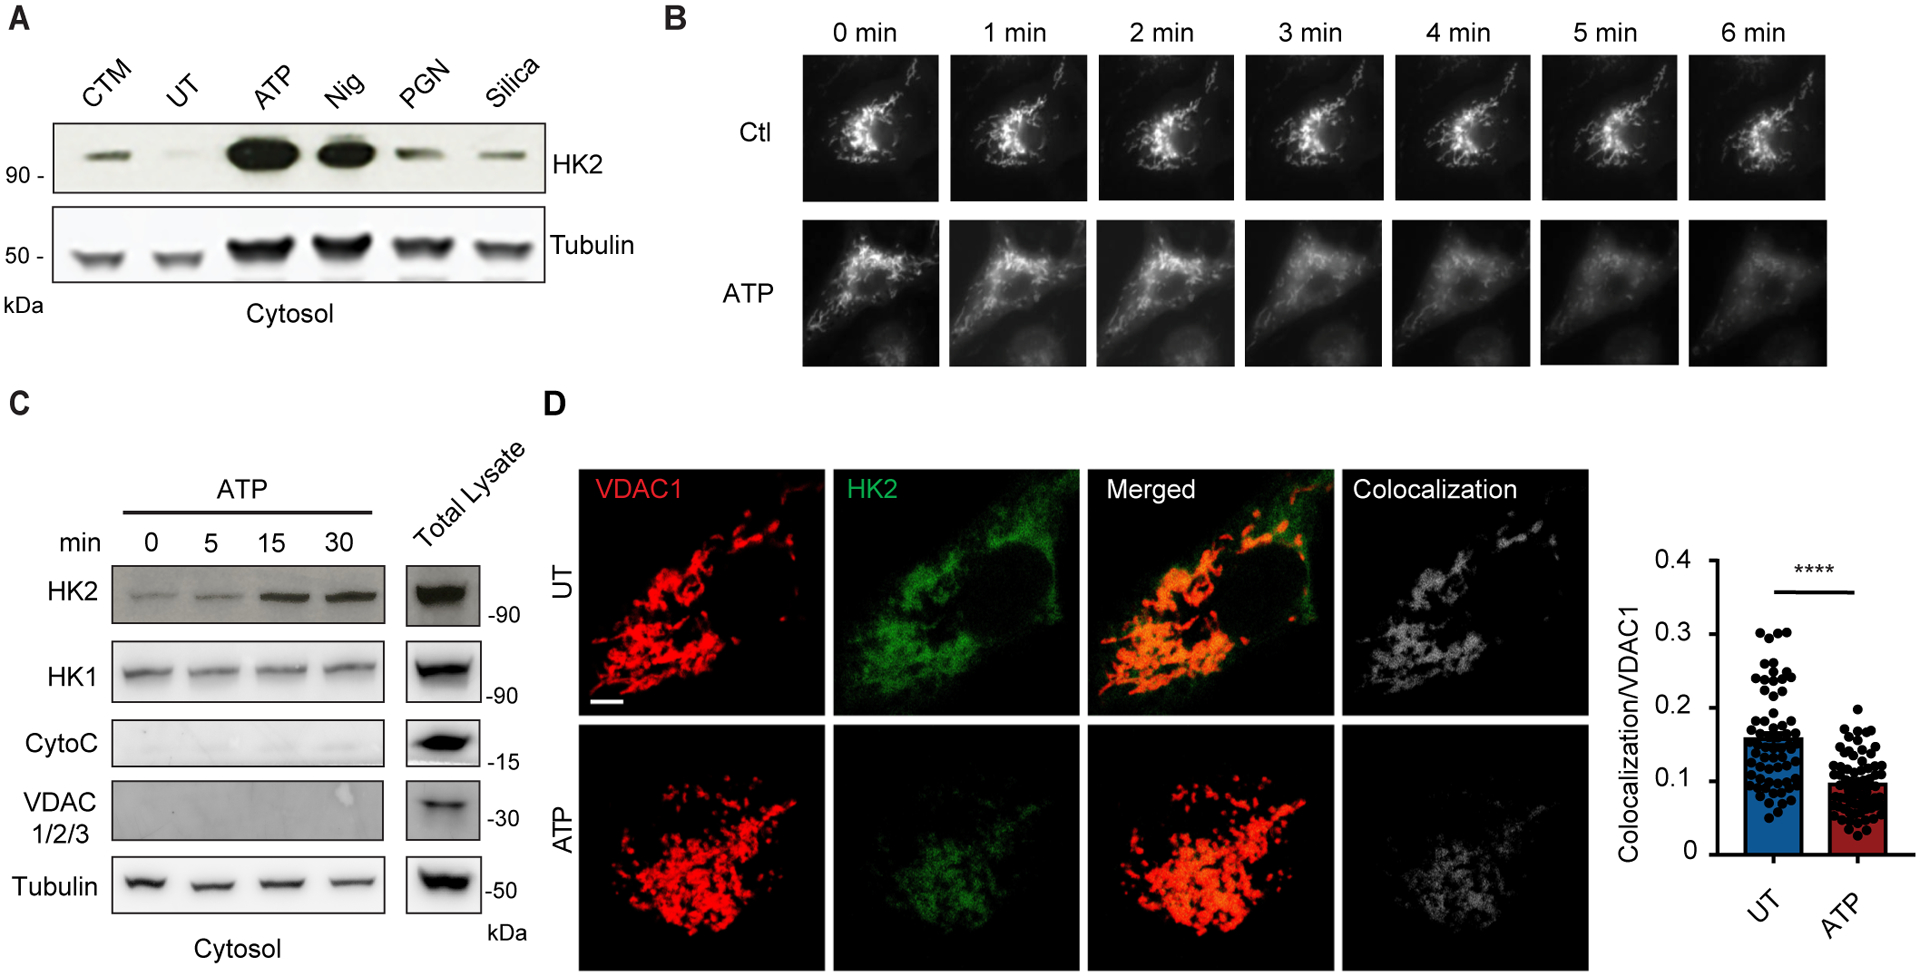
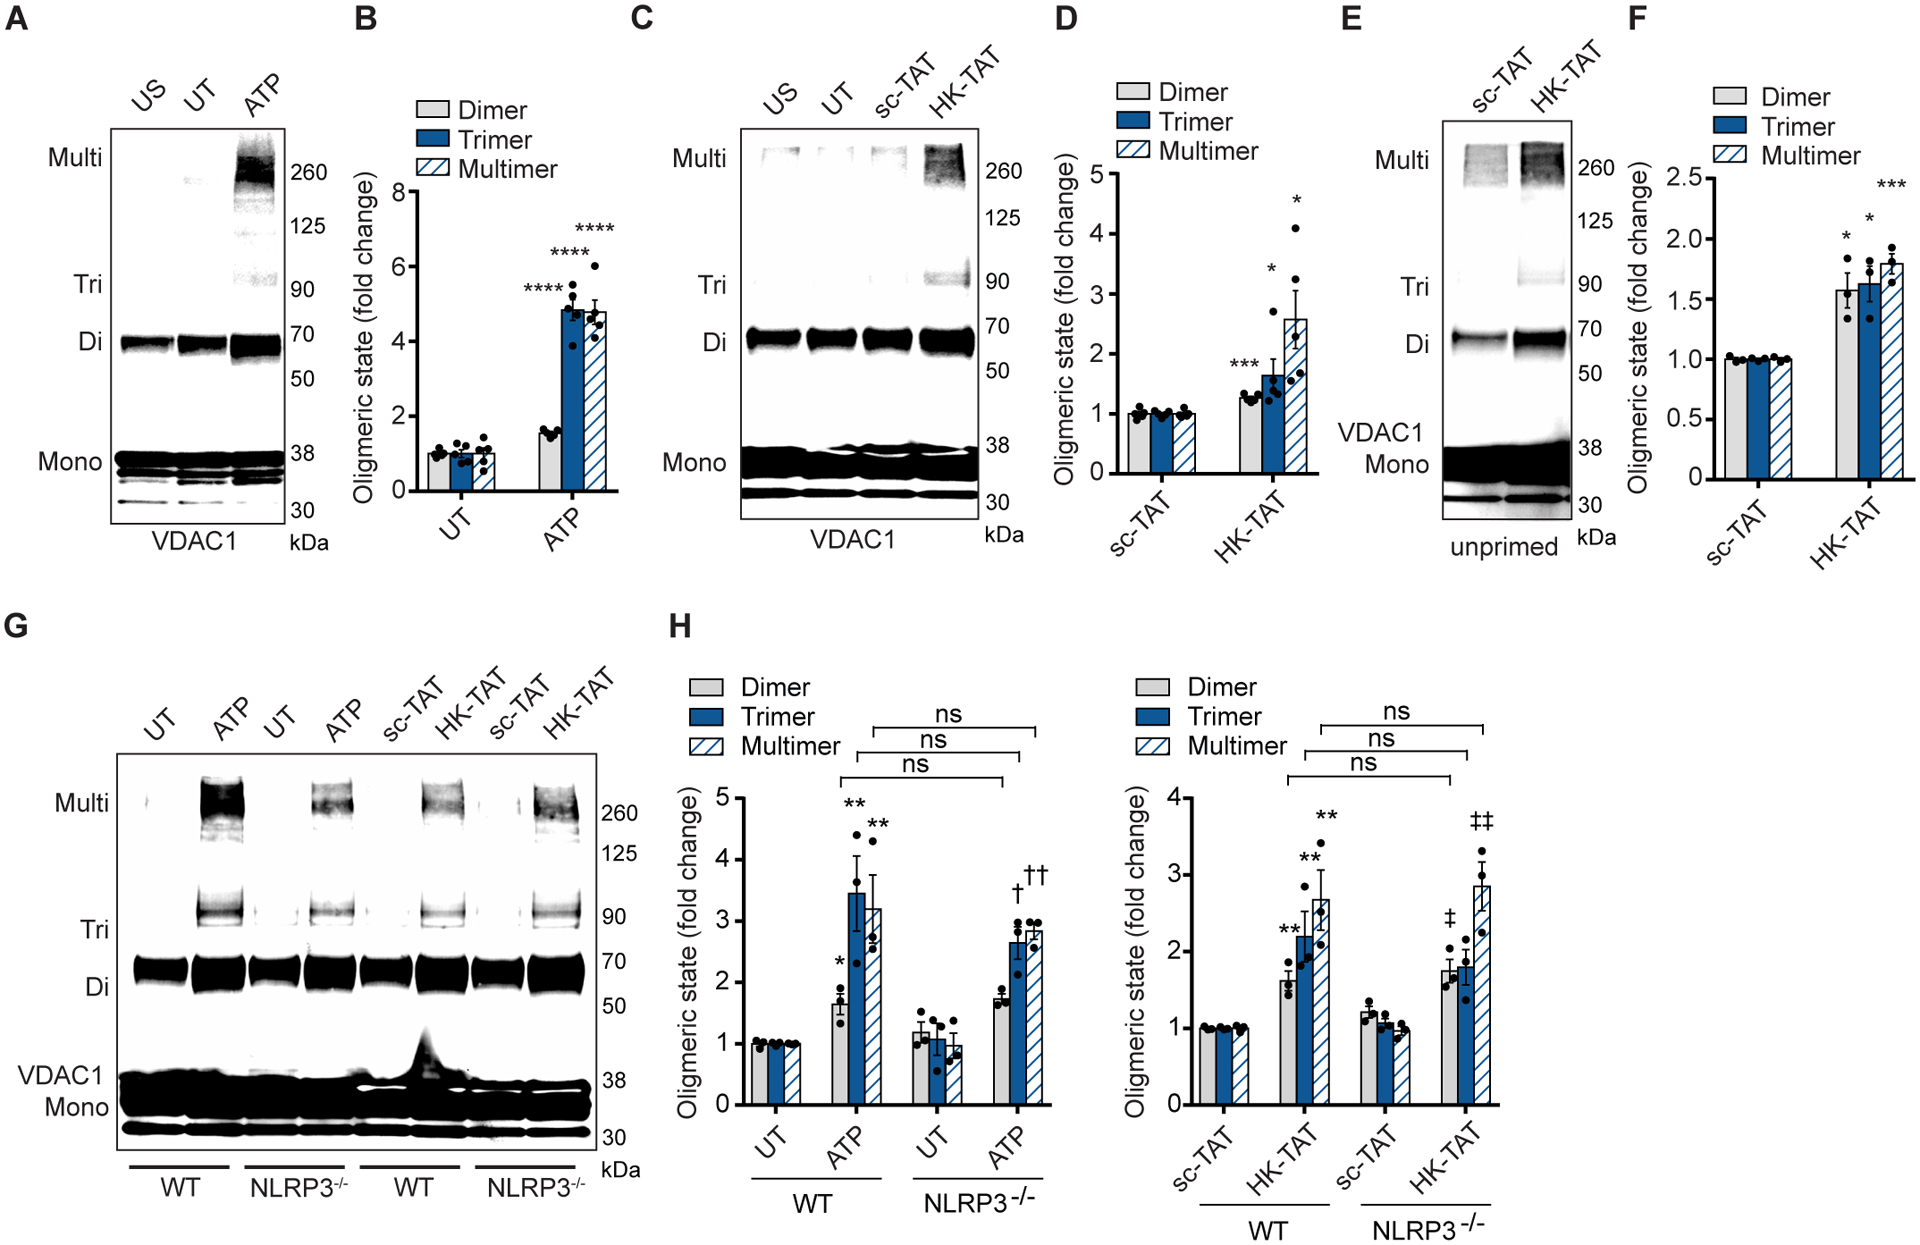
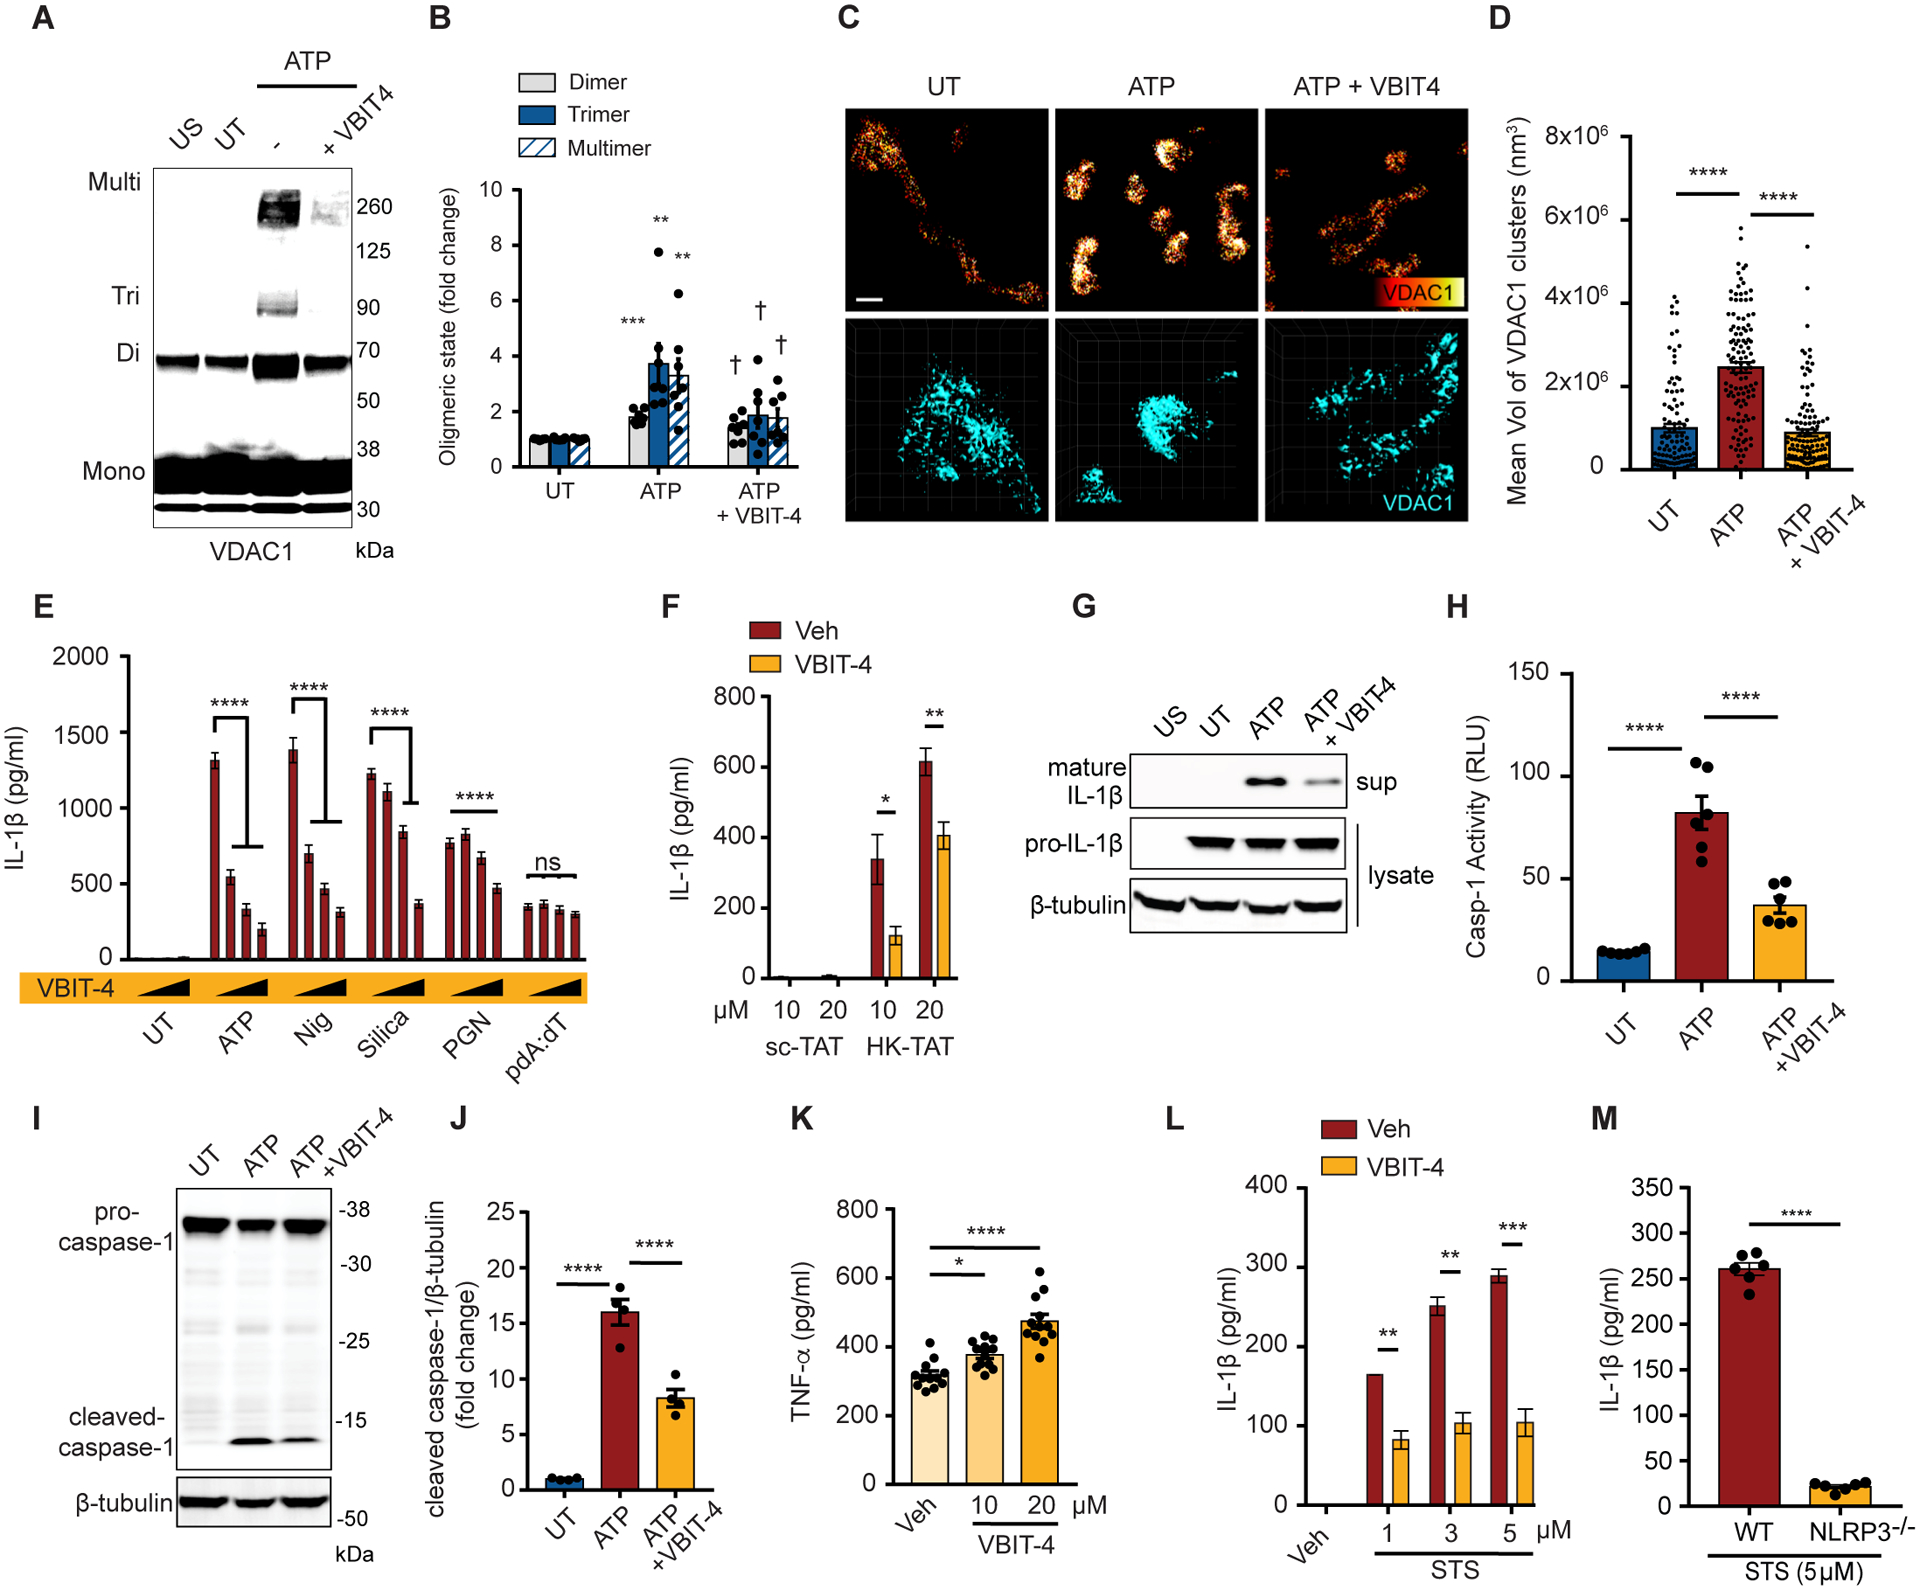
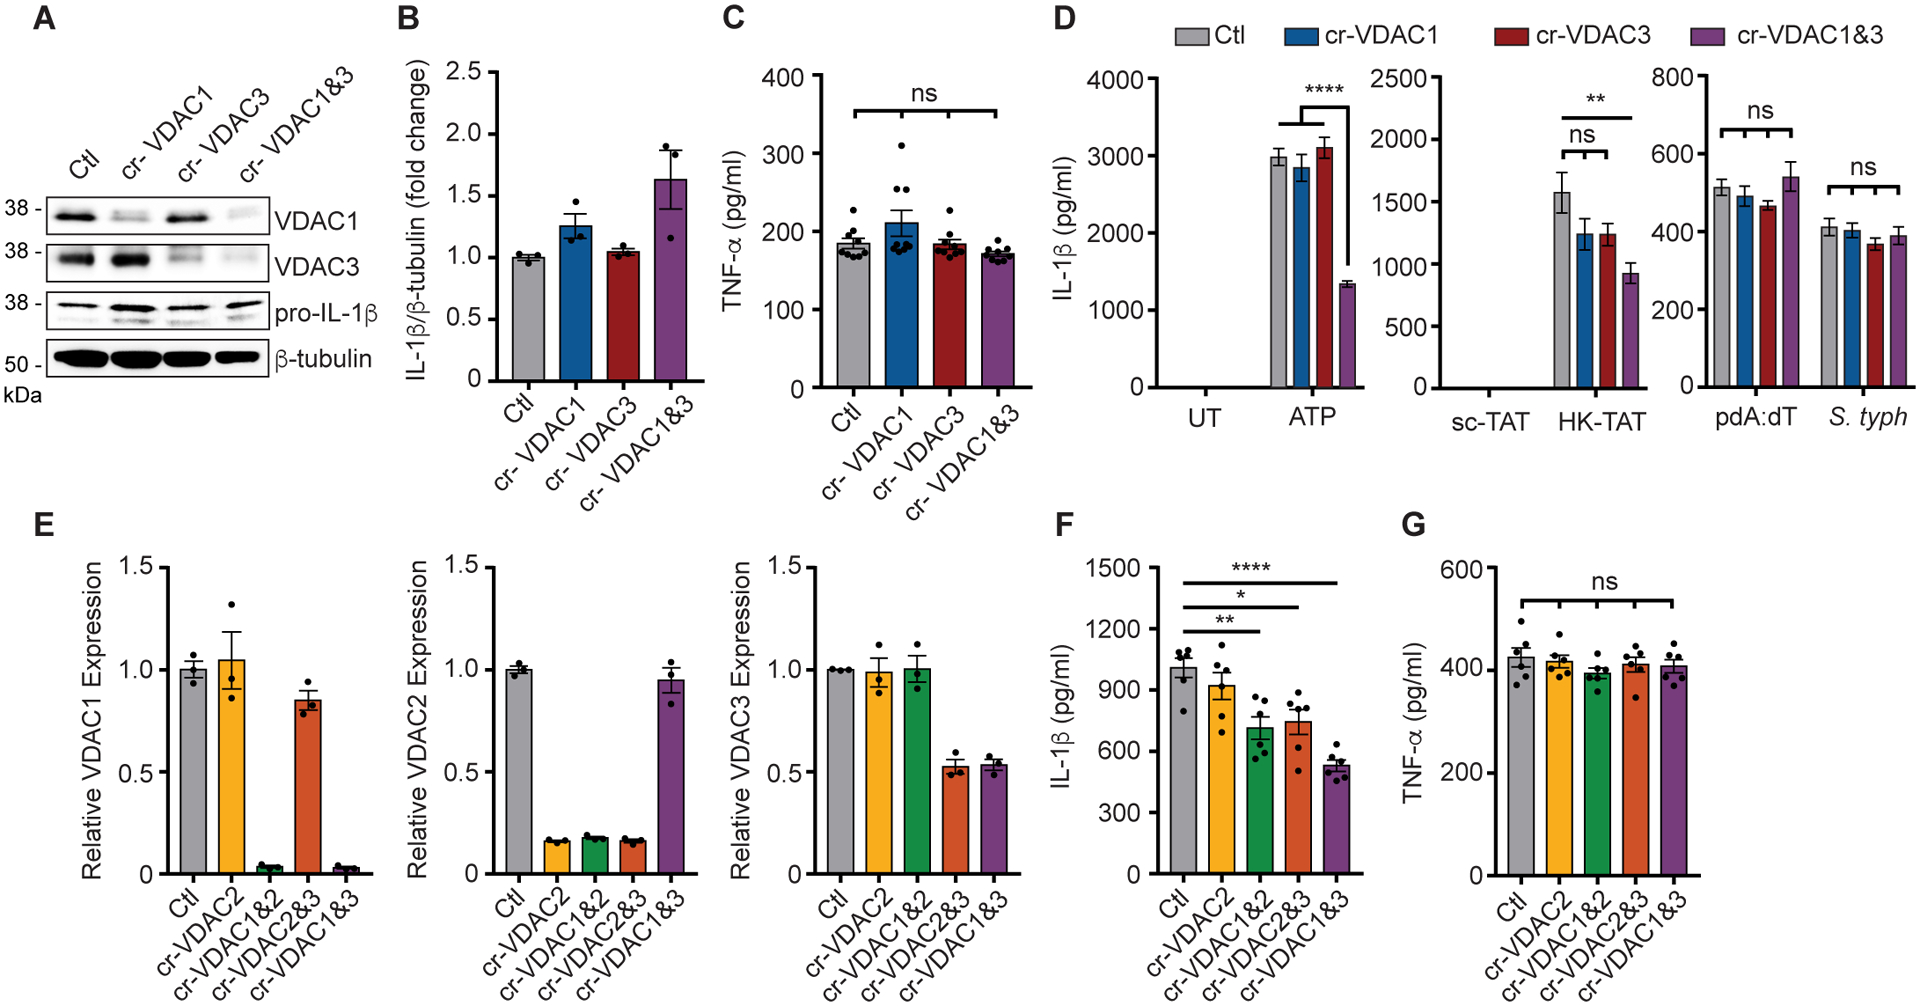
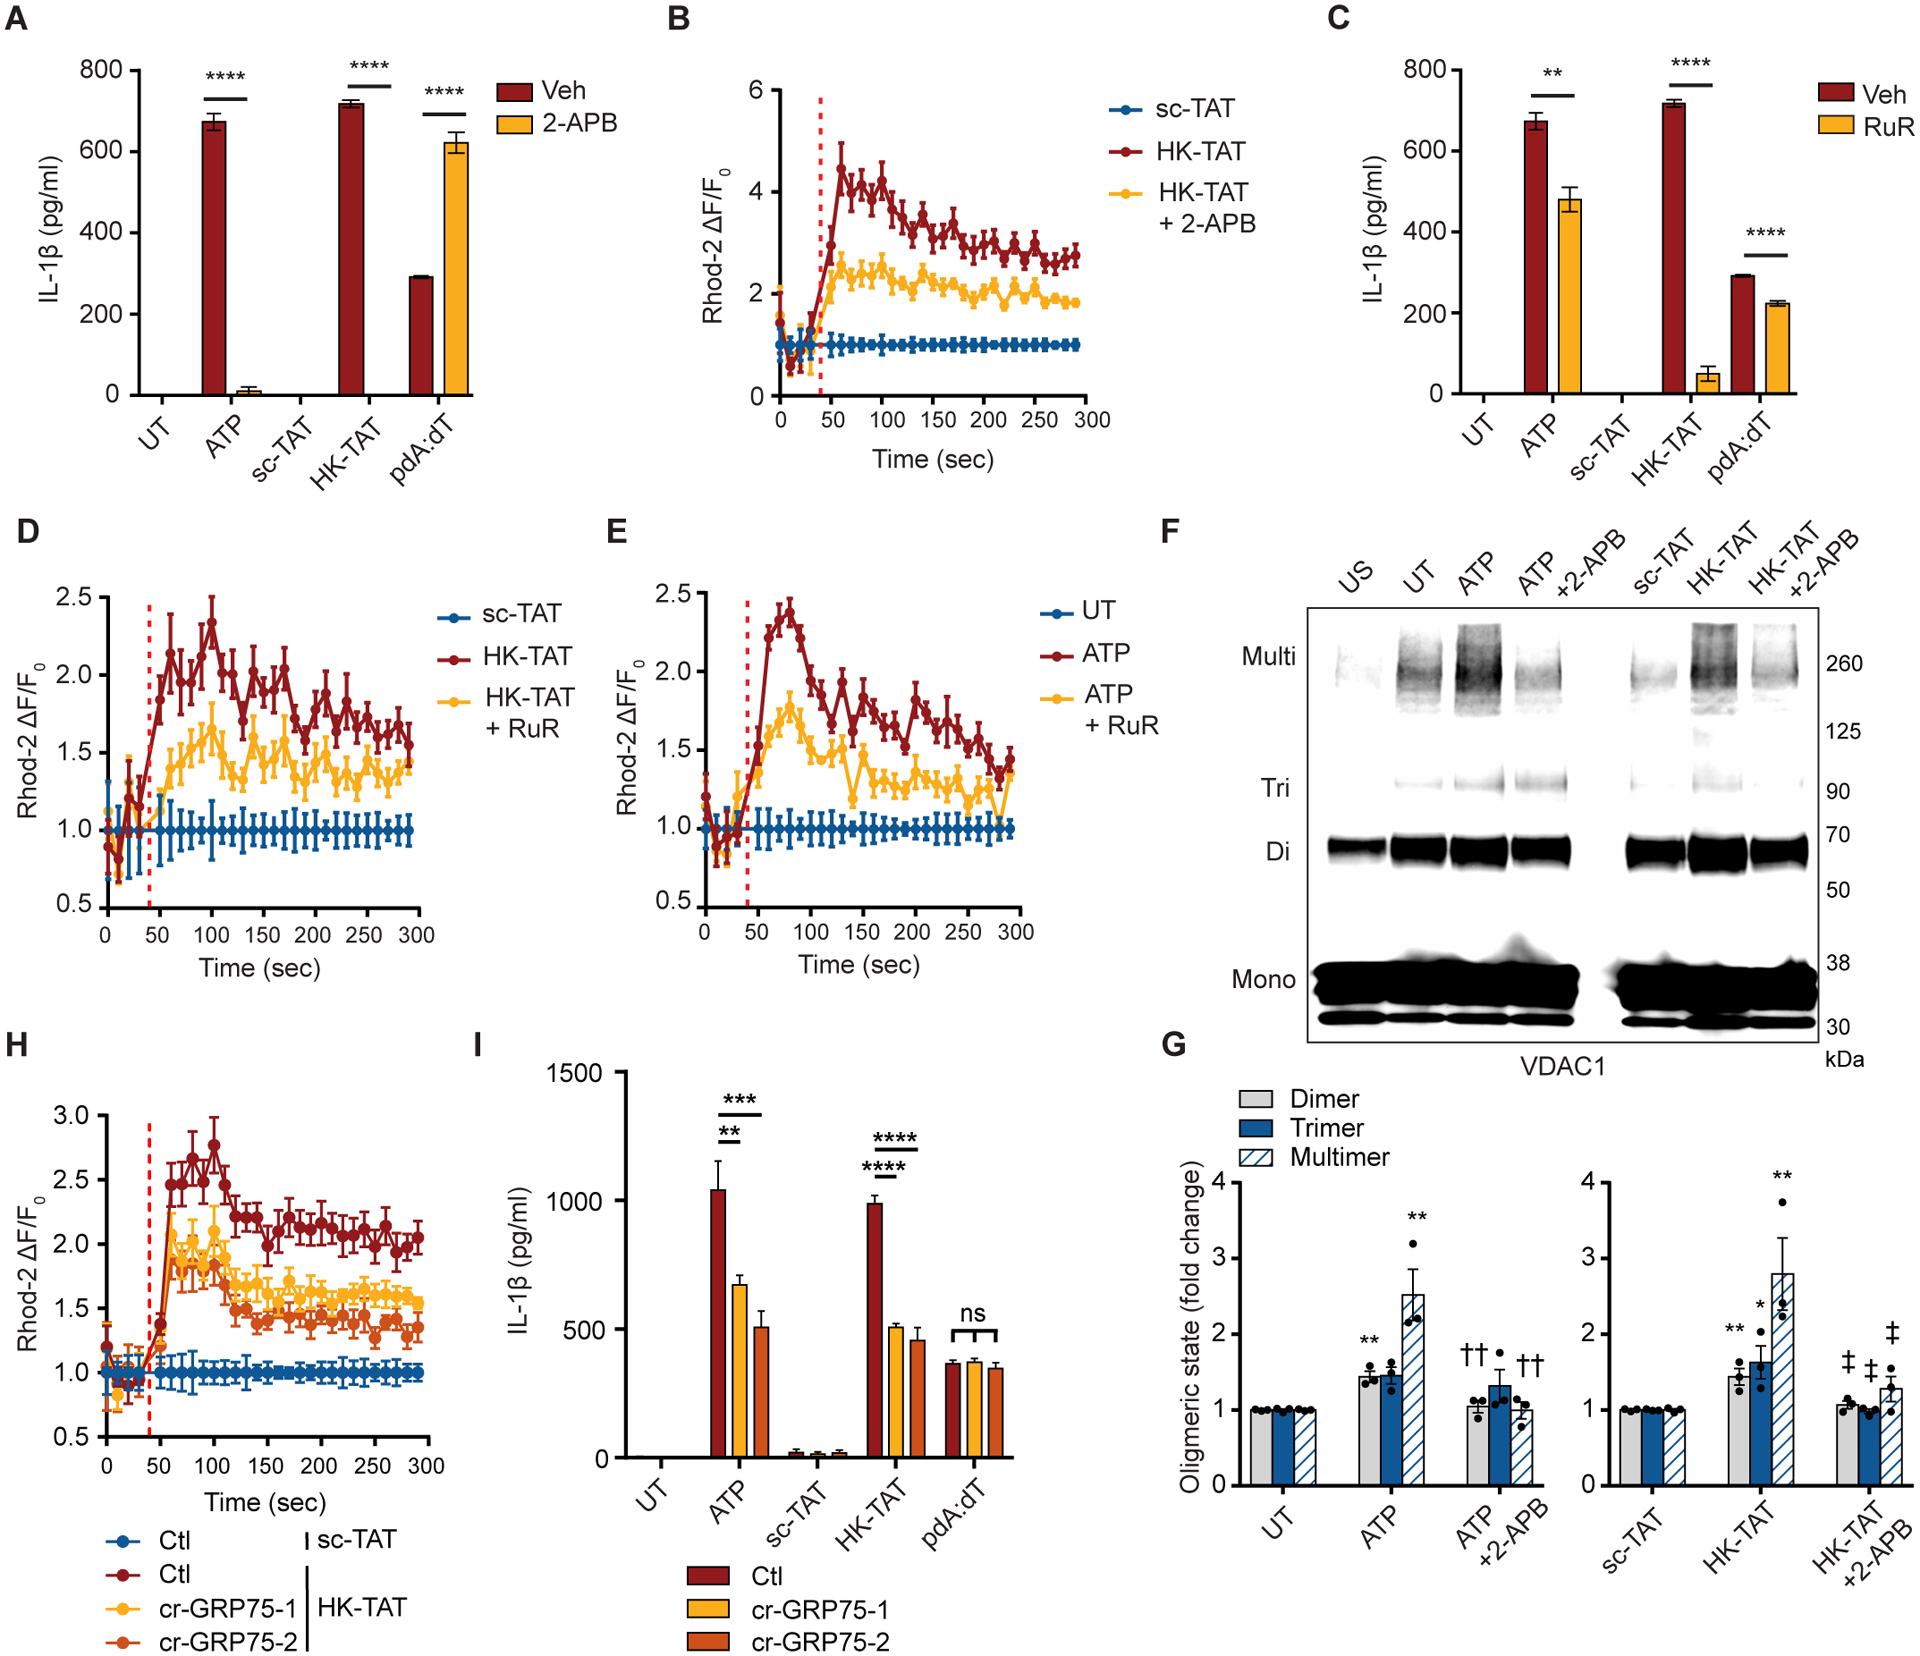
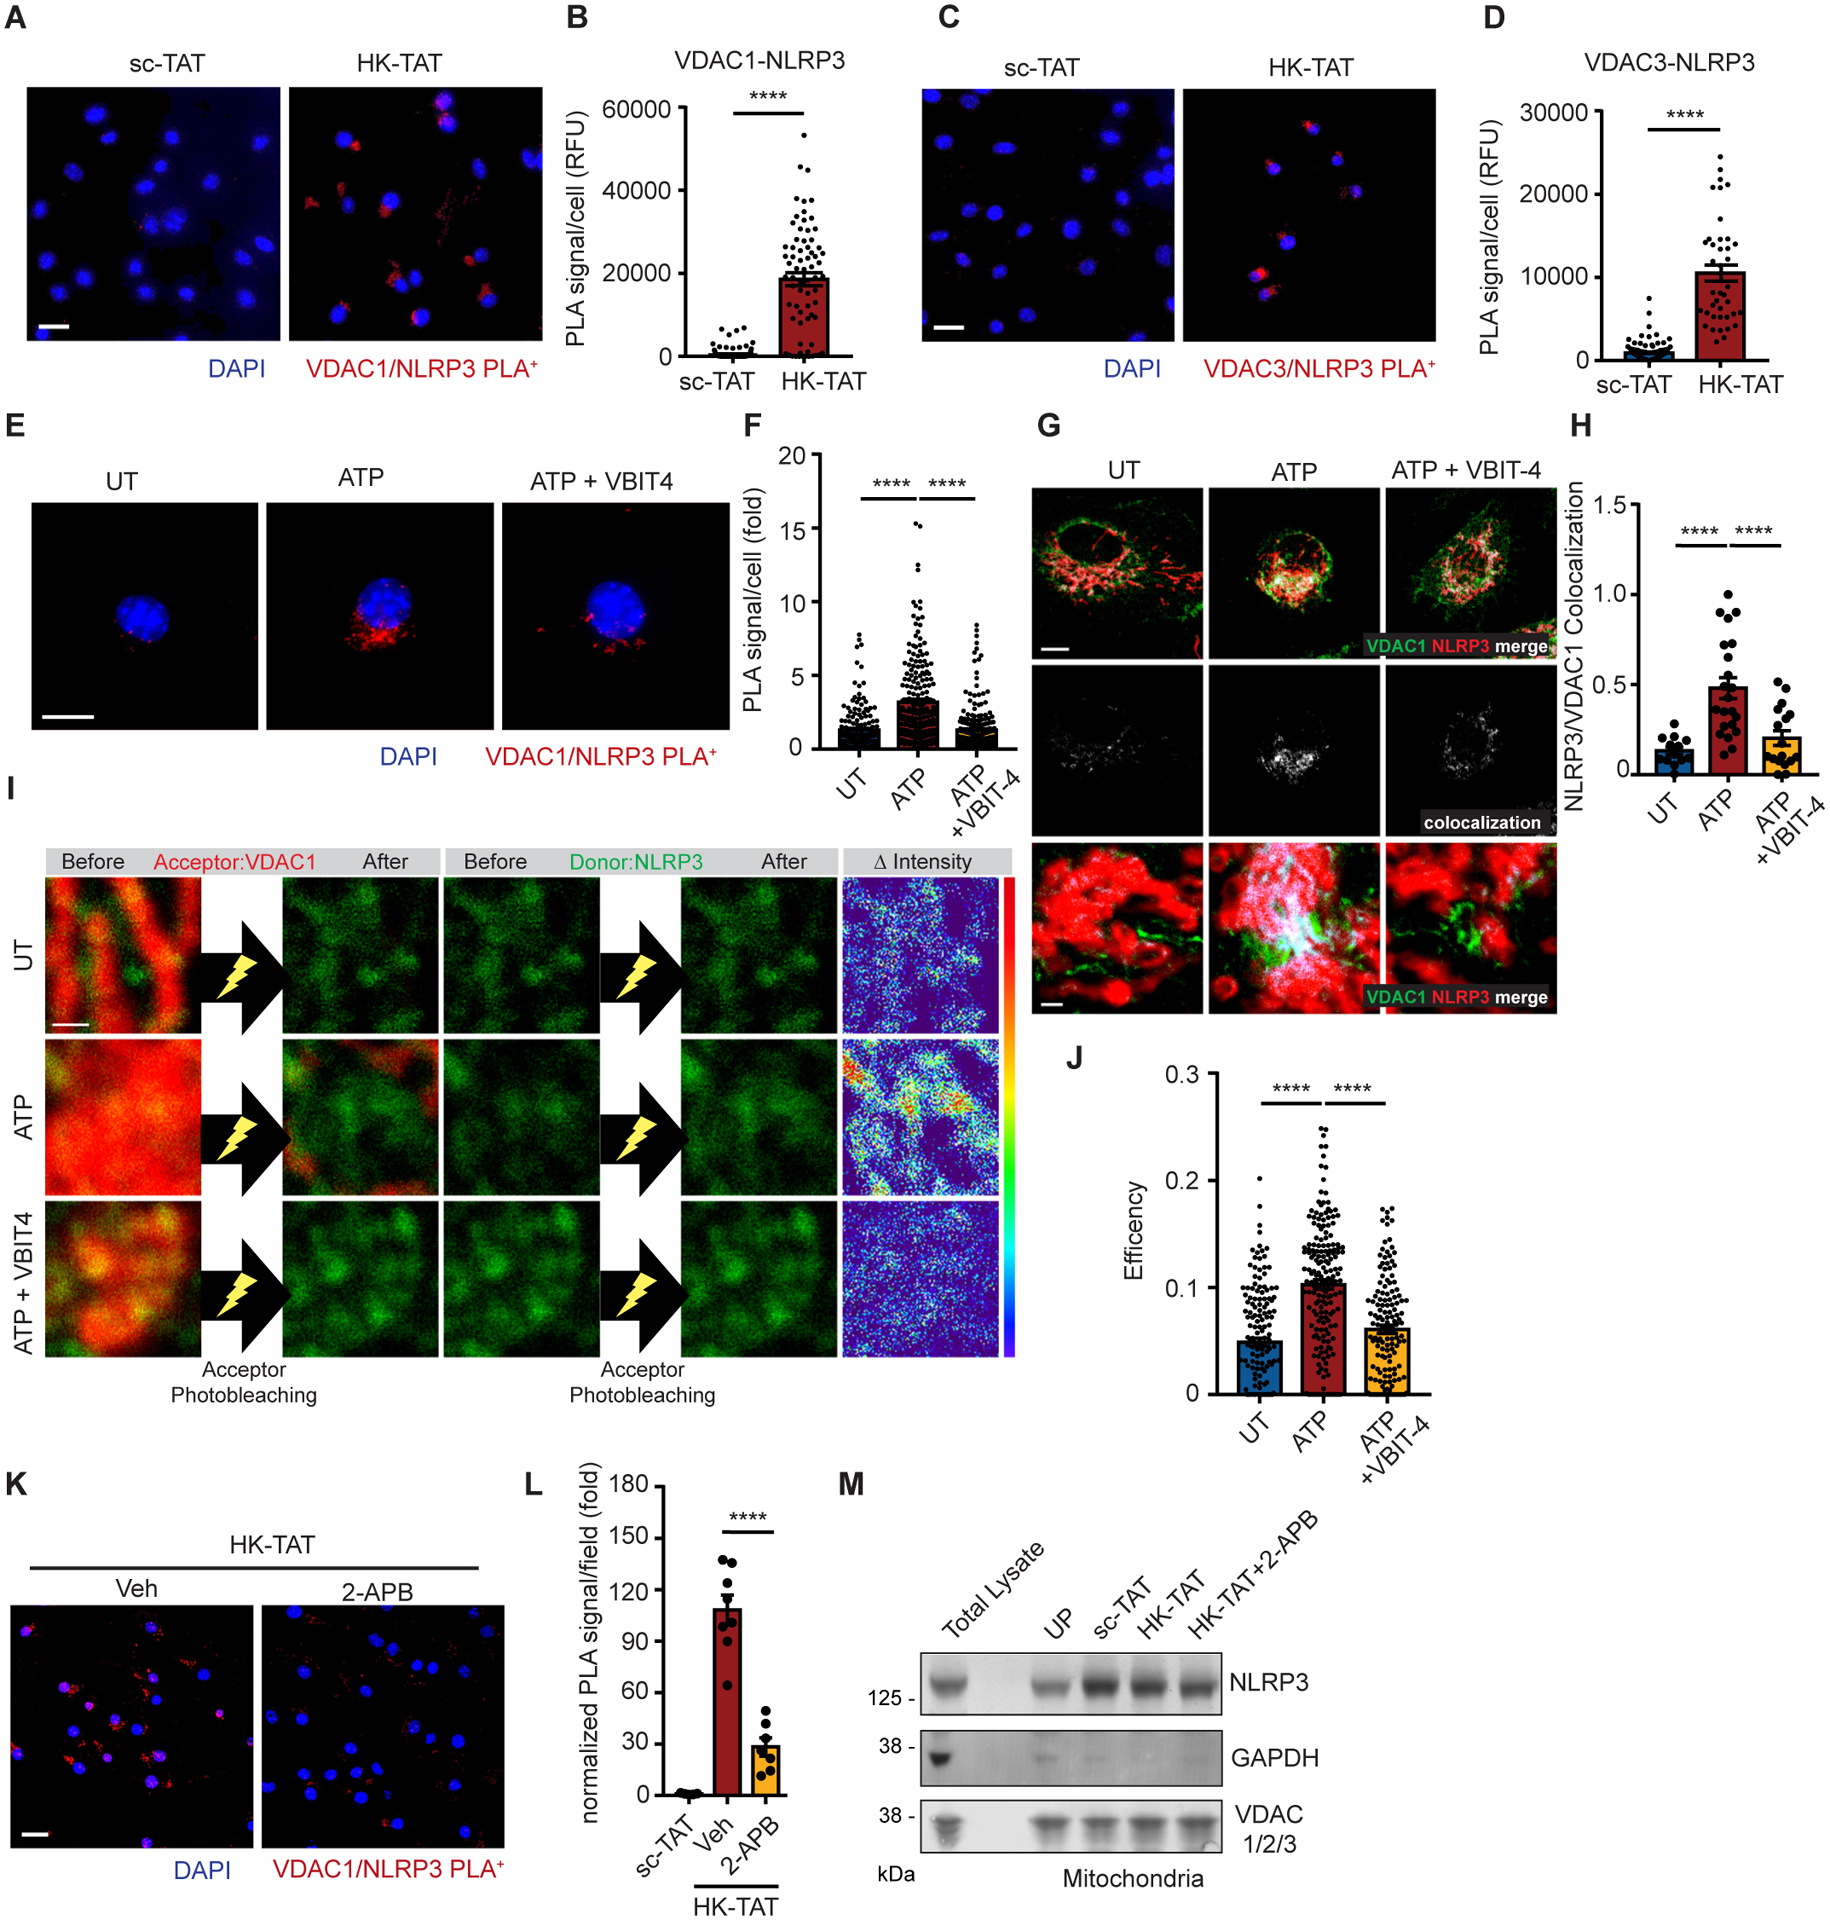
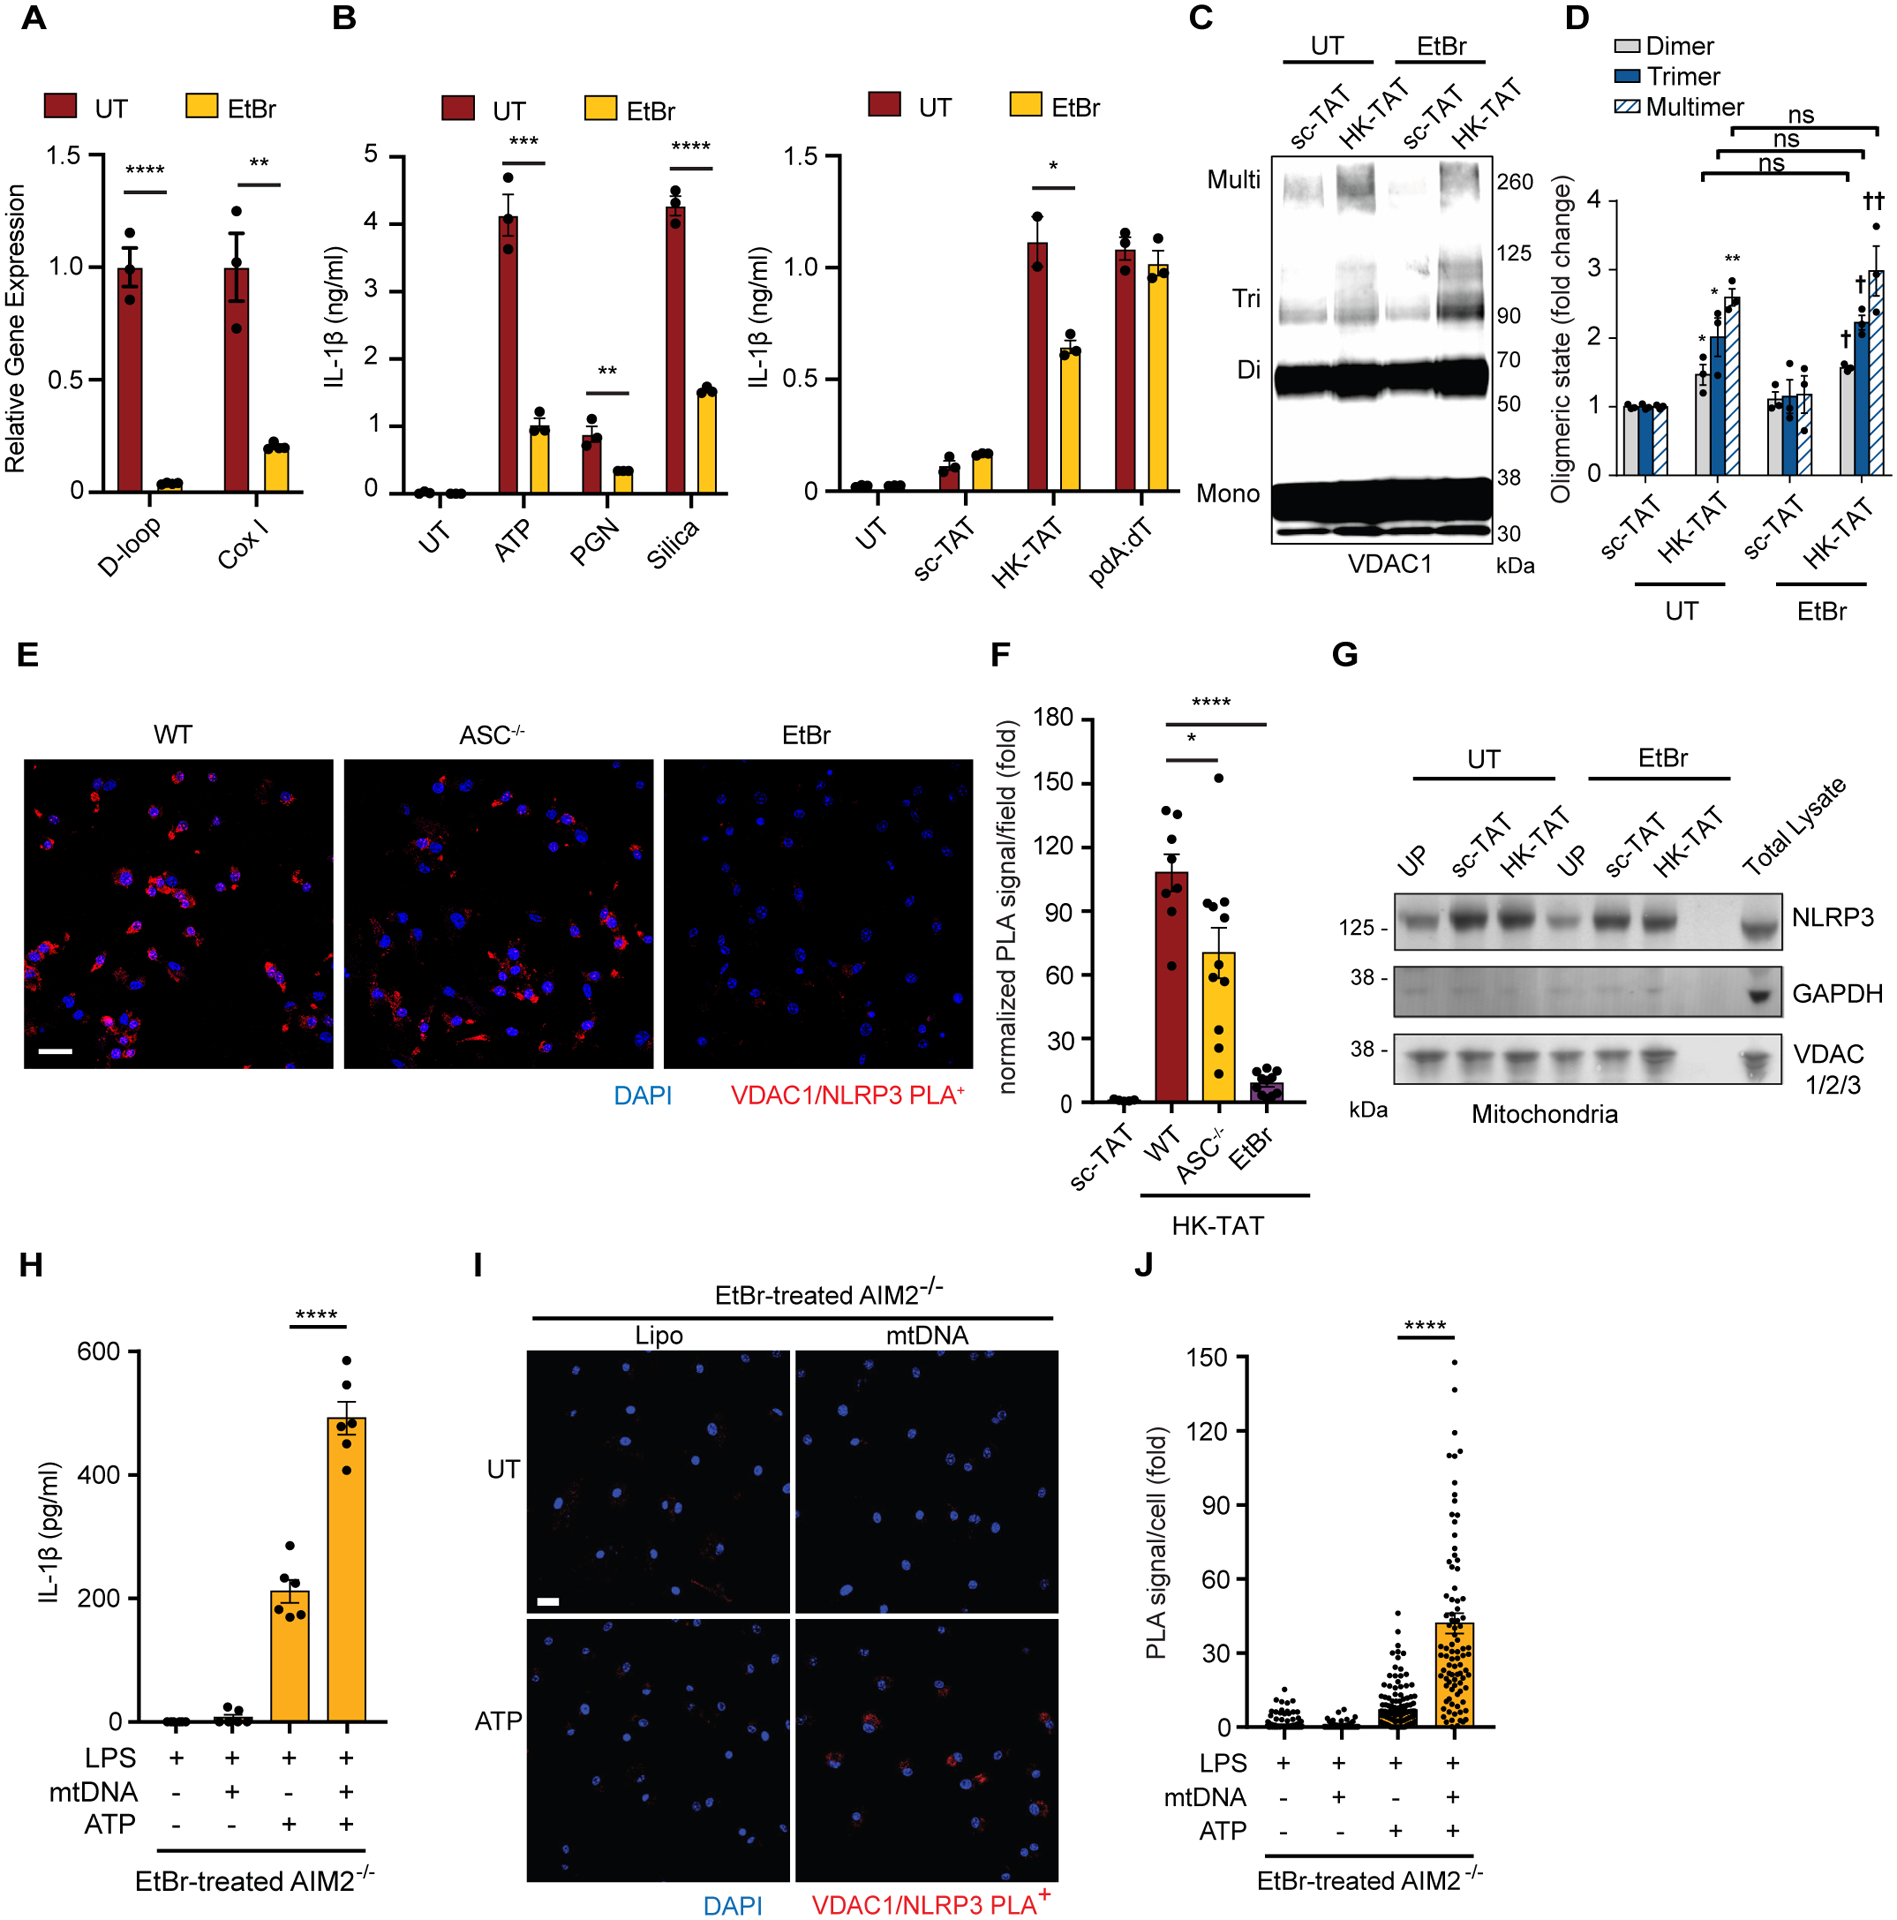
NLRP3 inflammasome activation is a highly regulated process for controlling secretion of the potent inflammatory cytokines IL-1β and IL-18 that are essential during bacterial infection, sterile inflammation, and disease, including colitis, diabetes, Alzheimer's disease, and atherosclerosis. Diverse stimuli activate the NLRP3 inflammasome, and unifying upstream signals has been challenging to identify. Here, we report that a common upstream step in NLRP3 inflammasome activation is the dissociation of the glycolytic enzyme hexokinase 2 from the voltage-dependent anion channel (VDAC) in the outer membrane of mitochondria. Hexokinase 2 dissociation from VDAC triggers activation of inositol triphosphate receptors, leading to release of calcium from the ER, which is taken up by mitochondria. This influx of calcium into mitochondria leads to oligomerization of VDAC, which is known to form a macromolecule-sized pore in the outer membranes of mitochondria that allows proteins and mitochondrial DNA (mtDNA), often associated with apoptosis and inflammation, respectively, to exit the mitochondria. We observe that VDAC oligomers aggregate with NLRP3 during initial assembly of the multiprotein oligomeric NLRP3 inflammasome complex. We also find that mtDNA is necessary for NLRP3 association with VDAC oligomers. These data, together with other recent work, help to paint a more complete picture of the pathway leading to NLRP3 inflammasome activation.


Conflict of interest statement

Competing interests: The authors declare that they have no competing interests.

Figures

Fig. 1.
Fig. 1.. Common NLRP3 inflammasome activators trigger HK release from mitochondria.
(A) Immunoblot of hexokinase 2 (HK2) and tubulin in cytosolic fractions from mouse BMDM primed with LPS for 3 hr and left untreated (UT) or activated with ATP (5 mM, 30 min), nigericin (Nig, 3 μM, 30 min), peptidoglycan (PGN, 40 μg/ml, 6 hr) or silica particles (20 μg/ml, 6 hr). Clotrimazole (CTM) treatment was used as a positive control for hexokinase release from mitochondria. (B) LPS-primed BMDM expressing HK2-GFP were imaged before and after treatment with 5 mM ATP as indicated. (C) Immunoblot time course of HK2 and hexokinase 1 (HK1) together with controls cytochrome c (CytoC), VDAC 1/2/3, and tubulin in cytosol fractions from BMDM stimulated with ATP (5 mM) for the indicated periods. (D) STED images of LPS-primed BMDM co-stained with antibodies to VDAC1 and HK2 and stimulated or not with ATP (5 mM, 1hr). Scale bar = 3 μm Colocalization was quantified in multiple cells (n = 65–59 cells across 5 independent experiments). Data are presented as means ± SEM. ****p < 0.0001 (unpaired t test).
Fig. 2.
Fig. 2.. NLRP3 activators trigger VDAC oligomerization.
(A and B) Immunoblot of VDAC1 cross-linking in unprimed, unstimulated BMDM (US) or LPS-primed cells left untreated (UT) or stimulated with ATP (5 mM, 1hr) (A), and quantitative analysis of oligomers in multiple independent immunoblots (B) (n = 5). (C and D) Immunoblot of VDAC1 cross-linking assay as in (A) but stimulated with scramble peptide (sc-TAT) or with HK-TAT (20 μM, 2 hr) (C) and quantitative analysis of oligomers in multiple independent immunoblots (D) (n = 5). (E and F) Immunoblot of VDAC1 cross-linking assay as in (C), but in unprimed BMDM (E) and quantitative analysis of oligomers in multiple independent immunoblots (F) (n = 3). (G and H) Immunoblot of VDAC1 cross-linking assay in LPS-primed BMDM from wild type (WT) or NLRP3−/− mice stimulated as indicated (G) and quantitative analysis of oligomers in multiple independent immunoblots (H) (n = 3). Graphical data are presented as means ± SEM. *p < 0.05, ***p < 0.001, ****p < 0.0001, †p < 0.05, ††p < 0.01 (compared to UT of NLRP3−/−), ‡p < 0.05, ‡‡p < 0.01 (compared to sc-TAT of NLRP3−/−). Comparisons were performed using unpaired t test (B, D, F) or one-way ANOVA with Bonferroni correction (H).
Fig. 3.
Fig. 3.. VDAC Oligomerization is required for NLRP3 inflammasome activation.
(A and B) Immunoblot of VDAC1 cross-linking in LPS-primed BMDM left untreated (UT) or stimulated with ATP (5 mM, 1 hr) with or without VBIT-4 (20 μM) (A), and quantitative analysis of oligomers in multiple independent immunoblots (B) (n = 7). (C) Highly magnified representative τ-STED images of VDAC1 on individual mitochondria in LPS-primed BMDM stimulated or not with ATP (30 min) with VBIT-4 as indicated. Upper panels scale bar 500 nm. Lower panels show 3D images used to calculate cluster volumes (grid unit = 200 nm). (D) Quantification of VDAC1 cluster size derived from images as in (C) (n = 109–121 mitochondria across 5 independent experiments) (E) IL-1β secretion measured by ELISA from LPS-primed BMDM stimulated as indicated (ATP (2 mM, 30 min), Nig (3 μM, 30 min), silica (20 μg/ml, 6 hr), PGN (40 μg/ml, 6 hr), or pdA:dT (1 μg/ml, 6 hr)) in the presence of increasing concentrations of VBIT-4 (5–20 μM) (n = 8 replicates across 3 experiments). (F) IL-1β secretion measured by ELISA from LPS-primed BMDM stimulated with sc-TAT or HK-TAT (2 hr) at the indicated concentrations in the presence of absence of VBIT-4 (n = 6). (G to J) LPS-primed BMDM were stimulated or not with ATP in the presence or absence of VBIT-4 as in (E). The presence of mature IL-1β in culture supernatants and pro-IL-1β in cell lysate was assessed by immunoblotting (G), activation of caspase-1 was assessed in cell pellets (n = 6) (H), cleaved caspase-1 in cell lysates was detected by immunoblotting (I) and quantified across multiple independent immunoblots (J) (n = 4). (K) BMDM were primed with LPS in the presence or absence of VBIT-4 and TNF-α production was assessed by ELISA (n = 12 across 3 experiments). (L) LPS-primed BMDM were treated with staurosporine (STS, 5 μM, 6 hr) in the presence or absence of VBIT-4, and IL-1β production was assessed by ELISA (n = 3). (M) IL-1β was measured in LPS-primed WT or NLRP3−/− BMDM treated with STS, and IL-1β production was assessed by ELISA (n = 6). Data are presented as means ± SEM. *p < 0.05, **p < 0.01, ***p < 0.001, ****p < 0.0001 (compared to UT if not otherwise indicated), p < 0.05 (compared to ATP) Comparisons were performed by one-way ANOVA withTukey’s post hoc test (B, D, E, H, J, K) or unpaired t test (F, L, M).
Fig. 4.
Fig. 4.. Multiple VDACs participate in NLRP3 inflammasome activation.
(A) Immunoblot of VDAC1, VDAC3, IL-1β, and β-tubulin from LPS-primed BMDM in which VDAC1 and/or VDAC3 are knock-downed using gRNAs (cr-VDAC1, cr-VDAC3, Ctl = control/no gRNA). (B) Combined quantitative analysis of pro-IL-1β protein expression across independent experiments (n = 3). (C) Secretion of TNF-α into the culture supernatant was measured by ELISA (n = 9 replicates across 3 experiments). (D) IL-1β secretion was measured by ELISA in culture supernatants of LPS-primed cells with ATP (n = 11 replicates across 3 experiments), HK-TAT (n = 6 replicates across 2 experiments), pdA:dT or infection with S. Typhimurium (n = 12 replicates across 3 experiments). (E) Relative mRNA expression of VDAC1, VDAC2, and VDAC3 was measured by RT-qPCR in BMDM in which VDACs were knock-downed as indicated (n = 3 biological replicates). (F) IL-1β secretion was measured by ELISA from primed BMDM with the indicated VDACs knocked down and induced with ATP (n = 6). (G) TNF-α secretion in primed BMDM in which the indicated VDACs are knocked down (n = 6). Data are presented as means ± SEM. *p < 0.05, **p < 0.01, ***p < 0.001, ****p < 0.0001 (one-way ANOVA, Tukey’s post hoc test).
Fig. 5.
Fig. 5.. ER calcium stores drive VDAC oligomerization.
(A) LPS-primed BMDM were stimulated or not (Veh = vehicle control) in the presence or absence of the IP3R antagonist 2-APB (100 μM), and IL-1β production was assessed by ELISA (n = 3). (B) Primed cells were stimulated with HK-TAT in the presence of absence of 2-APB and mitochondrial Ca2+ levels were assessed by Rhod-2 fluorescence over time (n = 6). (C) IL-1β was measured as in (A) but in the presence or absence of ruthenium red (RuR, 30 μM) (n = 3). (D and E) Ca2+ was measured as in (B) but in cells stimulated with HK-TAT (D) or ATP (E) in the presence or absence of RuR (n = 6). (F and G) BMDM were left unprimed (US) or LPS-primed and treated (ATP, HK-TAT) or not (UT) in the presence or absence of 2-APB as indicated, and oligomerization of VDAC1 was assessed by immunoblot (F) and quantitative analysis of oligomers in multiple independent immunoblots (G) (n = 3). (H) Mitochondrial Ca2+ was measured as in (B) in HK-TAT stimulated cells in which GRP75 knocked down using two different gRNAs (cr-GRP75–1, cr-Grp75–2) (n = 6). (I) IL-1β was measured as in (A) in cells in which GRP75 was knocked down (n = 6). Data are presented as means ± SEM. **p < 0.01, ***p < 0.001, ****p < 0.0001, p < 0.05 (compared to ATP), p < 0.05 (compared to HK-TAT) Comparisons were performed by unpaired t test (A, C) or one-way ANOVA with Bonferroni correction (G, I).
Fig. 6.
Fig. 6.. VDAC oligomers associate with NLRP3 during inflammasome activation.
(A and B) LPS-primed BMDM were stimulated with sc-TAT or HK-TAT (20 μM, 2 hr), and close association between VDAC1 and NLRP3 was assessed by proximity ligation assay (A) (scale bar = 20 μm) and quantified (B) (n = 70–102 cells across 3 independent experiments). RFU = relative fluorescence units. (C and D) VDAC3-NLRP3 close association was assessed as in (A and B) (n = 42–109 cells across 3 independent experiments). (E and F) VDAC1-NLRP3 close association was assessed as in (A and B) (E) (scale bar = 10 μm) except cells were stimulated or not with ATP (2 mM, 30 min) (n = 162–236 cells across 5 independent experiments). (G and H) τ-STED-FLIM images of individual UT or ATP-treated BMDM (2 mM, 30 min) with or without VBIT-4 (20 μM, 1 hr) using antibodies against VDAC1 and NLRP3 (top row, scale bar = 5 μm), and colocalization between VDAC1 and NLRP3 is highlighted (middle row). More magnified regions (bottom row) highlight areas of colocalization (scale bar = 0.5 μm). Colocalization was quantified (H) (n = 13–22 cells across 3 independent experiments). (I and J) Acceptor photobleaching assay with UT or ATP-treated BMDM with or without VBIT-4 using antibodies against VDAC1 as the acceptor (red) and NLRP3 as a donor (green). Representative images (I) of VDAC1 and NLRP3 before and after acceptor photobleaching (left and middle, scale bar = 0.5 μm) and the amounts of changes of the intensity of donor shown by RGB spectrum (right). The degree of acceptor photobleaching was quantified (J) (n=150–181 photobleached areas from 16 cells across 3 experiments). (K and L) VDAC1-NLRP3 close association was assessed as in (A and B) in cells treated or not with the IP3R inhibitor 2-APB (n = 5–8 imaged areas normalized by DAPI count across 2 independent experiments) (scale bar = 20 μm). (M) Mitochondrial fractions from unprimed (UP) BMDM or from LPS-primed BMDM stimulated as indicated were assessed for the presence of NLRP3, VDAC1 and GAPDH by immunoblotting. A total lysate was included for antibody reference. Data are presented as means ± SEM. (F, J, L) ***p < 0.001, ****p < 0.0001 (one-way ANOVA, Tukey’s post hoc test). (B, D) ****p < 0.0001 (unpaired t test).
Fig. 7.
Fig. 7.. Mitochondrial DNA promotes NLRP3 association with VDAC oligomers.
(A) BMDM were grown in the presence of ethidium bromide (EtBr) to deplete mitochondrial DNA (mtDNA), and depletion was confirmed by quantitative PCR of two regions of mtDNA (D-loop and CoxI) normalized to nuclear DNA (n = 3). (B) Ethidium bromide-treated BMDM (EtBr) were LPS-primed and stimulated with ATP (5 mM, 2 hr), PGN (40 μg/ml, 6 hr) or silica (20 μg/ml, 6 hr), or sc-TAT and HK-TAT (20 μM, 2hr), or pdA:dT (1 μg/ml, 6 hr), and IL-1β was measured by ELISA (n = 3). (C and D) BMDM treated or not with EtBr were LPS-primed and treated with sc-TAT or HK-TAT. Oligomerization of VDAC1 was assessed by immunoblot (C) and quantitative analysis of oligomers in multiple independent immunoblots (D) (n = 3). (E and F) LPS-primed WT, ASC−/− or EtBr-treated BMDM were stimulated with HK-TAT, and close association between VDAC1 and NLRP3 was assessed by proximity ligation assay (E) (scale bar 20 μm) and quantified (F) (n = 5–11 imaged areas normalized by DAPI count across 2 independent experiments). (G) NLRP3, GAPDH, and VDAC levels were assessed by immunoblotting of mitochondrial fractions from BMDM and EtBr-treated BMDM primed with LPS and stimulated as indicated or left unprimed (UP). (H) IL-1β was measured in EtBr-treated AIM2−/− BMDM primed with LPS and stimulated with or without mtDNA or ATP (n = 6). (I and J) LPS-primed EtBr-treated AIM2−/− BMDM were stimulated or not with ATP and close association between VDAC1 and NLRP3 was assessed by proximity ligation assay (I) (scale bar 20 μm) and quantified (J) (n = 90–176 cells across 3 independent experiments). Data are presented as means ± SEM. *p < 0.05, **p < 0.01, ***p < 0.001, ****p < 0.0001, p < 0.05 (compared to sc-TAT of EtBr-treated BMDM) Comparisons were made by unpaired t test (A, B, F) or one-way ANOVA with Bonferroni correction (D) or Tukey’s post hoc test (H, J).

References

    1. Nozaki K, Li L, Miao EA, Innate Sensors Trigger Regulated Cell Death to Combat Intracellular Infection. Annu. Rev. Immunol 40, 469–498 (2022). - PMC - PubMed
    1. Tartey S, Kanneganti TD, Differential role of the NLRP3 inflammasome in infection and tumorigenesis. Immunology 156, 329–338 (2019). - PMC - PubMed
    1. Grant R, Dixit V, Mechanisms of disease: Inflammasome activation and the development of type 2 diabetes. Front. Immunol 4, 50 (2013). - PMC - PubMed
    1. Tzeng T-C, Golenbock D, NLRP3 inflammasome activation in Alzheimer’s disease (INC9P.446). J. Immunol 192, 188.185–188.185 (2014).
    1. Zhang Y, Dong Z, Song W, NLRP3 inflammasome as a novel therapeutic target for Alzheimer’s disease. Signal Transduct. Target Ther 5, 37 (2020). - PMC - PubMed

MeSH terms