. 2023 Jun 16;9(24):eadf5464.
doi: 10.1126/sciadv.adf5464. Epub 2023 Jun 16.

Single-cell and spatial transcriptome analysis reveals the cellular heterogeneity of liver metastatic colorectal cancer

Affiliations

Single-cell and spatial transcriptome analysis reveals the cellular heterogeneity of liver metastatic colorectal cancer

Fei Wang et al. Sci Adv. .

Abstract

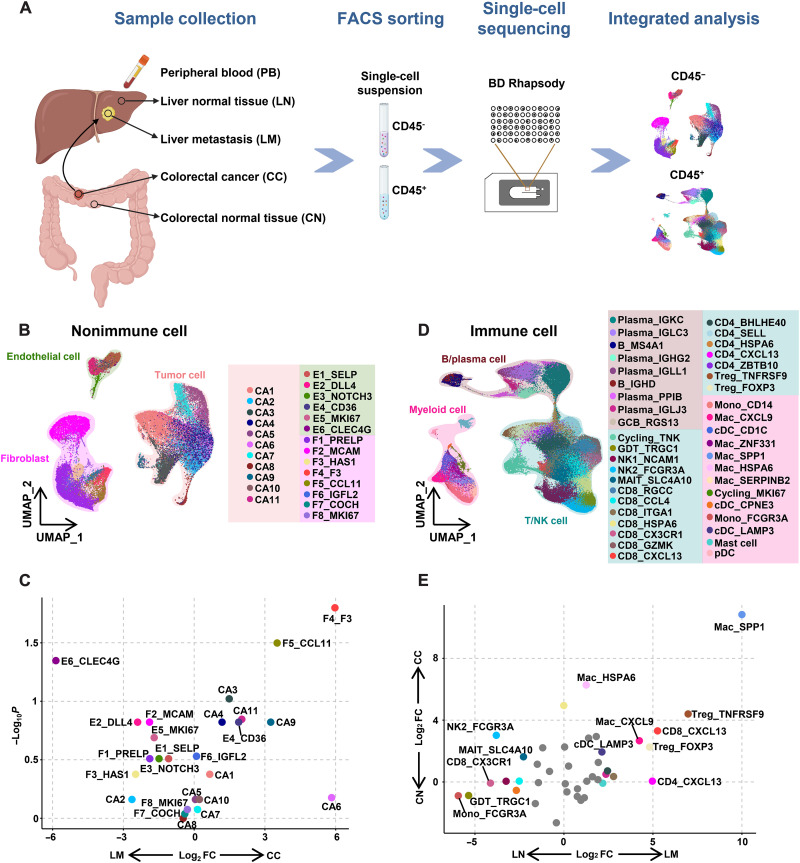
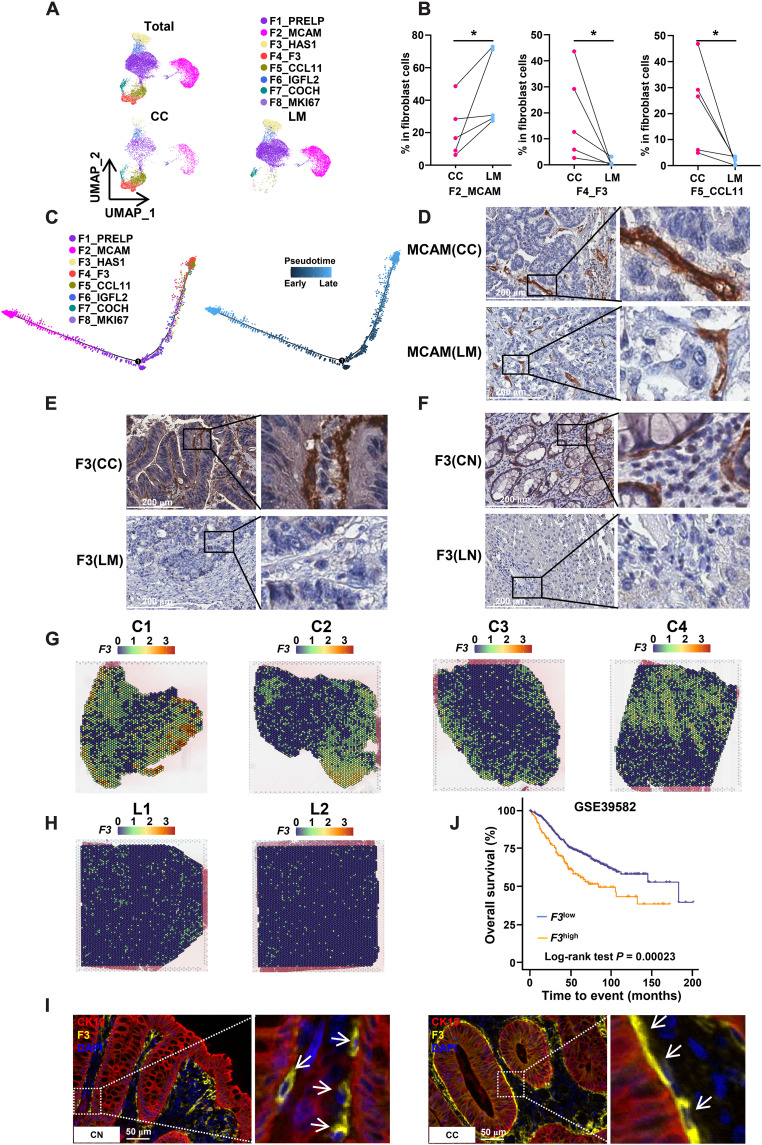
In this study, we comprehensively charted the cellular landscape of colorectal cancer (CRC) and well-matched liver metastatic CRC using single-cell and spatial transcriptome RNA sequencing. We generated 41,892 CD45- nonimmune cells and 196,473 CD45+ immune cells from 27 samples of six CRC patients, and found that CD8_CXCL13 and CD4_CXCL13 subsets increased significantly in liver metastatic samples that exhibited high proliferation ability and tumor-activating characterization, contributing to better prognosis of patients. Distinct fibroblast profiles were observed in primary and liver metastatic tumors. F3+ fibroblasts enriched in primary tumors contributed to worse overall survival by expressing protumor factors. However, MCAM+ fibroblasts enriched in liver metastatic tumors might promote generation of CD8_CXCL13 cells through Notch signaling. In summary, we extensively analyzed the transcriptional differences of cell atlas between primary and liver metastatic tumors of CRC by single-cell and spatial transcriptome RNA sequencing, providing different dimensions of the development of liver metastasis in CRC.


Figures

Fig. 1.
Fig. 1.. Global cellular landscape in CRC liver metastasis.
(A) Schematic overview of the experimental design and analytical workflow. (B) UMAP visualization of nonimmune cell clusters. (C) Volcano plot comparing cell type relative abundance of nonimmune cell clusters in CC versus LM (n = 5 patients). The x axis represents the log2 fold change, and the y axis represents the −log10 P value according to Mann-Whitney U test. Each dot represents a cell type. (D) UMAP visualization of immune cell clusters. (E) Volcano plot comparing cell type relative abundance of immune cell clusters in the tumors versus the paratumors (n = 6 patients). x and y axes represent the log2 fold change according to Mann-Whitney U test. Each dot represents a cell type.
Fig. 2.
Fig. 2.. Cellular identification in spatial transcriptomic samples.
(A) Overview of the spatial transcriptomic sections. H&E staining of spatial transcriptomic sections (left). Tumor tissue and paratumor tissue identification of each section (middle). Spatial cluster distribution of each section (right). (B) Heatmap showing the enrichment scores of hallmark gene sets of tumor tissue and paratumor tissue in each section. (C) Cluster identification combined with single-cell RNA expression profiles in primary CRC sections. Left: SPOTlight deconvolution results, which show the cell cluster proportions in each spot. Middle: Cluster definition of each spot, which is identified as the most dominant cell cluster there. Right: Proportions of identified cell clusters in different regions, which represent the mean proportions of cell clusters in all spots of each region. (D) Cluster identification combined with single-cell RNA expression profiles in liver metastatic sections.
Fig. 3.
Fig. 3.. Immune landscape of myeloid cells.
(A) UMAP visualization of myeloid cell clusters. (B) Proportions of the myeloid cell clusters in CN, CC, LN, LM, and PB. (C) Proportions of MAC_SPP1, MAC_CXCL9, and cDC_LAMP3 subsets in myeloid cells. P values were determined by the paired nonparameter test. (D) Volcano plot showing differentially expressed genes between MAC_CXCL9 and MAC_SPP1 subsets. (E) GSVA analysis showing pathways enriched in MAC_CXCL9 and MAC_SPP1 subsets. (F) Monocle analysis showing the developmental trajectory of myeloid cells. (G) Feature plots showing expressions of LAMP3 and CCR7 in myeloid cells. (H) Violin plots showing expressions of CD40, CD80, and CD86 in myeloid cells.
Fig. 4.
Fig. 4.. Transcriptional reprogramming of tumor-infiltrated T cells.
(A) Proportions of the CD8+ T cell clusters in CN, CC, LN, LM, and PB. (B) Proportions of the CD4+ T cell clusters in CN, CC, LN, LM, and PB. (C) Volcano plot comparing cell type relative abundance of T cell clusters in the tumors versus the paratumors (n = 6 patients). X and y axes represent the log2 fold change according to Mann-Whitney U test. Each dot represents a cell type. (D) Proportions of CD8_CXCL13 subsets in CD8+ T cells. (E) Proportions of CD4_CXCL13 subsets in CD4+ T cells. (F) GSVA pathway analysis of CD8+ T cell clusters. (G) GSVA pathway analysis of CD4+ T cell clusters. (H) Ki67 expression levels in different cell subsets in CN, CC, LN, and LM by flow cytometry. Gated on tumor-infiltrated CD8+CD45RO+ T cells.
Fig. 5.
Fig. 5.. Characterization and prognostic effect of CXCL13+ T cells.
(A) Volcano plot showing differentially expressed genes between CD8_CXCL13 and other CD8+ T cells. (B) Feature plots showing the checkpoint and effector molecules in CD8+ T cells. (C) Monocle analysis showing the developmental trajectory of CD8+ T cells. (D) Multicolor IHC staining of CD69+CD103+CD8+ T cells in one representative CRC tumor. (E) Distances of CD69+CD103+CD8+ T cells and other CD8+ T cells to cancer cells. (F) Multicolor IHC staining of CD103+CD8+ T cells in CRC tertiary lymphoid structure. (G) Relationship of tertiary lymphoid structure score and CD8_CXCL13 infiltration score in the GSE39582 dataset. (H) Overall survival of CXCL13high and CXCL13low patients from the GSE39582 dataset.
Fig. 6.
Fig. 6.. Transcriptome signatures and heterogeneity of fibroblasts in primary and metastatic tumors.
(A) UMAP visualization of fibroblast clusters. (B) Proportions of the F2_MCAM, F4_F3, and F5_CCL11 clusters in CC and LM (P values were determined by the paired nonparameter test). (C) Monocle analysis showing the developmental trajectory of fibroblasts. (D) IHC staining of F2_MCAM in CC and LM. (E) IHC staining of F4_F3 in CC and LM. (F) IHC staining of F4_F3 in CN and LN. (G) F4_F3 fibroblast distributions in CC (C1 to C4) by ST. (H) F4_F3 fibroblast distributions in LM (L1 and L2) by ST. (I) Multicolor IHC staining of F4_F3 fibroblasts and tumor cells (CK19). (J) Overall survival of F3high and F3low patients from the GSE39582 dataset.
Fig. 7.
Fig. 7.. Characterization and prognostic effect of F3+ fibroblasts.
(A) Volcano plot showing differentially expressed genes between F2_MCAM and F4_F3. (B) GSVA analysis showing pathways enriched in F2_MCAM and F4_F3 subsets. (C) Violin plots showing expressions of VEGFA, NRG1, HGF, GDF15, AREG, and BMP2 in fibroblasts. (D) Communication network between tumor cells and F4_F3 fibroblasts by CellPhone DB. (E) NRG1 and ERBB3 distributions in C1 sample. (F) NRG1 and ERBB3 distributions in C2 sample. (G) NRG1 and ERBB3 distributions in C3 sample. (H) NRG1 and ERBB3 distributions in C4 sample. (I) Pearson correlation of F3 (x axis) and NRG1 (y axis). (J) Effects of rNRG1 on migration of the RKO cells. The migrated cell number in six different fields was counted in the experiment, and the values were averaged. Three independent experiments were performed. The bars represent means ± SD (***P < 0.001). (K) Overall survival of F3high NRG1high and F3low NRG1low CRC patients from the GSE39582 dataset.
Fig. 8.
Fig. 8.. NOTCH signaling in TME modulates the generation of CD8_CXCL13 cells.
(A) Scatterplots showing correlations of CXCL13, ITGAE, and RBPJ in LM using the GSE50760 dataset. (B) Dot plot showing the expressions of NOTCH1, NOTCH2, NOTCH3, and NOTCH4 in T cell clusters. (C) Dot plot showing the expressions of DLL1, DLL3, DLL4, JAG1, and JAG2 in nonimmune cell clusters. (D) Communication network of the Notch signaling pathway between CD8_CXCL13 cluster and nonimmune cells by CellPhone DB. (E) Percentages of CD8_CXCL13 in F2_MCAM infiltration high and low groups in LM of scRNA-seq data. (F) Infiltration scores of CD8_CXCL13 in F2_MCAM infiltration high and low groups in LM of GSE50760 dataset. (G) Infiltration of F2_MCAM and CD8_CXCL13 subsets in L1 and L2 by ST. (H) Pearson correlation of signature score of CD8_CXCL13 (x axis) and F2_MCAM (y axis) in L1 and L2.
Fig. 9.
Fig. 9.. Cellular ligand and receptor interactions in ST tissues.
(A) Bubble heatmap showing the mean interaction strength between two clusters for ligand-receptor pairs in C1, C3, L1, and L2. Dot size indicated the statistical significances by permutation test. Dot color indicated the mean interaction strength levels. The size factor used here is 10−4. (B) Cross-talk model between the fibroblasts and other cells in CC and LM.

References

    1. H. Sung, J. Ferlay, R. L. Siegel, M. Laversanne, I. Soerjomataram, A. Jemal, F. Bray, Global Cancer Statistics 2020: GLOBOCAN estimates of incidence and mortality worldwide for 36 cancers in 185 countries. CA Cancer J. Clin. 71, 209–249 (2021). - PubMed
    1. R. L. Siegel, K. D. Miller, A. Jemal, Cancer statistics, 2020. CA Cancer J. Clin. 70, 7–30 (2020). - PubMed
    1. S. Manfredi, C. Lepage, C. Hatem, O. Coatmeur, J. Faivre, A.-M. Bouvier, Epidemiology and management of liver metastases from colorectal cancer. Ann. Surg. 244, 254–259 (2006). - PMC - PubMed
    1. C. Hackl, P. Neumann, M. Gerken, M. Loss, M. Klinkhammer-Schalke, H. J. Schlitt, Treatment of colorectal liver metastases in Germany: A ten-year population-based analysis of 5772 cases of primary colorectal adenocarcinoma. BMC Cancer 14, 810 (2014). - PMC - PubMed
    1. D. G. DeNardo, M. Johansson, L. M. Coussens, Immune cells as mediators of solid tumor metastasis. Cancer Metastasis Rev. 27, 11–18 (2008). - PubMed