. 2023 Sep 1;83(17):2824-2838.
doi: 10.1158/0008-5472.CAN-22-3682.

CD36 Drives Metastasis and Relapse in Acute Myeloid Leukemia

Affiliations

CD36 Drives Metastasis and Relapse in Acute Myeloid Leukemia

Thomas Farge et al. Cancer Res. .

Abstract

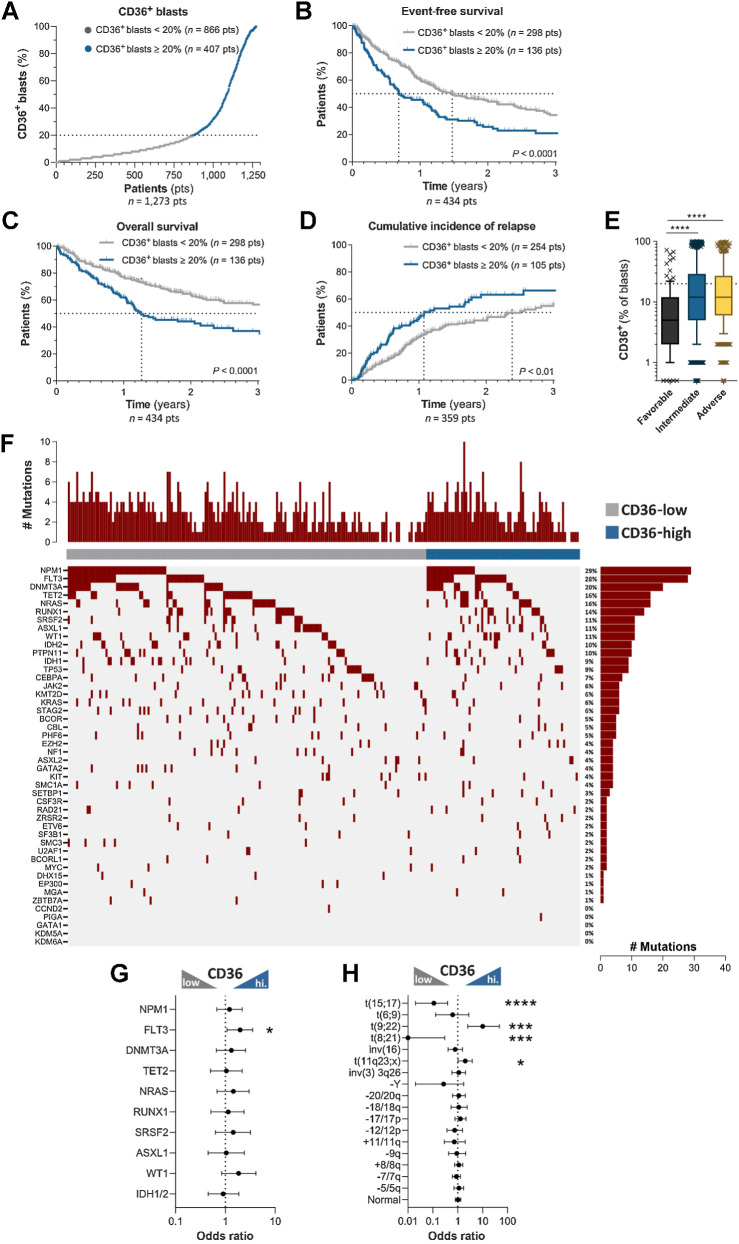
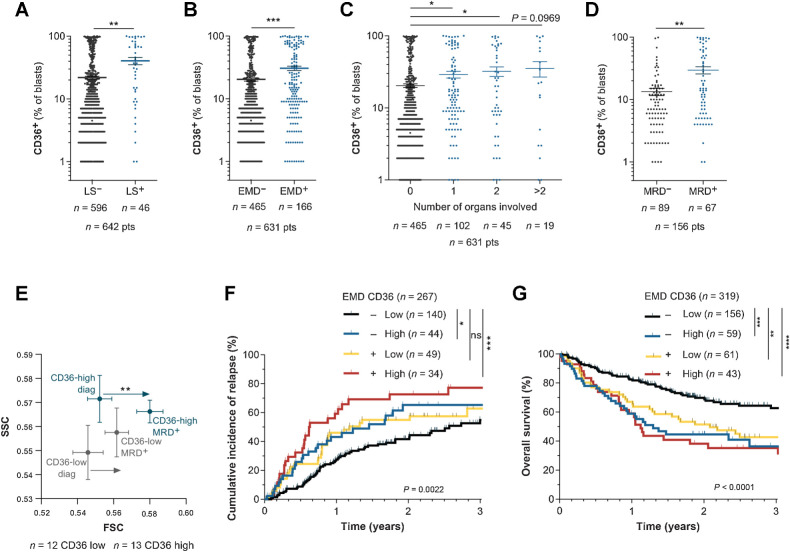
Identifying mechanisms underlying relapse is a major clinical issue for effective cancer treatment. The emerging understanding of the importance of metastasis in hematologic malignancies suggests that it could also play a role in drug resistance and relapse in acute myeloid leukemia (AML). In a cohort of 1,273 AML patients, we uncovered that the multifunctional scavenger receptor CD36 was positively associated with extramedullary dissemination of leukemic blasts, increased risk of relapse after intensive chemotherapy, and reduced event-free and overall survival. CD36 was dispensable for lipid uptake but fostered blast migration through its binding with thrombospondin-1. CD36-expressing blasts, which were largely enriched after chemotherapy, exhibited a senescent-like phenotype while maintaining their migratory ability. In xenograft mouse models, CD36 inhibition reduced metastasis of blasts and prolonged survival of chemotherapy-treated mice. These results pave the way for the development of CD36 as an independent marker of poor prognosis in AML patients and a promising actionable target to improve the outcome of patients.

Significance: CD36 promotes blast migration and extramedullary disease in acute myeloid leukemia and represents a critical target that can be exploited for clinical prognosis and patient treatment.


Figures

Figure 1. CD36 expression in blasts at diagnosis is associated with human AML progression and relapse. A, AML patients from the TUH cohort (1,273 patients) were classified as low and high CD36 expressers (CD36-expressing blasts <20%, low, n = 866 and CD36-expressing blasts ≥20%, high, n = 407). B, Kaplan–Meier curve for event-free survival according to CD36 expression (CD36 low, n = 298; CD36 high, n = 136). C, Kaplan–Meier curve for overall survival according to CD36 expression (CD36 low, n = 298; CD36 high, n = 136). D, Cumulative incidence of relapse according to CD36 expression (CD36 low, n = 254; CD36 high, n = 105). B–D, log-rank test. E, Box plot of CD36 expression on blasts according to cytogenetic risk (n = 1,191). Box plot shows the 10th percentile, first quartile, median, third quartile, and 90th percentile. Mann–Whitney test was performed. F, Landscape of somatic mutations detected in diagnostic samples (n = 224) by sequencing with a panel of 52 genes. The number of mutations for each patient is shown at the top, whereas the frequencies of each mutation are located at the right. G, Forrest plot showing mutation enrichment at AML diagnosis based on blast CD36 level by logarithmic odds ratio. Fisher exact test was performed (P  =  0.029 for FLT3). H, Forrest plot showing enrichment of recurrent cytogenetic anomalies at AML diagnosis according to CD36 expression by logarithmic odds ratio. Fisher exact test was performed (P < 0.0001 for t(15;17); P  =  0.0008 for t(9;22); P = 0.0002 for t(8;21); P = 0.044 for t(11q23;x)). The circles (in the middle of the error bars) represent the odds ratios. The error bars represent 95% confidence interval of the odds ratio. *, P < 0.05; ***, P < 0.001; ****, P < 0.0001.
Figure 1.
CD36 expression in blasts at diagnosis is associated with human AML progression and relapse. A, AML patients from the TUH cohort (1,273 patients) were classified as low and high CD36 expressers (CD36-expressing blasts <20%, low, n = 866 and CD36-expressing blasts ≥20%, high, n = 407). B, Kaplan–Meier curve for event-free survival according to CD36 expression (CD36 low, n = 298; CD36 high, n = 136). C, Kaplan–Meier curve for overall survival according to CD36 expression (CD36 low, n = 298; CD36 high, n = 136). D, Cumulative incidence of relapse according to CD36 expression (CD36 low, n = 254; CD36 high, n = 105). B–D, log-rank test. E, Box plot of CD36 expression on blasts according to cytogenetic risk (n = 1,191). Box plot shows the 10th percentile, first quartile, median, third quartile, and 90th percentile. Mann–Whitney test was performed. F, Landscape of somatic mutations detected in diagnostic samples (n = 224) by sequencing with a panel of 52 genes. The number of mutations for each patient is shown at the top, whereas the frequencies of each mutation are located at the right. G, Forrest plot showing mutation enrichment at AML diagnosis based on blast CD36 level by logarithmic odds ratio. Fisher exact test was performed (P  =  0.029 for FLT3). H, Forrest plot showing enrichment of recurrent cytogenetic anomalies at AML diagnosis according to CD36 expression by logarithmic odds ratio. Fisher exact test was performed (P < 0.0001 for t(15;17); P  =  0.0008 for t(9;22); P = 0.0002 for t(8;21); P = 0.044 for t(11q23;x)). The circles (in the middle of the error bars) represent the odds ratios. The error bars represent 95% confidence interval of the odds ratio. *, P < 0.05; ***, P < 0.001; ****, P < 0.0001.
Figure 2. CD36 inhibition delays AML relapse after chemotherapy. A, Percentage of mice engrafted with U937 cells transduced with shCtrl (n = 11) or shCD36 (n = 11) and treated with vehicle or AraC, surviving over time after treatment. B, Same as A, with OCIAML3 [shCtrl (n = 18) and shCD36 (n = 22)]. C, Percentage of mice engrafted with U937 cells surviving over time after treatment with the indicated combinations of PBS or AraC administered for the first 5 days, with either control IgG or FA6-152 anti-CD36 antibody injected three times/week (n = 7 PBS-IGG; n = 7 PBS-anti-CD36; n = 7 AraC-IGG; n = 6 AraC-anti-CD36). D, Venn diagram of significantly cooverexpressed genes along with CD36 in TCGA, Verhaak, and BeatAML cohorts. E, Gene set enrichment analysis of CD36 gene signature in AraC versus untreated AML blasts from three different transcriptomic analyses. A–C, log-rank (Mantel–Cox) test. E, One sample t test. *, P < 0.05; **, P < 0.01; ***, P < 0.001; ****, P < 0.0001; ns, not significant.
Figure 2.
CD36 inhibition delays AML relapse after chemotherapy. A, Percentage of mice engrafted with U937 cells transduced with shCtrl (n = 11) or shCD36 (n = 11) and treated with vehicle or AraC, surviving over time after treatment. B, Same as A, with OCIAML3 [shCtrl (n = 18) and shCD36 (n = 22)]. C, Percentage of mice engrafted with U937 cells surviving over time after treatment with the indicated combinations of PBS or AraC administered for the first 5 days, with either control IgG or FA6-152 anti-CD36 antibody injected three times/week (n = 7 PBS-IGG; n = 7 PBS-anti-CD36; n = 7 AraC-IGG; n = 6 AraC-anti-CD36). D, Venn diagram of significantly cooverexpressed genes along with CD36 in TCGA, Verhaak, and BeatAML cohorts. E, Gene set enrichment analysis of CD36 gene signature in AraC versus untreated AML blasts from three different transcriptomic analyses. A–C, log-rank (Mantel–Cox) test. E, One sample t test. *, P < 0.05; **, P < 0.01; ***, P < 0.001; ****, P < 0.0001; ns, not significant.
Figure 3. CD36 triggers blast migration. A, GO analysis of migration-related biological processes significantly enriched in the CD36 gene signature. B, Number of migrating shCtrl or shCD36 U937 cells in the lower chamber of the transwell assay (normalized to control; n = 5). C, As in B, but with CD36-blocking antibodies (FA6-152 or JC53.1; n = 4). D, Number of migrating cells in primary AML samples treated or not with CD36 blocking antibody (FA6-152; n = 7). E, Number of migrating shCtrl or shTSP1 U937 cells (normalized to control; n = 3). F, Number of migrating shCtrl or shCD36 U937 cells treated or not with TSP1-blocking antibody (A6.1; normalized to shCtrl; n = 5). G, Number of migrating U937 cells treated or not with recombinant TSP1 in the presence or not of CD36-blocking antibody (FA6-152; normalized to control; n = 3). H, As in D, but with TSP1-blocking antibody (A6.1; n = 5). I, Bioluminescence imaging of mice injected with the indicated AML cell line stably expressing a luciferase reporter from day 1 to day 64 after injection. J, Representative histologic section showing anti-human Ku-80 labeling of U937 AML blasts in the subcutaneous adipose tissue 17 days after xenograft. Positive brown nuclei highlight the infiltration of human blasts in murine adipose tissue either as dense infiltrate (top) or scattered isolated cells (bottom). Top scale bar, 50 μm; bottom, 10 μm. K, Percentage of viable OCIAML3 cells in the indicated tissues 14 days after orthotopic injection in the femur. L, Expression of CD36 [mean fluorescence intensity (MFI)] in viable OCIAML3 cells measured in the injected and contralateral femur and different organs of mice 14 days after orthotopic injection. Values are represented as mean ± SEM. B, C, and E, One sample t test. D and H, Paired t test. F and G, Ordinary one-way ANOVA with Tukey multiple comparisons test. L, Matched one-way ANOVA. *, P < 0.05; **, P < 0.01; ***, P < 0.001; ****, P < 0.0001; ns, not significant.
Figure 3.
CD36 triggers blast migration. A, GO analysis of migration-related biological processes significantly enriched in the CD36 gene signature. B, Number of migrating shCtrl or shCD36 U937 cells in the lower chamber of the transwell assay (normalized to control; n = 5). C, As in B, but with CD36-blocking antibodies (FA6-152 or JC53.1; n = 4). D, Number of migrating cells in primary AML samples treated or not with CD36 blocking antibody (FA6-152; n = 7). E, Number of migrating shCtrl or shTSP1 U937 cells (normalized to control; n = 3). F, Number of migrating shCtrl or shCD36 U937 cells treated or not with TSP1-blocking antibody (A6.1; normalized to shCtrl; n = 5). G, Number of migrating U937 cells treated or not with recombinant TSP1 in the presence or not of CD36-blocking antibody (FA6-152; normalized to control; n = 3). H, As in D, but with TSP1-blocking antibody (A6.1; n = 5). I, Bioluminescence imaging of mice injected with the indicated AML cell line stably expressing a luciferase reporter from day 1 to day 64 after injection. J, Representative histologic section showing anti-human Ku-80 labeling of U937 AML blasts in the subcutaneous adipose tissue 17 days after xenograft. Positive brown nuclei highlight the infiltration of human blasts in murine adipose tissue either as dense infiltrate (top) or scattered isolated cells (bottom). Top scale bar, 50 μm; bottom, 10 μm. K, Percentage of viable OCIAML3 cells in the indicated tissues 14 days after orthotopic injection in the femur. L, Expression of CD36 [mean fluorescence intensity (MFI)] in viable OCIAML3 cells measured in the injected and contralateral femur and different organs of mice 14 days after orthotopic injection. Values are represented as mean ± SEM. B, C, and E, One sample t test. D and H, Paired t test. F and G, Ordinary one-way ANOVA with Tukey multiple comparisons test. L, Matched one-way ANOVA. *, P < 0.05; **, P < 0.01; ***, P < 0.001; ****, P < 0.0001; ns, not significant.
Figure 4. Residual blasts maintained their migratory properties after chemotherapy. A, CD11b, CD14, CD15, and CD44 cell-surface expression in viable control or AraC-treated (2 μmol/L) U937 cells for 96 hours (n = 4). B, Gene set enrichment analysis of “HAY_BONE_MARROW_MONOCYTE” gene signature in AraC versus untreated AML samples from three different transcriptomic analyses. C, Number of migrating cells in the presence or absence of CD36-blocking antibody (FA6-152) sorted from control or 2 μmol/L AraC-treated cells for 4 days (normalized to control; n = 3). D, Percentage of viable CD36-low and CD36-high cells in PBS or 2 μmol/L AraC-treated U937 cells for 4 days (n = 4). E, Representative histograms of CD36 expression in nonmigrating versus migrating CD36-low and CD36-high subpopulations sorted from control or AraC-treated U937 cells (2 μmol/L) for 4 days. Plain histogram, nonmigrating cells; striped histogram, migrating cells. F, Quantification of CD36 expression in nonmigrating versus migrating cells in the same conditions as in E (n = 3). G, Number of migrating cells from CD36-low and CD36-high subpopulations sorted from control or 2 μmol/L AraC-treated U937 cells for 4 days (normalized to Ctrl CD36-low cells; n = 3). H and I, Quantification in the BM (H) and spleen (I) of viable U937 cells transduced with shCtrl (n = 9) or shCD36 (n = 9) in mice relapsing after AraC treatment. J–M, Quantification of U937 cells by RT-qPCR (hCD45 mRNA normalized to m36B4) in SCAT (J), PGAT (K), lung (L), and kidneys (M) in mice relapsing after AraC treatment. Data expressed as 2−ΔCT (values multiplied by 1,000; n = 4–5 shCtrl, n = 5–7 shCD36). Values are represented as mean ± SEM. A, Mann–Whitney or unpaired t test depending on sample distribution. B, Unpaired t test. C and G, Ordinary one-way ANOVA with Tukey multiple comparisons test. F, Ordinary two-way ANOVA with multiple comparisons correction. H–M, Unpaired t test with or without Welch correction depending on sample variance. *, P < 0.05; **, P < 0.01; ***, P < 0.001; ****, P < 0.0001; ns, not significant.
Figure 4.
Residual blasts maintained their migratory properties after chemotherapy. A, CD11b, CD14, CD15, and CD44 cell-surface expression in viable control or AraC-treated (2 μmol/L) U937 cells for 96 hours (n = 4). B, Gene set enrichment analysis of “HAY_BONE_MARROW_MONOCYTE” gene signature in AraC versus untreated AML samples from three different transcriptomic analyses. C, Number of migrating cells in the presence or absence of CD36-blocking antibody (FA6-152) sorted from control or 2 μmol/L AraC-treated cells for 4 days (normalized to control; n = 3). D, Percentage of viable CD36-low and CD36-high cells in PBS or 2 μmol/L AraC-treated U937 cells for 4 days (n = 4). E, Representative histograms of CD36 expression in nonmigrating versus migrating CD36-low and CD36-high subpopulations sorted from control or AraC-treated U937 cells (2 μmol/L) for 4 days. Plain histogram, nonmigrating cells; striped histogram, migrating cells. F, Quantification of CD36 expression in nonmigrating versus migrating cells in the same conditions as in E (n = 3). G, Number of migrating cells from CD36-low and CD36-high subpopulations sorted from control or 2 μmol/L AraC-treated U937 cells for 4 days (normalized to Ctrl CD36-low cells; n = 3). H and I, Quantification in the BM (H) and spleen (I) of viable U937 cells transduced with shCtrl (n = 9) or shCD36 (n = 9) in mice relapsing after AraC treatment. J–M, Quantification of U937 cells by RT-qPCR (hCD45 mRNA normalized to m36B4) in SCAT (J), PGAT (K), lung (L), and kidneys (M) in mice relapsing after AraC treatment. Data expressed as 2−ΔCT (values multiplied by 1,000; n = 4–5 shCtrl, n = 5–7 shCD36). Values are represented as mean ± SEM. A, Mann–Whitney or unpaired t test depending on sample distribution. B, Unpaired t test. C and G, Ordinary one-way ANOVA with Tukey multiple comparisons test. F, Ordinary two-way ANOVA with multiple comparisons correction. H–M, Unpaired t test with or without Welch correction depending on sample variance. *, P < 0.05; **, P < 0.01; ***, P < 0.001; ****, P < 0.0001; ns, not significant.
Figure 5. Senescent-like state induced by cytarabine chemotherapy occurs specifically in CD36-high AML blasts. A and B, FSC/SCC analysis on gated CD36-low and CD36-high cells from U937 treated or not with 2 μmol/L AraC for 4 days (n = 4). C, Representative histogram of C12FDG staining on gated CD36-low and CD36-high cells from U937 treated or not with 2 μmol/L AraC for 4 days. D, Quantification of C12FDG staining performed in C (normalized to control CD36-low cells; n = 4). E, Expression of senescence-associated genes measured by RT-qPCR in CD36-low and CD36-high subpopulations sorted from control or 2 μmol/L AraC-treated U937 cells for 4 days (normalized to Ctrl CD36-low cells). mRNA of the gene of interest normalized to the housekeeping gene; data expressed as 2ΔΔCt (n = 4). F, C12FDG staining on U937 cells treated or not with 2 μmol/L AraC and CD36 blocking antibody (FA6-152) for 4 days. G–M, Expression of senescence-associated genes measured by RT-qPCR in 2 μmol/L AraC-treated U937 cells with or without CD36 blocking antibody (FA6-152) for 4 days (normalized to AraC-treated cells). mRNA of the gene of interest normalized to the housekeeping gene; data expressed as 2ΔΔCt (n = 5). Values are expressed as mean ± SEM. B, Unpaired t test. D, E, and F, Ordinary one-way ANOVA with Tukey multiple comparisons test. G–M, One sample Wilcoxon or t test depending on sample distribution. *, P < 0.05; **, P < 0.01; ***, P < 0.001; ns, not significant.
Figure 5.
Senescent-like state induced by cytarabine chemotherapy occurs specifically in CD36-high AML blasts. A and B, FSC/SCC analysis on gated CD36-low and CD36-high cells from U937 treated or not with 2 μmol/L AraC for 4 days (n = 4). C, Representative histogram of C12FDG staining on gated CD36-low and CD36-high cells from U937 treated or not with 2 μmol/L AraC for 4 days. D, Quantification of C12FDG staining performed in C (normalized to control CD36-low cells; n = 4). E, Expression of senescence-associated genes measured by RT-qPCR in CD36-low and CD36-high subpopulations sorted from control or 2 μmol/L AraC-treated U937 cells for 4 days (normalized to Ctrl CD36-low cells). mRNA of the gene of interest normalized to the housekeeping gene; data expressed as 2ΔΔCt (n = 4). F, C12FDG staining on U937 cells treated or not with 2 μmol/L AraC and CD36 blocking antibody (FA6-152) for 4 days. G–M, Expression of senescence-associated genes measured by RT-qPCR in 2 μmol/L AraC-treated U937 cells with or without CD36 blocking antibody (FA6-152) for 4 days (normalized to AraC-treated cells). mRNA of the gene of interest normalized to the housekeeping gene; data expressed as 2ΔΔCt (n = 5). Values are expressed as mean ± SEM. B, Unpaired t test. D, E, and F, Ordinary one-way ANOVA with Tukey multiple comparisons test. G–M, One sample Wilcoxon or t test depending on sample distribution. *, P < 0.05; **, P < 0.01; ***, P < 0.001; ns, not significant.
Figure 6. Single-cell transcriptomic analysis reveals enrichment of CD36-high, migration, and senescence-like gene signatures in a cluster emerging after standard chemotherapy. A, Schematic representation of the single-cell RNA-seq experiment performed on the TUH07 PDX previously published in Bosc et al. 2021 (GEO accession GSE178910; ref. 42). B, Uniform Manifold Approximation and Projection (UMAP) plot of 31,604 single cells from PDX TUH07 using Seurat. Colors indicate k-means clusters (k  =  9). C, Cluster 8 was isolated on the Seurat object and bifurcated into two groups “CD36-high” and “CD36-low” according to the enrichment level for the CD36 gene signature. Expression levels of gene sets related to senescence (FRIDMAN_SENESCENCE_UP) and migration (WU_CELL_MIGRATION) are shown.
Figure 6.
Single-cell transcriptomic analysis reveals enrichment of CD36-high, migration, and senescence-like gene signatures in a cluster emerging after standard chemotherapy. A, Schematic representation of the single-cell RNA-seq experiment performed on the TUH07 PDX previously published in Bosc et al. 2021 (GEO accession GSE178910; ref. 42). B, Uniform Manifold Approximation and Projection (UMAP) plot of 31,604 single cells from PDX TUH07 using Seurat. Colors indicate k-means clusters (k  =  9). C, Cluster 8 was isolated on the Seurat object and bifurcated into two groups “CD36-high” and “CD36-low” according to the enrichment level for the CD36 gene signature. Expression levels of gene sets related to senescence (FRIDMAN_SENESCENCE_UP) and migration (WU_CELL_MIGRATION) are shown.
Figure 7. CD36 is positively associated with extramedullary disease in AML patients. A, Percentage of CD36+ blasts in the BM of patients with (LS+) or without (LS−) leukocytosis at diagnosis (n = 596 LS−; n = 46 LS+). B, Percentage of CD36+ blasts in the BM of patients presenting (EMD+, n = 166) or not (EMD−, n = 465) clinical signs of EMD at diagnosis. C, Percentage of CD36+ blasts in the BM of patients depending on the number of organs involved in EMD (n = 465 for 0 organs; n = 102 for 1 organ; n = 45 for 2 organs; n = 19 for more than 2 organs). D, Percentage of CD36+ blasts in the BM of patients at diagnosis, exhibiting MRD or not after chemotherapy (n = 89 MRD−; n = 67 MRD+). E, FSC/SCC analysis on blasts from CD36 low (n = 12) and CD36 high (n = 13) patients followed up from diagnosis to MRD. F, Cumulative incidence of relapse in TUH patients according to CD36 expression and presence of EMD at diagnosis (n = 267). G, Overall survival in TUH patients according to CD36 expression and presence of EMD at diagnosis (n = 319). Values are represented as mean ± SEM. A, B, and D, Mann–Whitney test. C, Ordinary one-way ANOVA with Tukey multiple comparisons test. E, Wilcoxon matched-pairs signed rank test. F and G, Log-rank test. *, P < 0.05; **, P < 0.01; ***, P < 0.001; ****, P < 0.0001; ns, not significant.
Figure 7.
CD36 is positively associated with extramedullary disease in AML patients. A, Percentage of CD36+ blasts in the BM of patients with (LS+) or without (LS−) leukocytosis at diagnosis (n = 596 LS−; n = 46 LS+). B, Percentage of CD36+ blasts in the BM of patients presenting (EMD+, n = 166) or not (EMD−, n = 465) clinical signs of EMD at diagnosis. C, Percentage of CD36+ blasts in the BM of patients depending on the number of organs involved in EMD (n = 465 for 0 organs; n = 102 for 1 organ; n = 45 for 2 organs; n = 19 for more than 2 organs). D, Percentage of CD36+ blasts in the BM of patients at diagnosis, exhibiting MRD or not after chemotherapy (n = 89 MRD; n = 67 MRD+). E, FSC/SCC analysis on blasts from CD36 low (n = 12) and CD36 high (n = 13) patients followed up from diagnosis to MRD. F, Cumulative incidence of relapse in TUH patients according to CD36 expression and presence of EMD at diagnosis (n = 267). G, Overall survival in TUH patients according to CD36 expression and presence of EMD at diagnosis (n = 319). Values are represented as mean ± SEM. A, B, and D, Mann–Whitney test. C, Ordinary one-way ANOVA with Tukey multiple comparisons test. E, Wilcoxon matched-pairs signed rank test. F and G, Log-rank test. *, P < 0.05; **, P < 0.01; ***, P < 0.001; ****, P < 0.0001; ns, not significant.

References

    1. Dohner H, Estey E, Grimwade D, Amadori S, Appelbaum FR, Buchner T, et al. . Diagnosis and management of AML in adults: 2017 ELN recommendations from an international expert panel. Blood 2017;129:424–47. - PMC - PubMed
    1. Short NJ, Konopleva M, Kadia TM, Borthakur G, Ravandi F, DiNardo CD, et al. . Advances in the treatment of acute myeloid leukemia: new drugs and new challenges. Cancer Discov 2020;10:506–25. - PubMed
    1. Farge T, Saland E, de Toni F, Aroua N, Hosseini M, Perry R, et al. . Chemotherapy-resistant human acute myeloid leukemia cells are not enriched for leukemic stem cells but require oxidative metabolism. Cancer Discov 2017;7:716–35. - PMC - PubMed
    1. Boyd AL, Aslostovar L, Reid J, Ye W, Tanasijevic B, Porras DP, et al. . Identification of chemotherapy-induced leukemic-regenerating cells reveals a transient vulnerability of human AML recurrence. Cancer Cell 2018;34:483–98. - PubMed
    1. van Gastel N, Spinelli JB, Sharda A, Schajnovitz A, Baryawno N, Rhee C, et al. . Induction of a timed metabolic collapse to overcome cancer chemoresistance. Cell Metab 2020;32:391–403. - PMC - PubMed

Publication types