. 2023 Jul 10;41(7):1363-1380.e7.
doi: 10.1016/j.ccell.2023.05.015. Epub 2023 Jun 15.

MCT4-dependent lactate secretion suppresses antitumor immunity in LKB1-deficient lung adenocarcinoma

Affiliations

MCT4-dependent lactate secretion suppresses antitumor immunity in LKB1-deficient lung adenocarcinoma

Yu Qian et al. Cancer Cell. .

Abstract

Inactivating STK11/LKB1 mutations are genomic drivers of primary resistance to immunotherapy in KRAS-mutated lung adenocarcinoma (LUAD), although the underlying mechanisms remain unelucidated. We find that LKB1 loss results in enhanced lactate production and secretion via the MCT4 transporter. Single-cell RNA profiling of murine models indicates that LKB1-deficient tumors have increased M2 macrophage polarization and hypofunctional T cells, effects that could be recapitulated by the addition of exogenous lactate and abrogated by MCT4 knockdown or therapeutic blockade of the lactate receptor GPR81 expressed on immune cells. Furthermore, MCT4 knockout reverses the resistance to PD-1 blockade induced by LKB1 loss in syngeneic murine models. Finally, tumors from STK11/LKB1 mutant LUAD patients demonstrate a similar phenotype of enhanced M2-macrophages polarization and hypofunctional T cells. These data provide evidence that lactate suppresses antitumor immunity and therapeutic targeting of this pathway is a promising strategy to reversing immunotherapy resistance in STK11/LKB1 mutant LUAD.

Keywords: LKB1; MCT4; PD-1; T cell activation; immunotherapy resistance; lactate; lung adenocarcinoma; macrophage polarization; metabolism.


Conflict of interest statement

Declaration of interests F.S. has held stock ownership in BioNTech SE and Moderna Inc; has received honoraria from Bristol Myers Squibb and RV Mais Promocao Eventos LTDS; has received institutional research funding from Amgen, Mirati Therapeutics, Boehringer Ingelheim, Merck & Co, Novartis, and Pfizer; has an immediate family member who has received research funding from AImmune Therapeutics; and has been reimbursed for travel, accommodations, or other expenses by Tango Therapeutics, Amgen, and AstraZeneca Pharmaceuticals. T.M. is a consultant for Immunos Therapeutics, Daiichi Sankyo Co and Pfizer; is a cofounder of and equity holder in IMVAQ Therapeutics; receives research funding from Bristol-Myers Squibb, Surface Oncology, Kyn Therapeutics, Infinity Pharmaceuticals, Peregrine Pharmaceuticals, Adaptive Biotechnologies, Leap Therapeutics, and Aprea Therapeutics; is an inventor on patent applications related to work on oncolytic viral therapy, alpha virus–based vaccine, neo antigen modeling, CD40, GITR, OX40, PD-1, and CTLA-4. J.D.W. is a consultant for Apricity, Ascentage Pharma, Arsenal IO, Astellas, AstraZeneca, Bicara Therapeutics, Boehringer Ingelheim, Bristol Myers Squibb, Chugai, Daiichi Sankyo, Dragonfly, Georgiamune, Idera, Imvaq, Kyowa Hakko Kirin, Maverick Therapeutics, Psioxus, Recepta, Tizona, Trieza, Trishula, Sellas, Surface Oncology, Werewolf Therapeutics; receives Grant/Research Support from Bristol Myers Squibb, Sephora; has Equity in Tizona Pharmaceuticals, Imvaq, Beigene, Linneaus, Apricity, Arsenal IO, Georgiamune, Trieza, Maverick, Ascentage. K.K.W. is a founder and equity holder of G1 Therapeutics; has sponsored Research Agreements with MedImmune, Takeda, TargImmune, Mirati, Merus, Alkermes and BMS; has consulting & sponsored research agreements with AstraZeneca, Janssen, Pfizer, Novartis, Merck, Ono, Array. R. J. D. is a member of the Scientific Advisory Board for Agios Pharmaceuticals and Vida Ventures. J.D.M receives licensing fees from the NCI and UT Southwestern to distribute cell lines. N.I.V. receives consulting fees from Sanofi, Regeneron, Oncocyte, and Eli Lilly, and research funding from Mirati. J.F.G. has served as a compensated consultant or received honoraria from Bristol-Myers Squibb, Genentech/Roche, Takeda, Loxo/Lilly, Blueprint Medicine, Gilead, Moderna, AstraZeneca, Curie Therapeutics, Mirati, Merus Pharmacueticals, Nuvalent, Pfizer, Novartis, Merck, iTeos, Karyopharm, and Silverback Therapeutics; research support from Novartis, Genentech/Roche, and Takeda; institutional research support from Bristol-Myers Squibb, Tesaro, Moderna, Blueprint, Jounce, Array Biopharma, Merck, Adaptimmune, Novartis, and Alexo; equity in AI Proteins, and has an immediate family member who is an employee with equity at Ironwood Pharmaceuticals. A.R. receives honoraria from Adaptive Biotechnologies; is a member of advisory board for Adaptive Biotechnologies. J.V.H. is a member of advisory committees of AstraZeneca, EMD Serono, Boehringer-Ingelheim, Catalyst, Genentech, GlaxoSmithKline, Guardant Health, Foundation medicine, Hengrui Therapeutics, Eli Lilly, Novartis, Spectrum, Sanofi, Takeda, Mirati Therapeutics, BMS, BrightPath Biotherapeutics, Janssen Global Services, Nexus Health Systems, Pneuma Respiratory, Kairos Venture Investments, Roche, Leads Biolabs, RefleXion, Chugai Pharmaceuticals; has research support from AstraZeneca, GlaxoSmithKline, Spectrum; has royalties and licensing fees from Spectrum. The other authors declare no competing interests.

Figures

Figure 1.
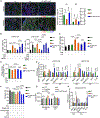
Figure 1.. LKB1-deficiency induces metabolic alteration, increases glycolysis, lactate export, and MCT4 expression
(A) ECAR analysis of A549 con (LKB1-deficient) or LKB1 re-expression (LKB1-proficient) cells. Cells were detected at basal level, followed by adding glucose (10mM), oligomycin (Oligo, 1.5μM), and 2-DG (50mM). (n = 4). (B) OCR analysis of A549 con and LKB1 cells. (n = 3). (C) Extracellular lactate level of LKB1-proficient and deficient cell lines. (n = 6). (D) Extracellular lactate level of H441 (LKB1-proficient) with or without LKB1 knockdown cells (n = 3). (E) Intracellular pH level of LKB1-proficient and deficient cells. (n = 3). (F) MCT4 expression was detected by Western blot in H460, H23, and H2030 cells with or without LKB1 overexpression. Numbers were the relative quantification of MCT4 bands and normalized to housekeeping gene. (G) LKB1 kinase dead protein (LKB1 K78I, labeled as KD) was overexpressed in A549 and H460 cells. MCT4 expression was detected by Western blot. Numbers were the relative quantification of MCT4 bands and normalized to housekeeping gene. (H) MCT4 expression in LKR10 and LKR13 K/KL cells. (I) Cell surface staining of MCT4 was detected by flow cytometry in cells with or without LKB1. (n = 3). (J) Immunofluorescence staining of MCT4 in K and KL GEMM models. Bar, 100μm. (n = 3). All quantitative data are represented as Mean ± SD; all statistical analysis (p values) are Student’s t test. See also Figure S1.
Figure 2.
Figure 2.. MCT4 knockout impairs lactate export and cell viability in LKB1 deficient cells
(A and B) Upper panel: Western blot confirms the MCT4 KO in K and KL cells in LKR10 cells (A) and LKR13 (B) models. Lower panel: statistical analysis of colony formation assay of K and KL cells with or without MCT4 KO. Representative data of triplicate experiments (n = 3). (C) Extracellular lactate level of cells with MCT4 KO. Representative data of triplicate experiments (n = 3). (D) Intracellular pH was detected by pHrodo Red, and representative images were shown in K and KL cells with MCT4 KO. Bar, 100μm. (n = 3). (E) Intracellular pH was detected by flow cytometry. (n = 3–5). (F) ECAR and OCR analysis of K and KL cells with MCT4 KO in LKR13 model. (n = 6). All quantitative data are represented as Mean ± SD; all statistical analysis are Student’s t test. See also Figure S2.
Figure 3.
Figure 3.. MCT4 knock-out abrogates M2 polarization induced in LKB1 deficient tumors
(A) UMAP plot of macrophage populations in K, KL, and KL MCT4-KO tumors highlighting M2-score and M1-scores. (B) Dot plot of M2- and M1-scores in macrophages from three types of tumors. (C) UMAP plot of macrophage clusters. (D) The proportion of each macrophage sub-cluster from three types of tumors. (E) M2-high cluster (c0, c4), M1-high cluster (c3, c4, c5), and the ratio. (F) The presence of M2 macrophages (F4/80+ARG1+) and M1 macrophages (F4/80+iNOS+) was detected by immunofluorescence in K, KL, and KL MCT4-KO tumors (LKR13 model). Bar, 50μm. (n = 3–5). All quantitative data are represented as Mean ± SD; all statistical analysis are Student’s t test. See also Figure S3 and Table S1.
Figure 4.
Figure 4.. Targeting lactate secretion by MCT4 knockout decreases M2 macrophage polarization in LKB1 deficient tumor cells
(A)In vivo chemoattraction assay was performed using conditioned medium (CM) from K, KL, and KL MCT4-KO cells. Frozen slides were stained with M1, M2 markers, and representative images were shown. Bar, 50μm. (n = 4). (B) CD206+ M2-like cells were detected by flow cytometry after co-culturing Raw264.7 cells with CM from K, KL, and KL MCT4-KO tumor cells. Additional treatments were added as indicated. Oba, 3-hydroxy-butyrate (8mM); Lac, lactate (10mM); NaLac, sodium lactate (10mM); NaPy, sodium pyruvate (10mM). (n = 4–6). (C) Cell migration assay of Raw264.7 cells co-cultured with CM and additional treatments. (n = 3–4). (D) Phagocytosis analysis of Raw264.7 cells treated with CM from K, KL, and KL MCT4-KO tumor cells. Additional treatments were added as indicated. (n = 4). (E) Representative markers of macrophage polarization were determined by qRT-PCR. (n = 4). (F) Raw264.7 cells were treated with CM and then co-cultured with OT-I T cells and SIINFEKL-expressing cells. Cell lysis was measured. (n = 4–5). (G) CM from K, KL, and KL MCT4-KO tumor cells either boiled to denature the bioactive protein or dialyzed by centrifuging to remove the metabolites. Raw264.7 cells were treated with denatured CM or filtered CM (>3KD CM). CD206 expression was detected by flow cytometry. Lactate (10mM) and TGF-β (20 ng/ml) were used as positive controls. (n = 3). (H) M2 and M1 markers were detected in Raw264.7 cells treated with denatured CM. (n = 4). All quantitative data are represented as Mean ± SD; all statistical analysis are Student’s t test. See also Figure S4.
Figure 5.
Figure 5.. MCT4 knockout restores LKB1 deficiency induced CD8+ T cell dysfunction
(A) CD8+ T cells were isolated from OT-I mice and co-cultured with conditioned medium (CM) from K, KL, and KL MCT4-KO tumor cells, and performed targeted cell killing using LKR13K-SIINFEKL overexpressing cells. Cell apoptosis was monitored using Incucyte system. (n = 12). (B) OT-I T cells were pre-treated with CM from K, KL, and KL MCT4-KO tumor cells, and then co-cultured with target cells for 6 h. T cells were collected and IFN-γ production was detected by flow cytometry (left). The statistical analysis of the IFN-γ+ T cells according to the flow cytometry (right). (n = 4). (C) OT-I T cells were co-cultured with indicated CM and additional treatments and targeted cell killing was performed. Hydrogen chloride was used as a low pH control. (n = 5). (D) T cells were treated with denatured CM or filtered CM (>3KD CM) as in Figure 4G. Targeted cell killing was measured. (n = 6). (E) ECAR analysis of OT-I T cells co-cultured with indicated CM and additional treatments. (n = 4). (F) Ingenuity Pathway Analysis (IPA) of differential expressed genes in CD8+ T cells comparing KL with K tumors, or KL MCT4-KO with KL tumors, respectively, based on scRNA-seq data. (G) The proportion of hypofunctional T cells in three types of tumors. (H) Immune checkpoint markers and co-stimulator co-expression in the CD8+ T cells from three types of tumors. All quantitative data are represented as Mean ± SD; all statistical analysis are Student’s t test. See also Figure S5 and Table S2.
Figure 6.
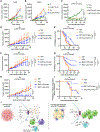
Figure 6.. MCT4 knockout impairs tumor growth and enhances immunotherapy response in LKB1 deficient tumors
(A and B) LKR13K and LKR13KL cells with or without MCT4 KO were injected in immunodeficient mice (nude, A), and immunocompetent mice (129SV, B). Tumor growth was monitored. (n = 6–7). (C) Syngeneic model was performed by subcutaneously injecting LKR13K cells with or without MCT4 expression into the flank of 129SV mice. Once tumors reached 150–250 mm, animals were randomized to receive anti-PD-1 or IgG control. Tumor growth was monitored. (n = 6–10). (D) Tumor growth of LKR13KL with or without MCT4 KO tumors treated with IgG or anti-PD1. (n = 16–18). (E) Kaplan-Meier curve of LKR13KL with or without MCT4 KO treated with IgG or anti-PD1. (n = 16–18). (F and G) Tumor growth (F) and survival analysis (G) from LKR10KL model. (n = 16–18). (H and I) Tumor growth (H) and tumor progression (cutoff tumor volume > 1000mm, I) of 344sq LKB1 KO cells with or without MCT4 KO and treated with IgG or anti-PD1. (n = 10). (J) Schematic of MCT4 impact on regulating TME. All quantitative data are represented as Mean ± SD; Student’s t test used for comparing groups at the last time point, A, B, C, D, F, H; Log rank test, E, G, I. See also Figure S6.
Figure 7.
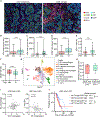
Figure 7.. LKB1 loss is associated with reduced T cells tumor infiltration and M2 polarization in LUAD patients
(A) Representative image of multiplex IHC (mIHC) in LKB1-deficient (mutant/loss) and wild-type (WT) LUAD tumors from MDACC ICON dataset. Bar, 100μm. (B–D) The presence of CD3+ (B) and CD8+ (C) and CD68+ (D) cells in LKB1-deficient and WT NSCLC tissues. (E) CIBERSORT analysis was performed in PROSPECT cohort to estimate the immune cell infiltration. The abundance of CD8+ T cells in LKB1-deficient and WT tumors was shown. (F) M2 macrophage ratio was compared in LKB1-deficient and WT tumors based on CIBERSORT analysis. (G) The UMAP plot of the myeloid cell population clusters in Massachusetts General Hospital (MGH)’s patient cohort. (H) The ratio of M2 macrophages in all macrophage populations according to the mutation status. (I) The correlation between M2 macrophage infiltration, CD8+ T cell infiltration and MCT4 expression in LKB1-mutant LUAD TCGA cohort. (J) The patients from LKB1-mutant LUAD TCGA cohort were sub-grouped by MCT4 expression and CD8+ T infiltration. The Kaplan-Meier curves were shown. Data are represented as boxplot (B, C, D, E, F, H, top line, third quartile, middle line, median, bottom line, first quartile, whiskers, minimum and maximum data points). Mann-Whitney test, B, C, D, E, F; Pearson correlation coefficient, I; Log rank test, J. See also Figure S7.

References

    1. Cancer Genome Atlas Research Network (2014). Comprehensive molecular profiling of lung adenocarcinoma. Nature 511, 543–550. 10.1038/nature13385. - DOI - PMC - PubMed
    1. Ji H, Ramsey MR, Hayes DN, Fan C, McNamara K, Kozlowski P, Torrice C, Wu MC, Shimamura T, Perera SA, et al. (2007). LKB1 modulates lung cancer differentiation and metastasis. Nature 448, 807–810. 10.1038/nature06030. - DOI - PubMed
    1. Gillette MA, Satpathy S, Cao S, Dhanasekaran SM, Vasaikar SV, Krug K, Petralia F, Li Y, Liang WW, Reva B, et al. (2020). Proteogenomic characterization reveals therapeutic vulnerabilities in lung adenocarcinoma. Cell 182, 200–225.e35. 10.1016/j.cell.2020.06.013. - DOI - PMC - PubMed
    1. Gill RK, Yang SH, Meerzaman D, Mechanic LE, Bowman ED, Jeon HS, Roy Chowdhuri S, Shakoori A, Dracheva T, Hong KM, et al. (2011). Frequent homozygous deletion of the LKB1/STK11 gene in non-small cell lung cancer. Oncogene 30, 3784–3791. 10.1038/onc.2011.98. - DOI - PMC - PubMed
    1. Calles A, Sholl LM, Rodig SJ, Pelton AK, Hornick JL, Butaney M, Lydon C, Dahlberg SE, Oxnard GR, Jackman DM, and Jänne PA (2015). Immunohistochemical loss of LKB1 is a biomarker for more aggressive biology in KRAS-mutant lung adenocarcinoma. Clin. Cancer Res. 21, 2851–2860. 10.1158/1078-0432.CCR-14-3112. - DOI - PubMed

Publication types