. 2023 Jul 10;41(7):1207-1221.e12.
doi: 10.1016/j.ccell.2023.05.014. Epub 2023 Jun 15.

The CD58-CD2 axis is co-regulated with PD-L1 via CMTM6 and shapes anti-tumor immunity

Affiliations

The CD58-CD2 axis is co-regulated with PD-L1 via CMTM6 and shapes anti-tumor immunity

Patricia Ho et al. Cancer Cell. .

Abstract

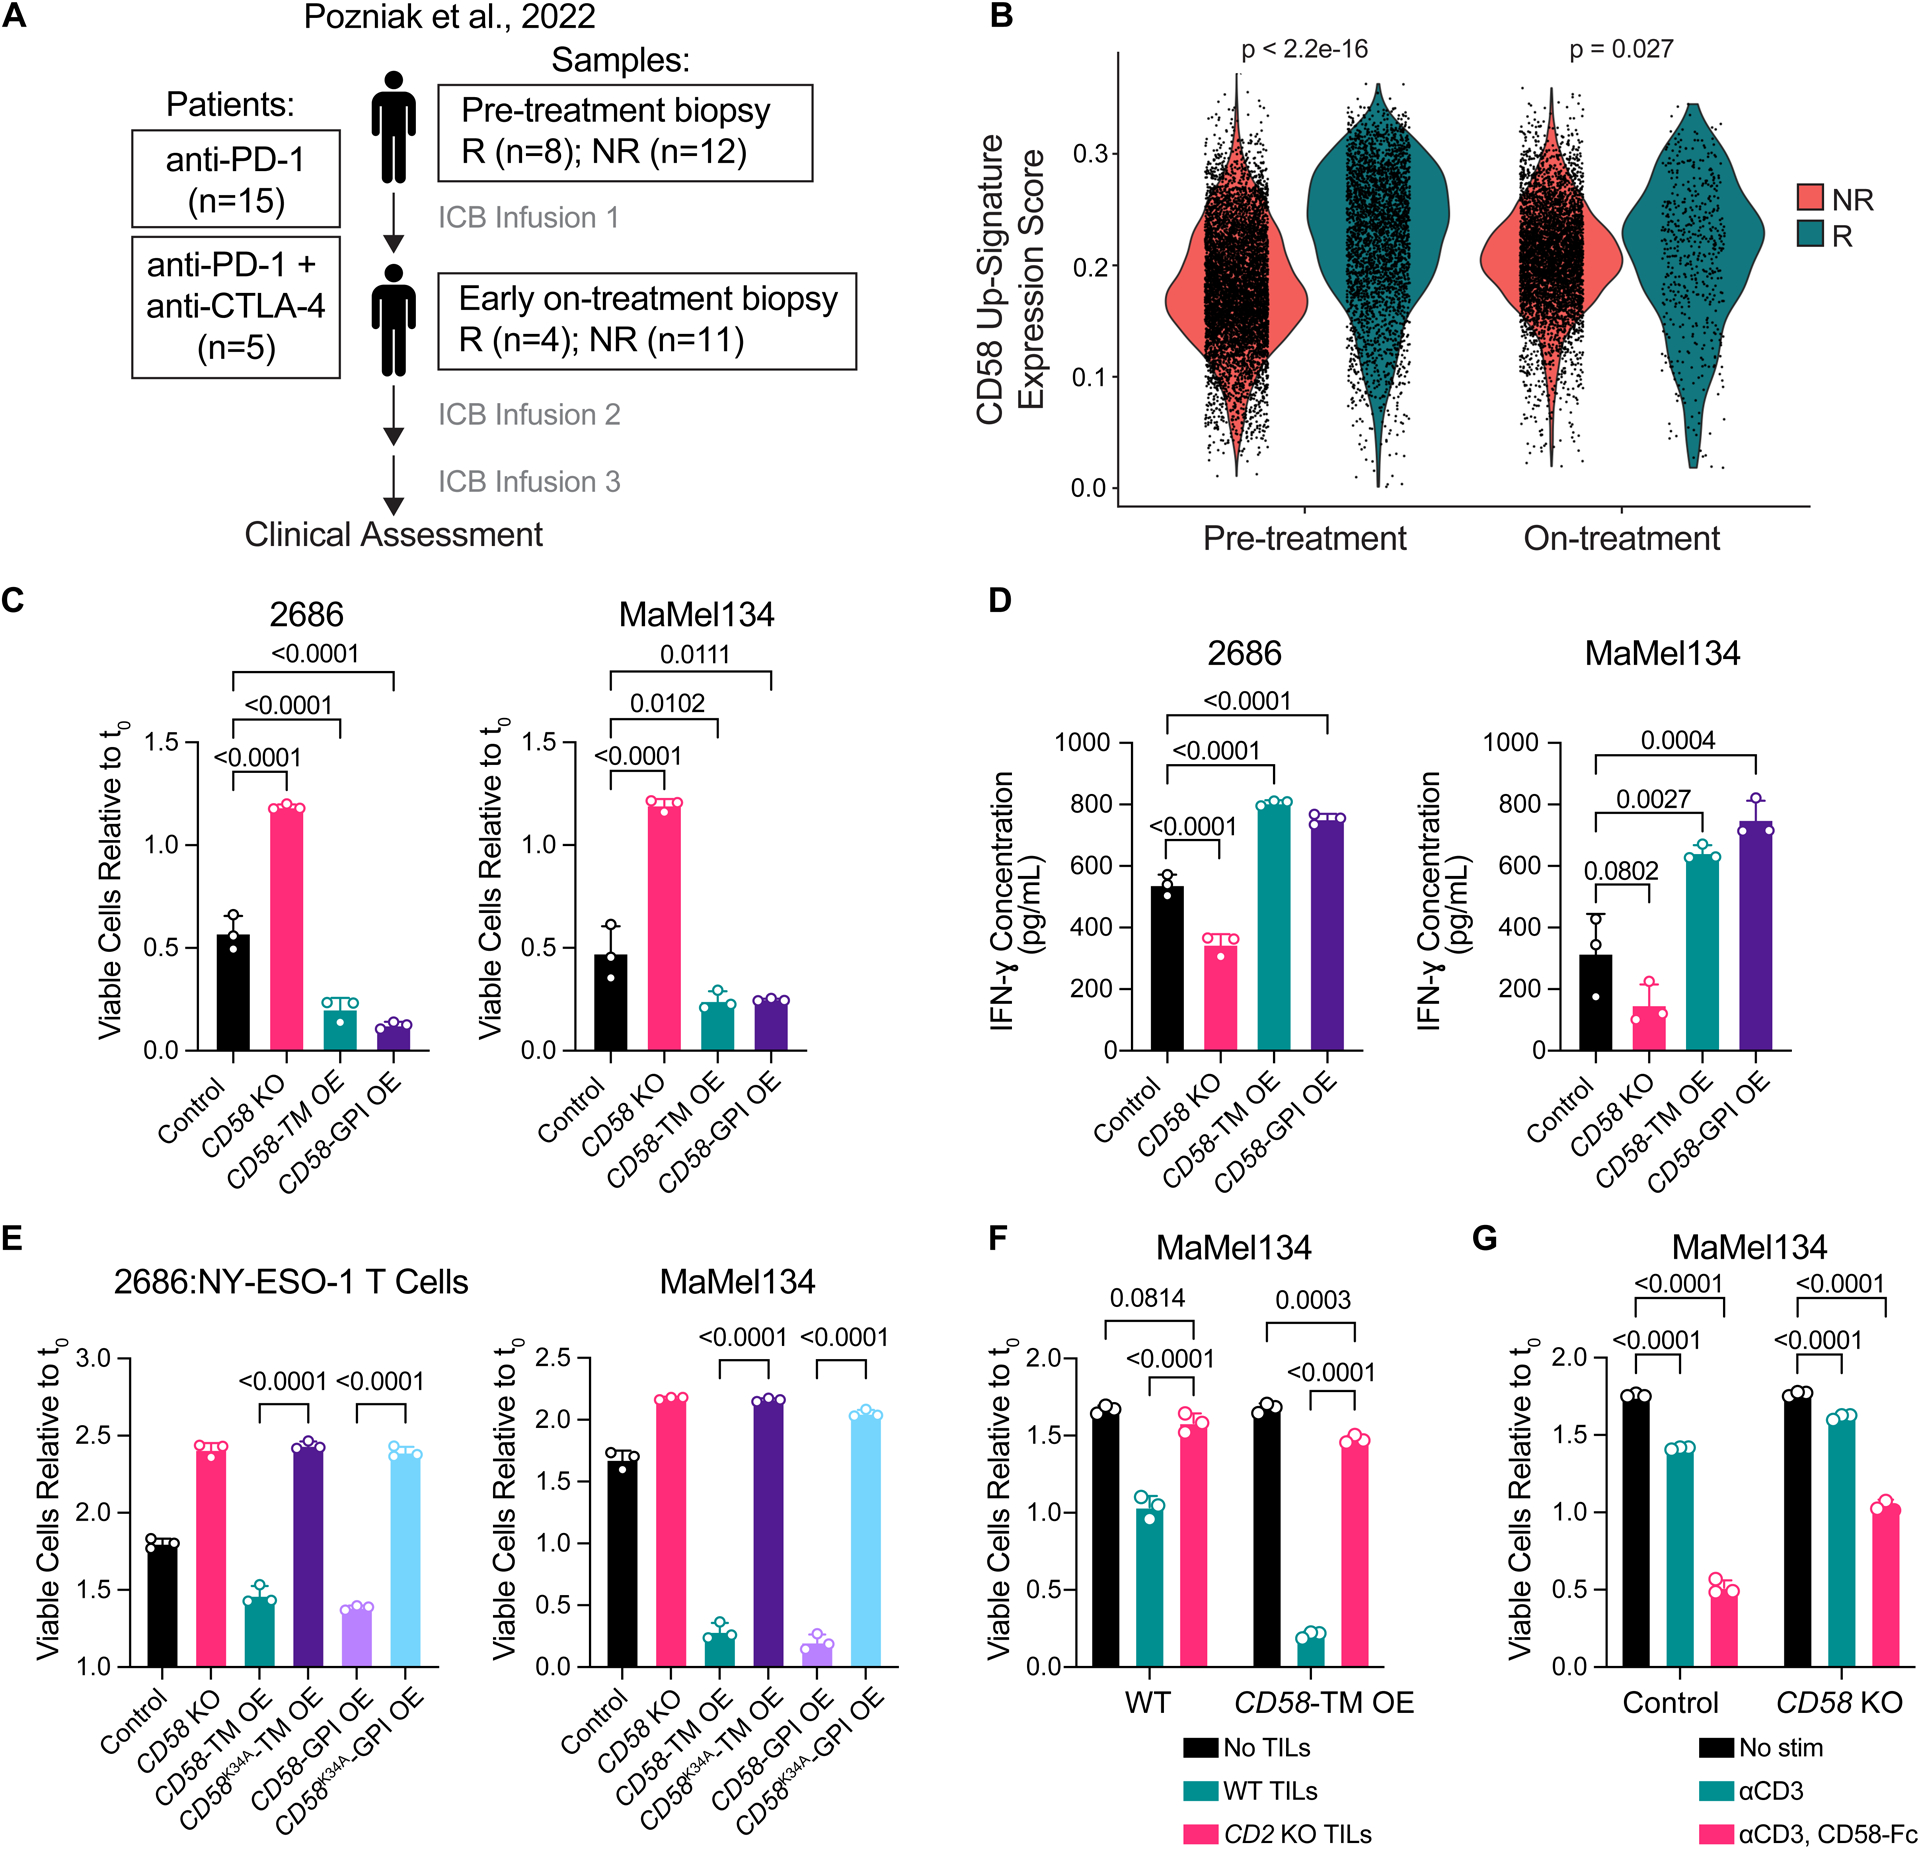
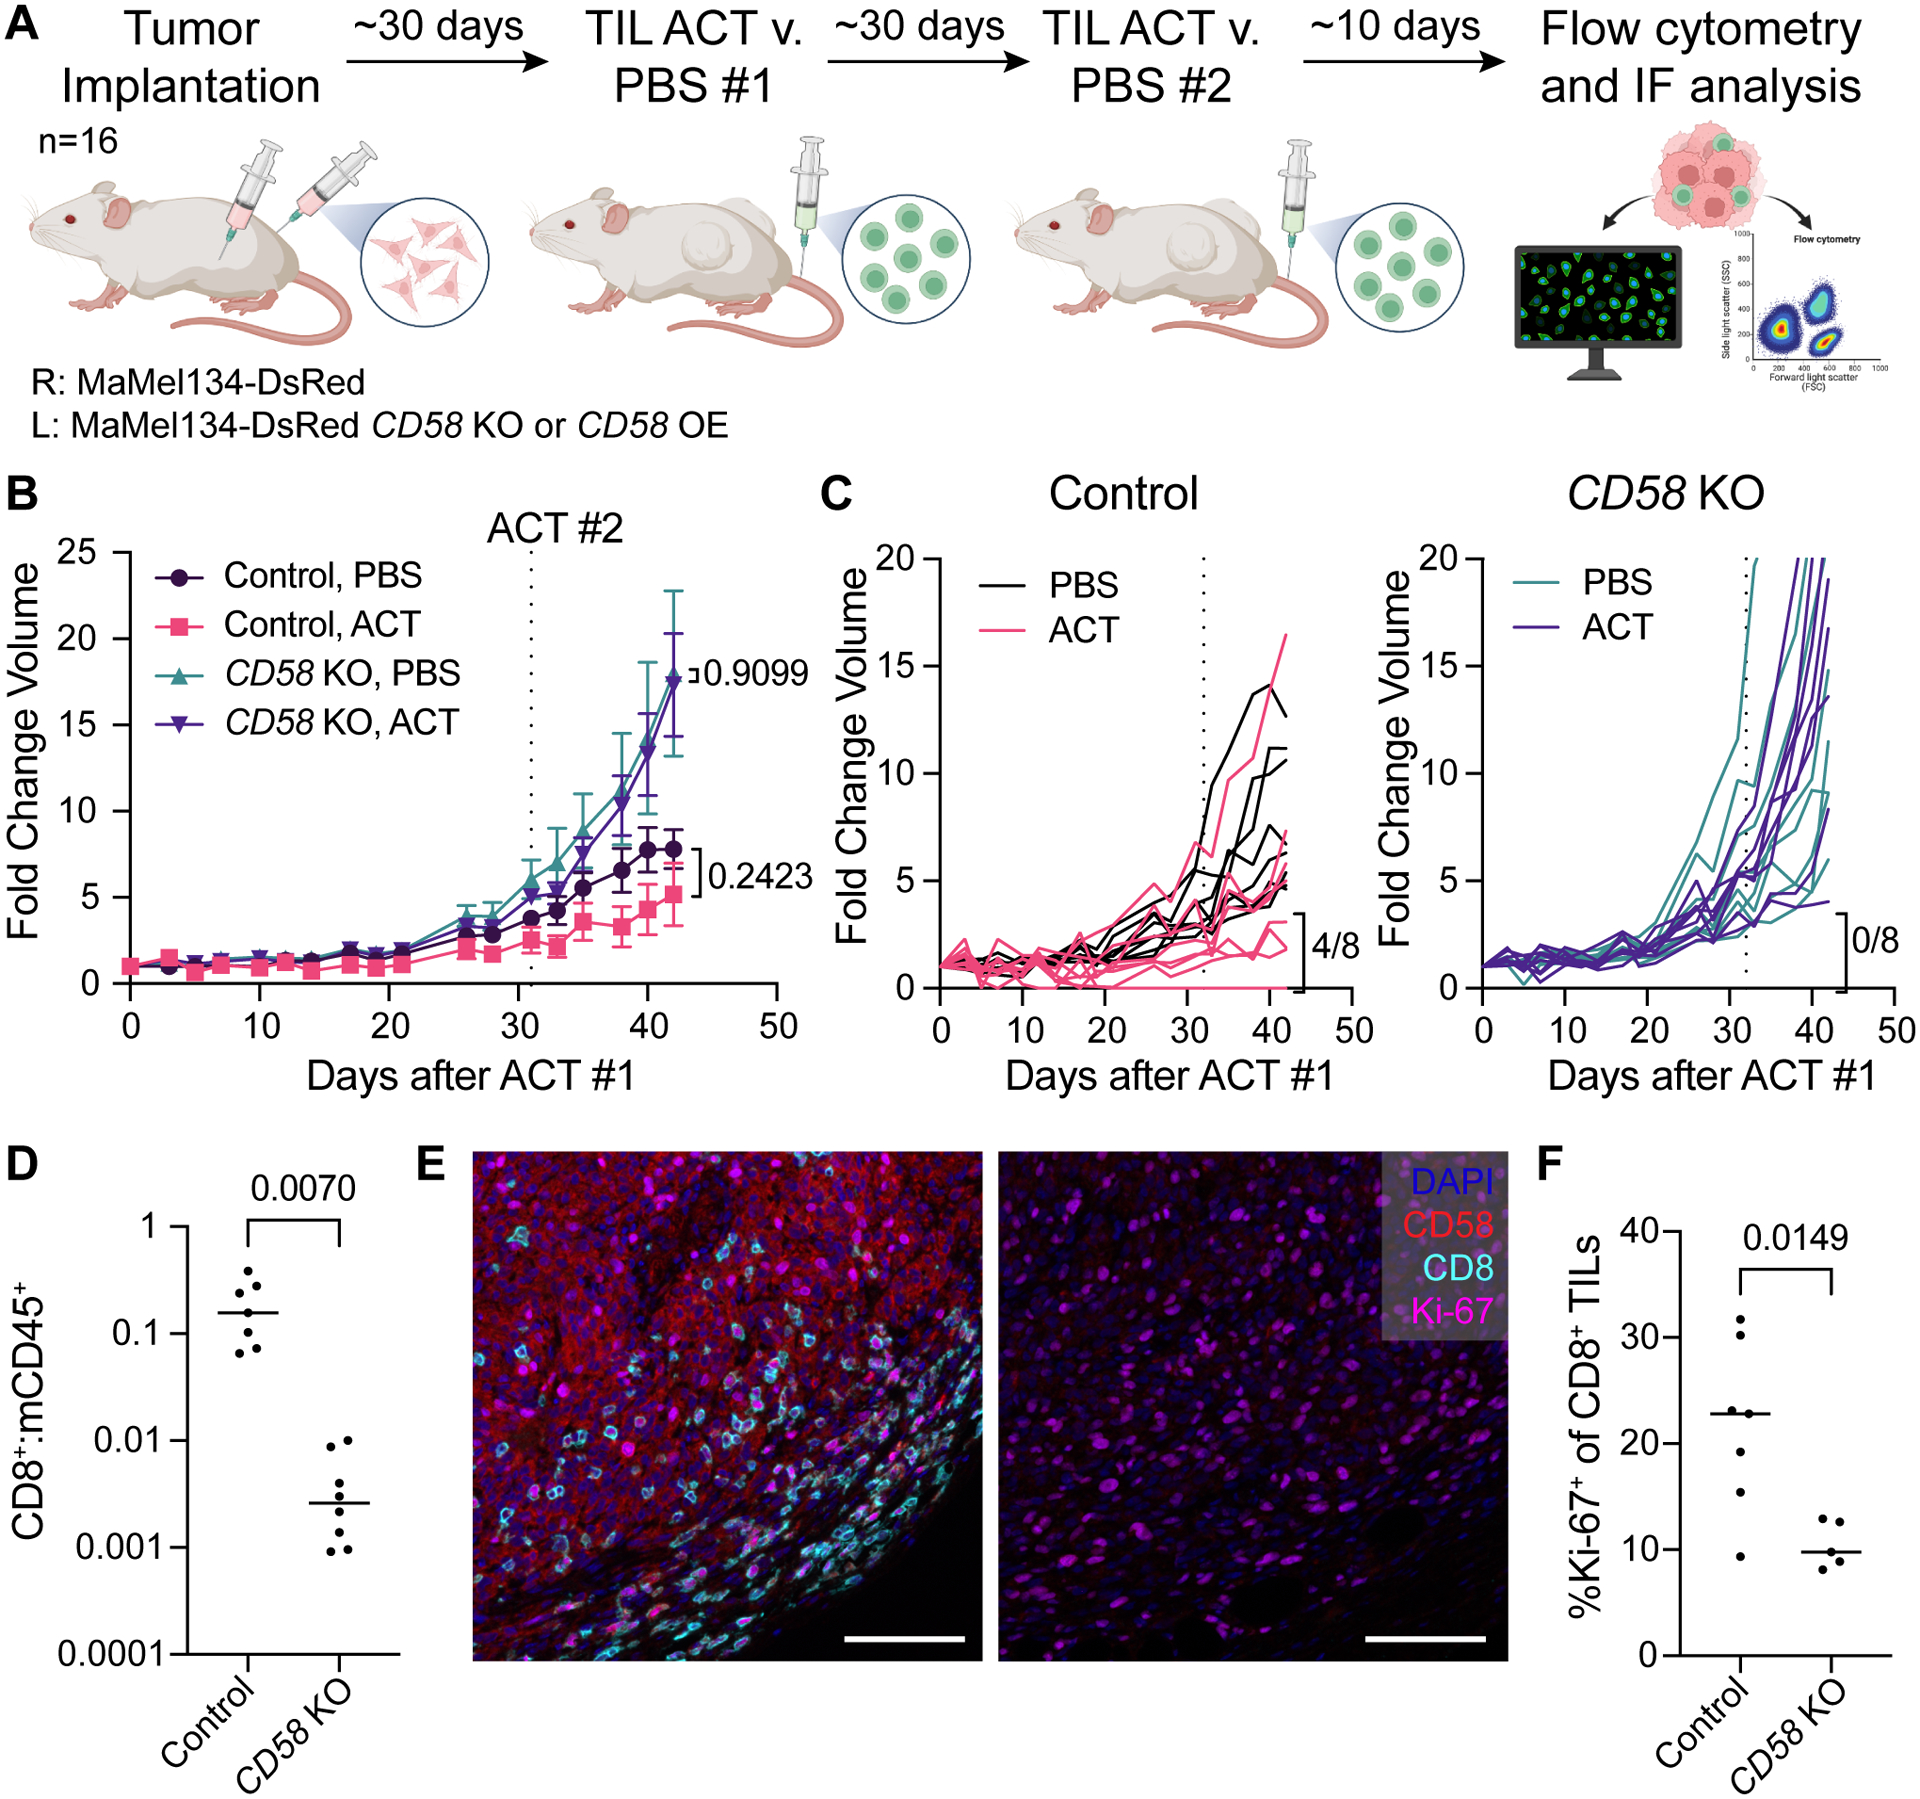
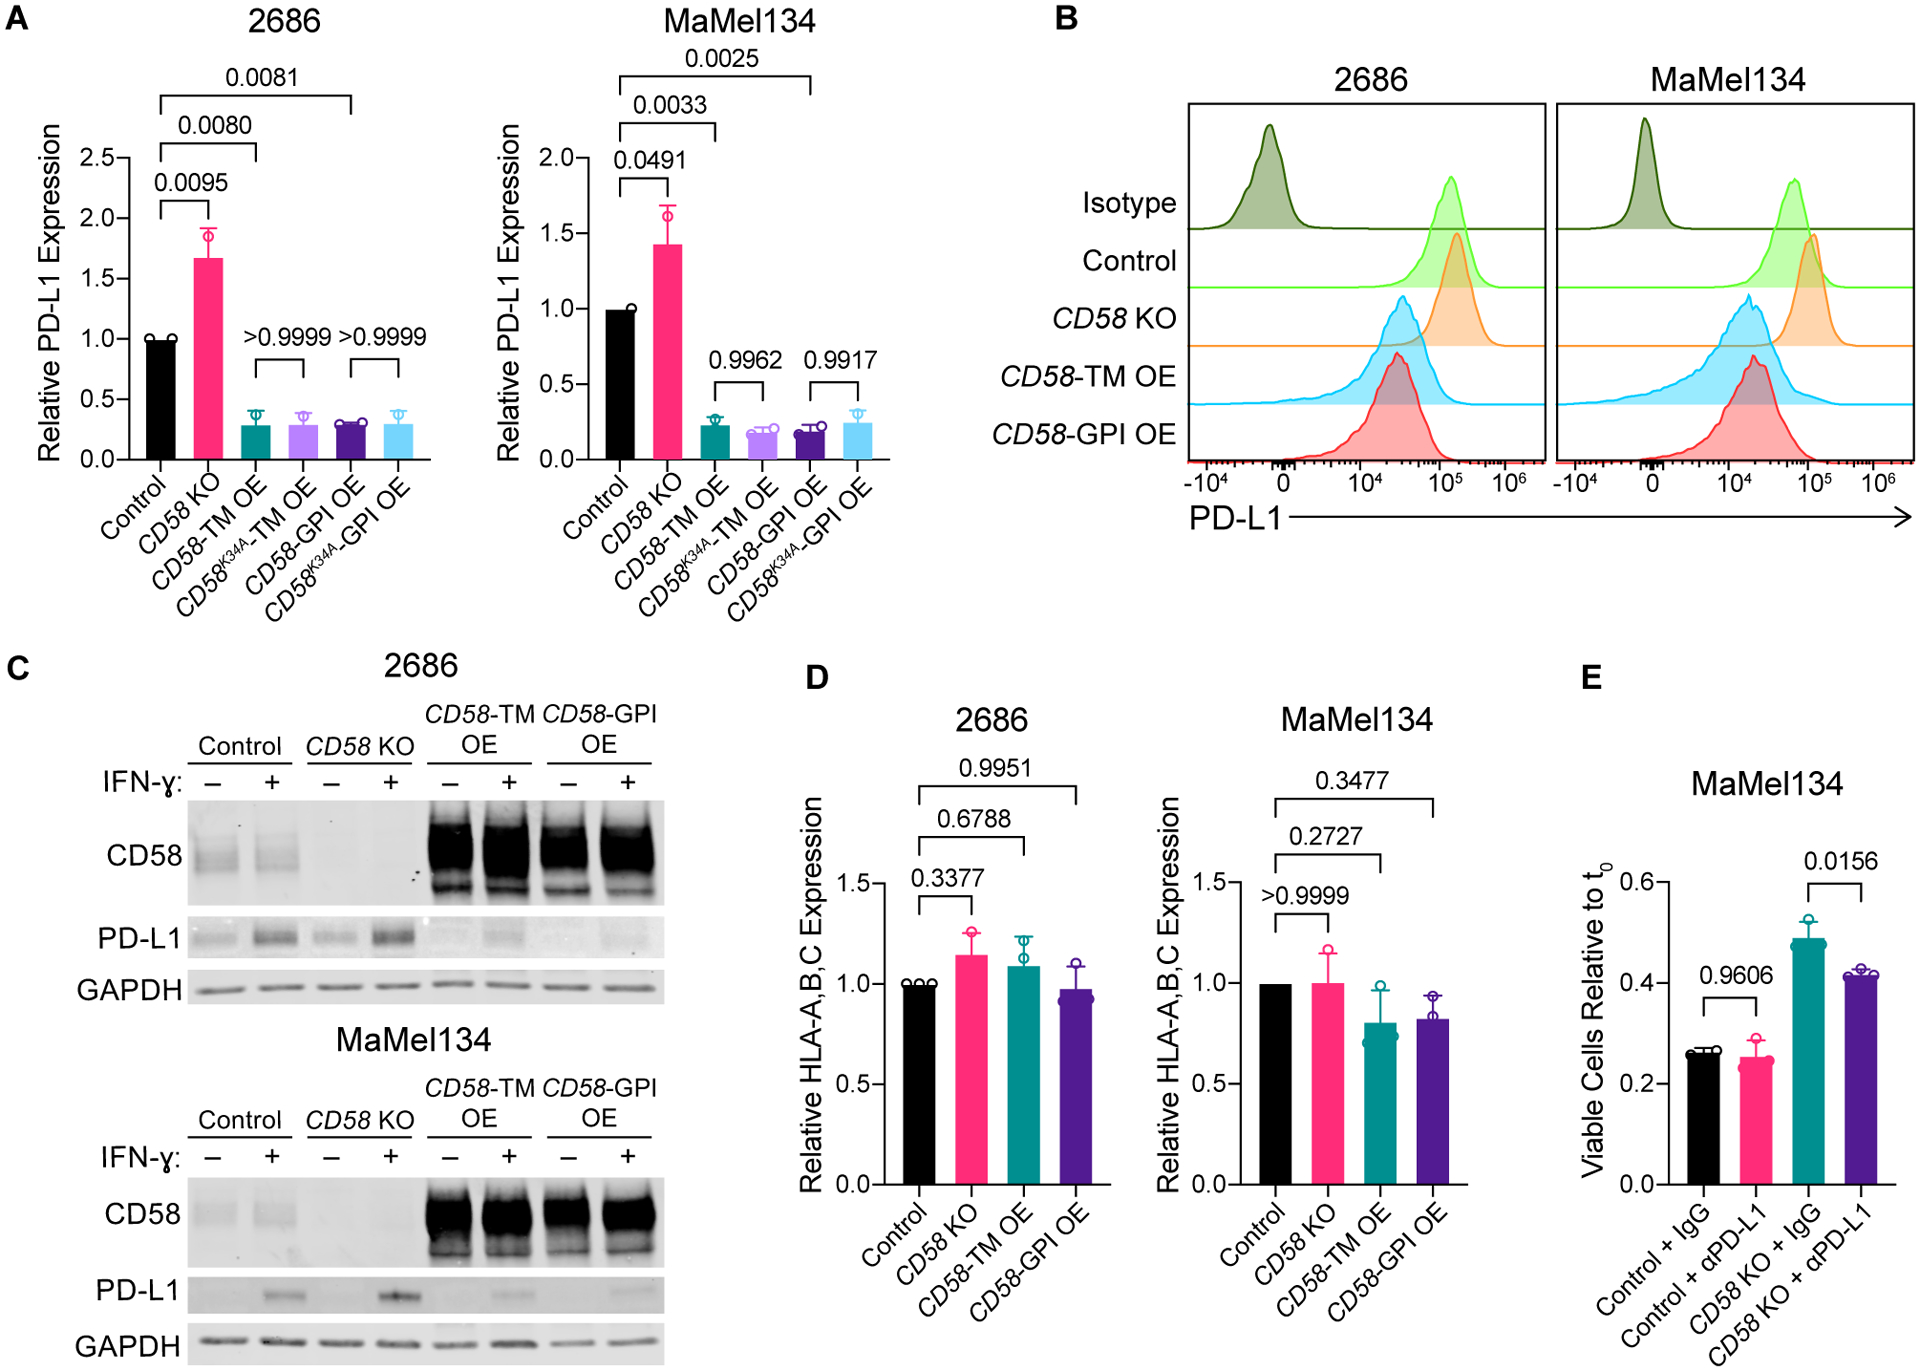
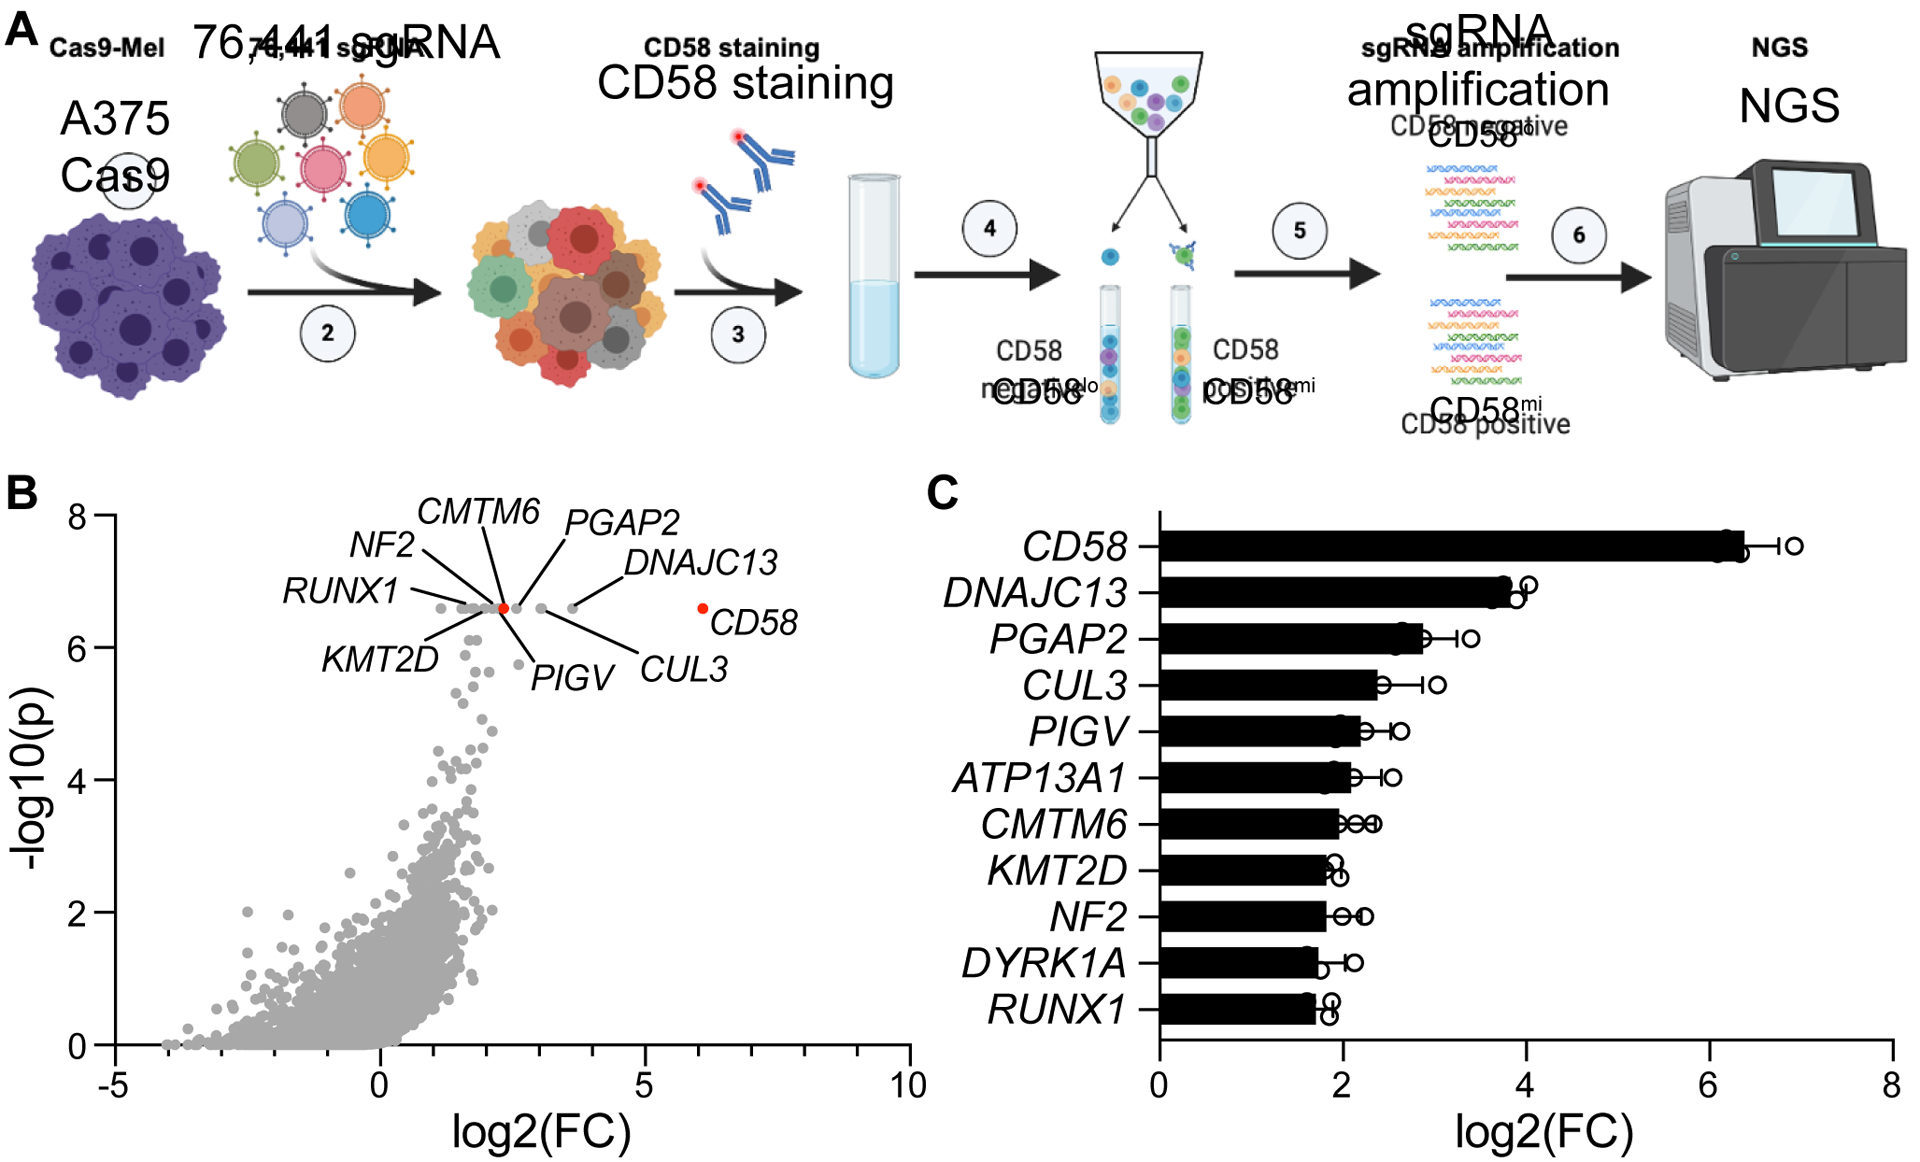
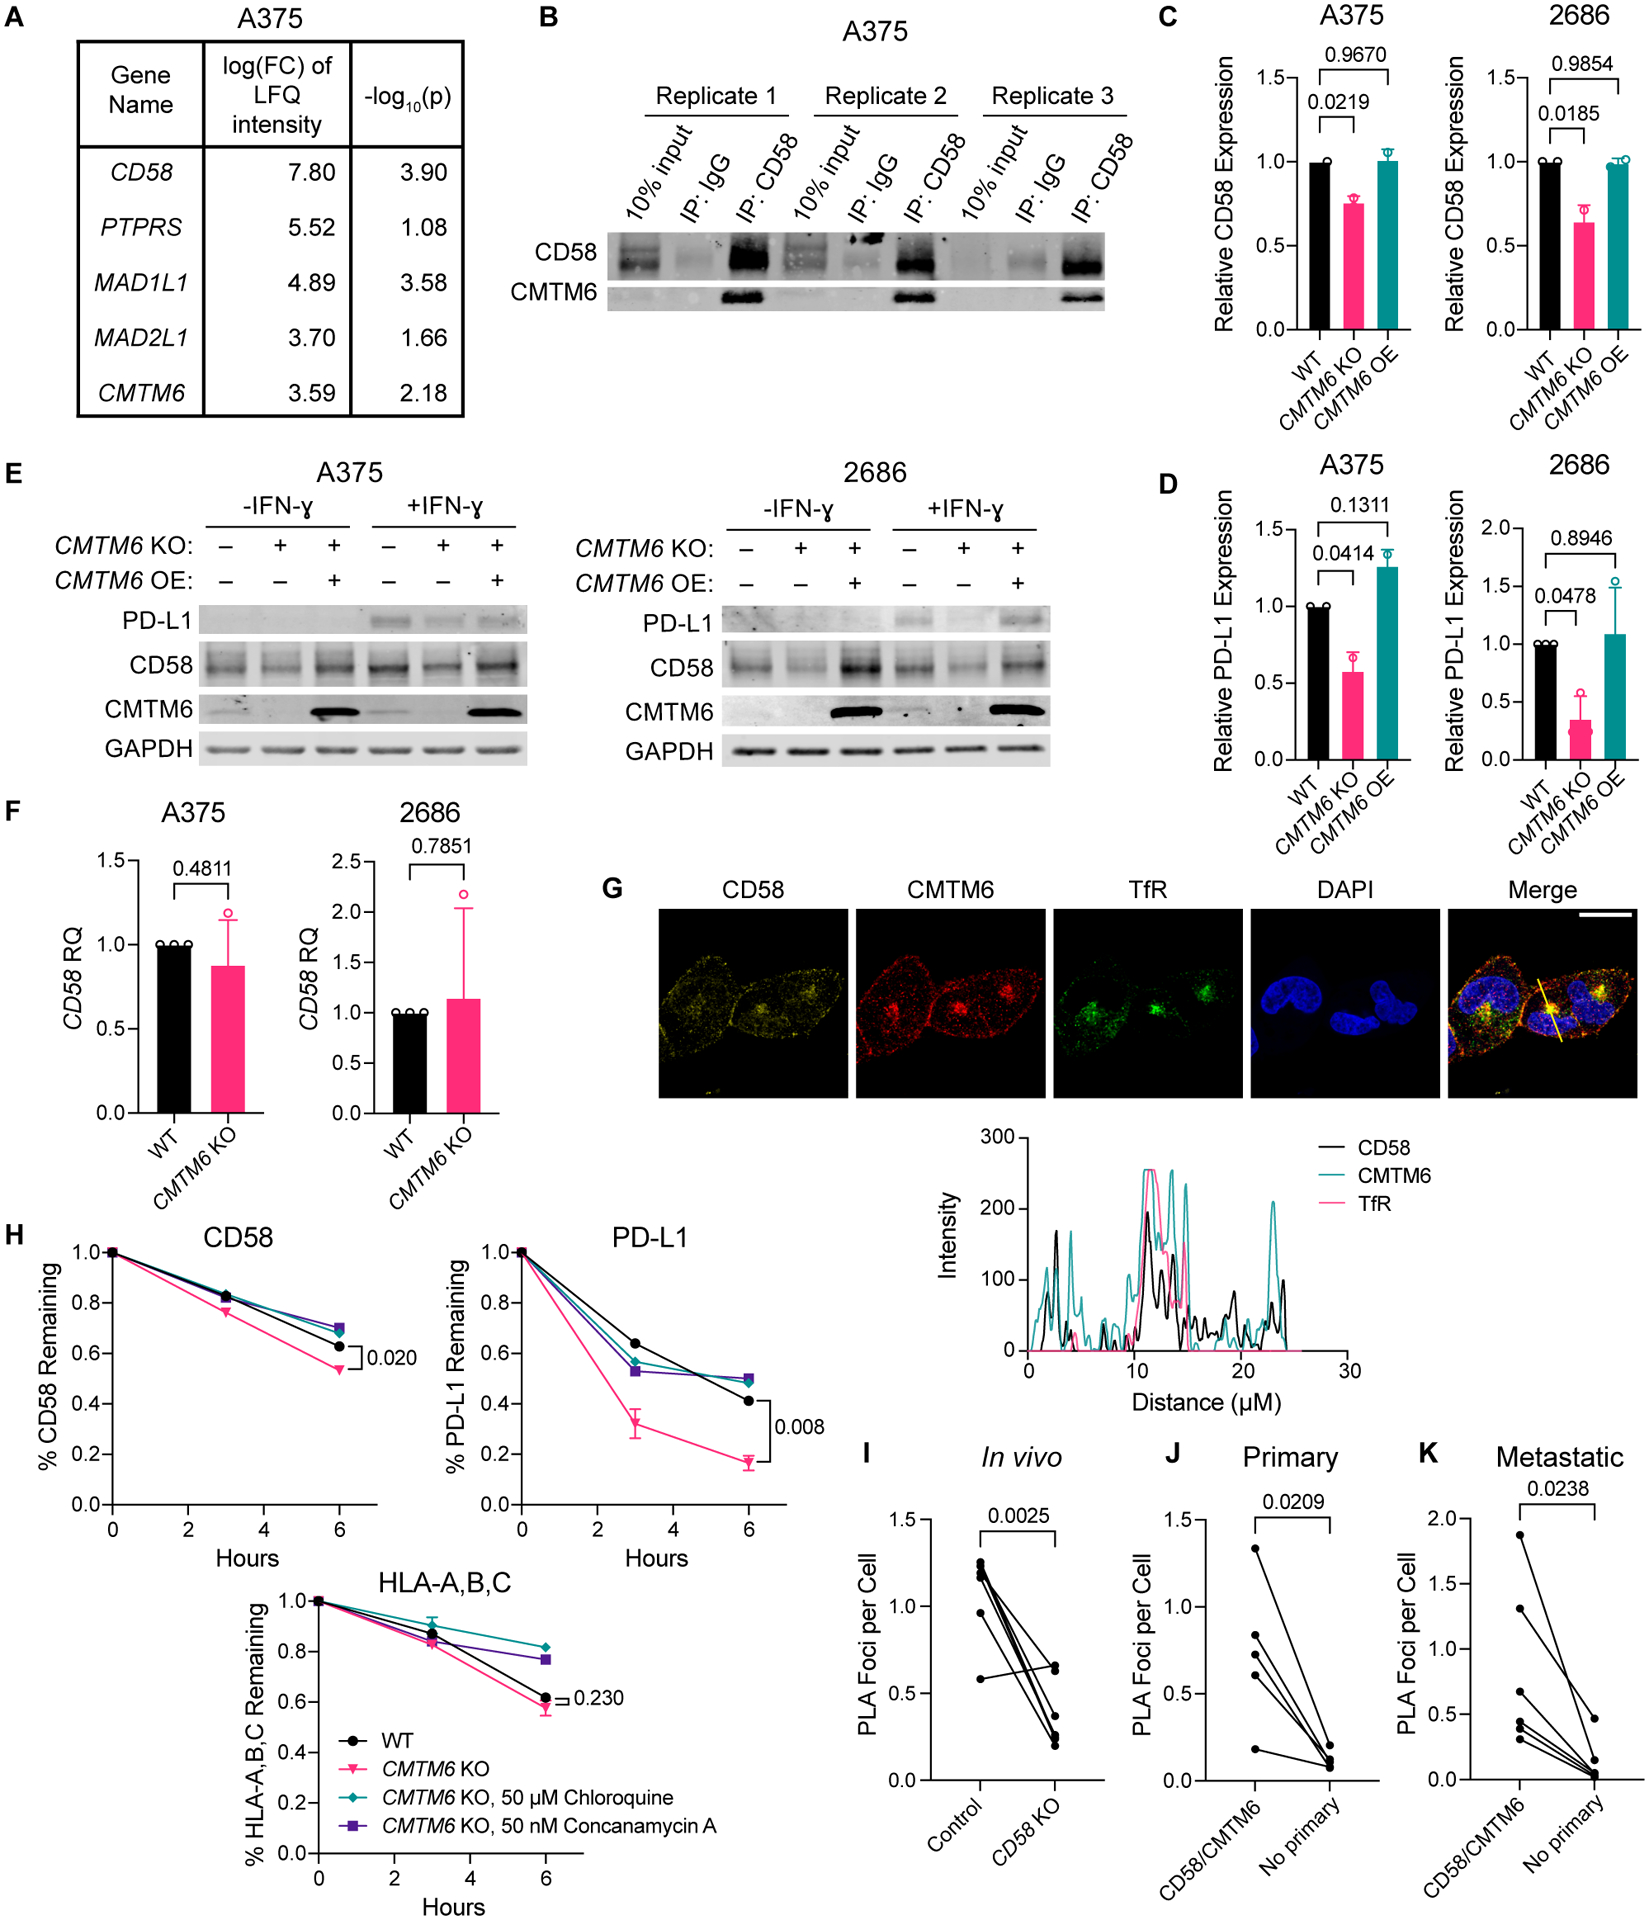
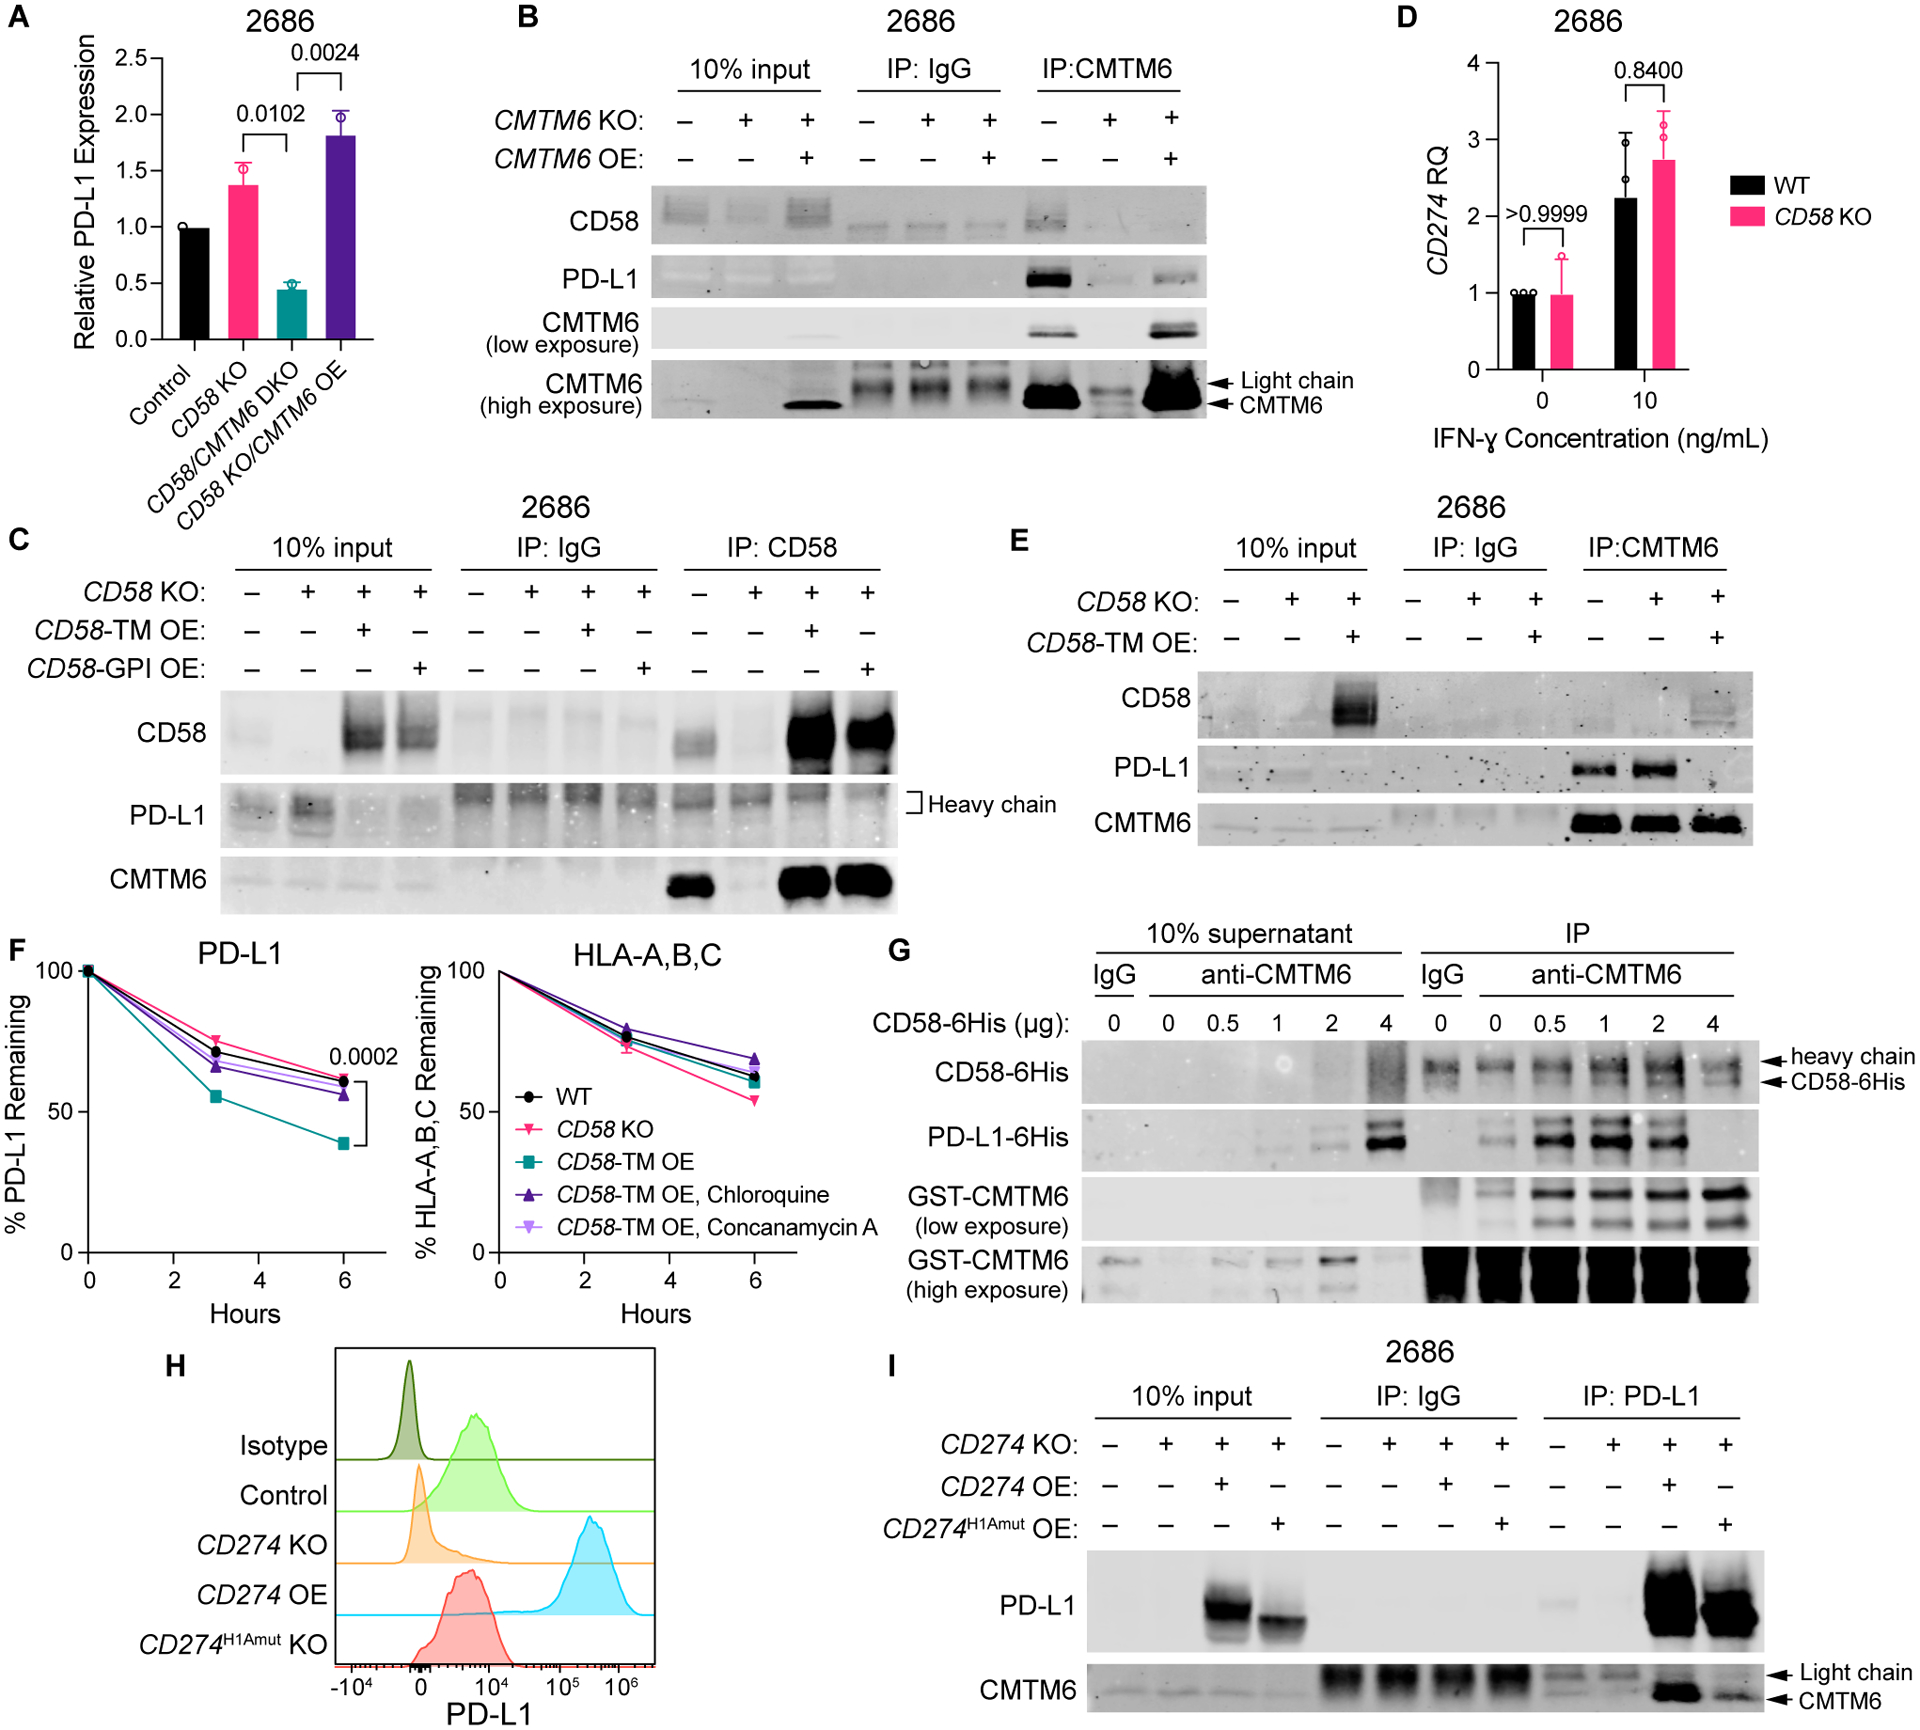
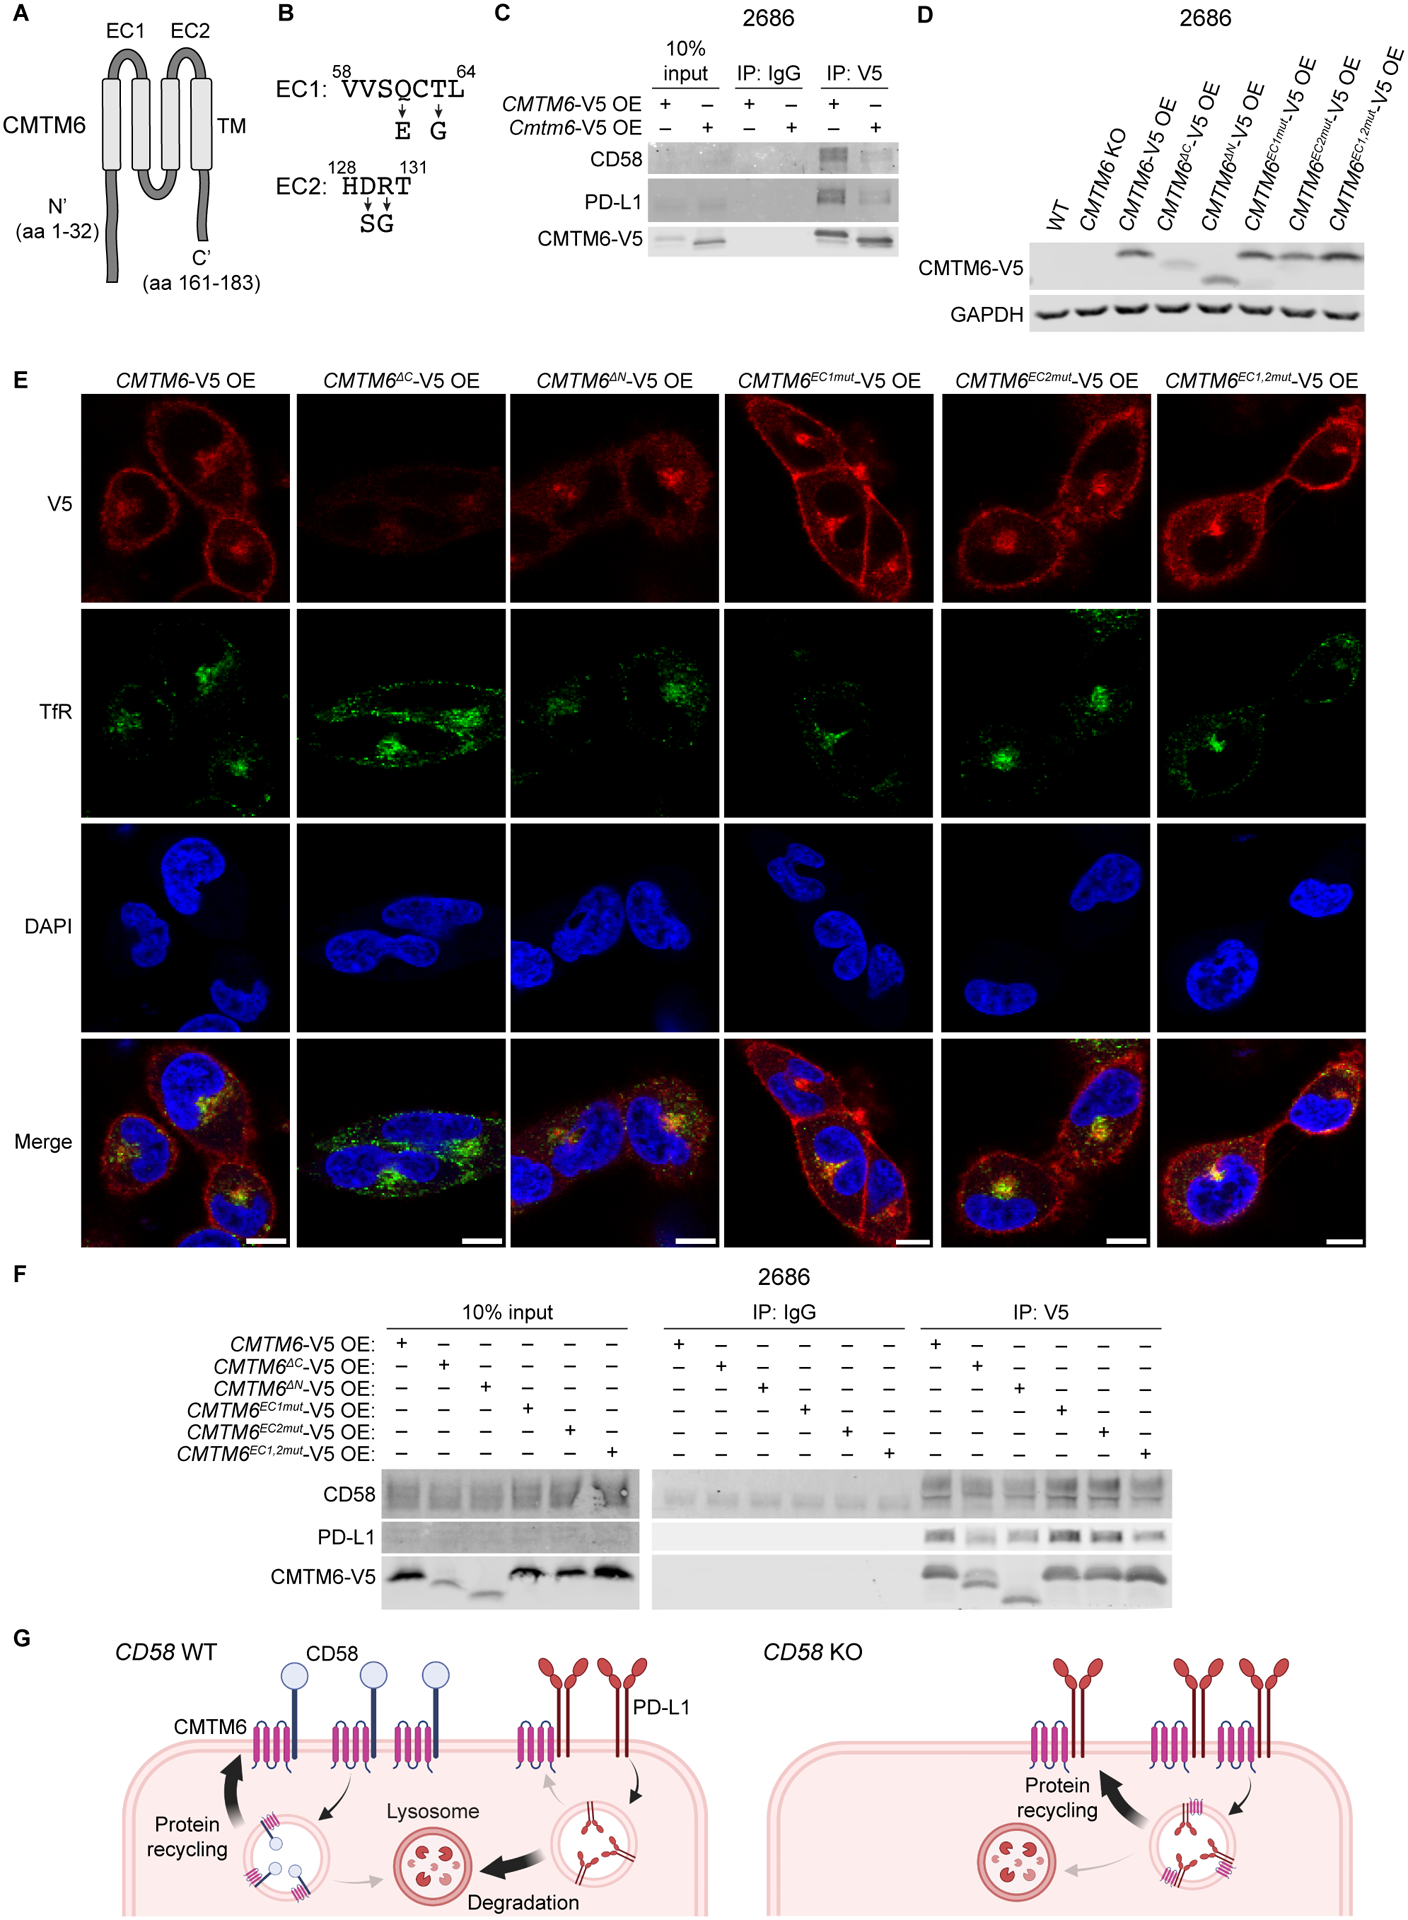
The cell-autonomous balance of immune-inhibitory and -stimulatory signals is a critical process in cancer immune evasion. Using patient-derived co-cultures, humanized mouse models, and single-cell RNA-sequencing of patient melanomas biopsied before and on immune checkpoint blockade, we find that intact cancer cell-intrinsic expression of CD58 and ligation to CD2 is required for anti-tumor immunity and is predictive of treatment response. Defects in this axis promote immune evasion through diminished T cell activation, impaired intratumoral T cell infiltration and proliferation, and concurrently increased PD-L1 protein stabilization. Through CRISPR-Cas9 and proteomics screens, we identify and validate CMTM6 as critical for CD58 stability and upregulation of PD-L1 upon CD58 loss. Competition between CD58 and PD-L1 for CMTM6 binding determines their rate of endosomal recycling over lysosomal degradation. Overall, we describe an underappreciated yet critical axis of cancer immunity and provide a molecular basis for how cancer cells balance immune inhibitory and stimulatory cues.

Keywords: CD2; CD58; CRISPR-Cas9 screen; PDL1; balance of co-inhibitory/co-stimulator; cancer immune evasion; cancer immunology; cancer immunotherapy; immune checkpoint blockade; mass spec screen; resistance to immune checkpoint blockade; single-cell RNA-sequencing.


Conflict of interest statement

Declaration of interests B.I. is a consultant for or received honoraria from Volastra Therapeutics, Johnson & Johnson/Janssen, Novartis, Eisai, AstraZeneca and Merck, and has received research funding to Columbia University from Agenus, Alkermes, Arcus Biosciences, Checkmate Pharmaceuticals, Compugen, Immunocore, and Synthekine. K.W.W. serves on the scientific advisory board of T-Scan Therapeutics, SQZ Biotech, Nextechinvest and receives sponsored research funding from Novartis. He is a co-founder of Immunitas, a biotech company. None of these represent a conflict of interest pertaining to the presented work. P.H., J.C.M., and B.I. filed a patent pertaining to the presented work.

Figures

Figure 1.
Figure 1.. Intact cancer cell CD58 and T cell CD2 signaling is required for anti-tumor immunity.
(A) Stage III/IV (AJCC 8th edition) melanoma patients were treated with nivolumab anti-PD-1 ± ipilimumab anti-CTLA-4. Cutaneous, subcutaneous, or lymph node metastases were biopsied prior to initial treatment and 2–3 weeks later shortly prior to the second treatment cycle. Clinical response (R, responders = complete or partial remission; NR, non-responders = stable or progressive disease) was assessed using RECISTv1.1 best overall response criteria. (B) CD58 up-signature expression scores for malignant cells identified in scRNA-seq analysis of patient melanoma pre- and on-ICB-treatment biopsies from responders versus non-responders. (C-D) Fold change in number of viable 2686 and MaMel134 control, CD58 KO, and CD58-TM or CD58-GPI OE cells after 48 h or 72 h co-culture, respectively, with autologous TILs (C), and IFN-ɣ concentration within cleared media collected from co-cultures (D). (E) Fold change in number of viable 2686 and MaMel134 control, CD58 KO, CD58-TM OE, CD58K34A-TM OE, CD58-GPI OE, or CD58K34A-GPI OE cells after 48 h co-culture with engineered NY-ESO-1-specific T cells or 72 h with autologous TILs, respectively. (F) Fold change in number of viable MaMel134 control or CD58-TM OE cells after 48 h co-culture with or without WT or CD2 KO autologous TILs. (G) MaMel134 TILs were stimulated for 48 h with 1 μg/mL OKT3 +/− 2 μg/mL CD58-Fc chimera prior to co-culturing with autologous melanoma cells; fold change in viable CD58 WT or KO melanoma cells shown after 48 h of co-culture. Experiments performed in triplicate, with representative experiment shown of at least two independent experiments each (C-G). Statistical analysis performed using Wilcoxon rank sum test (B), one-way ANOVA with Tukey’s multiple comparisons test (C-E), and two-way ANOVA with Tukey’s multiple comparisons test (F,G). Data represent mean ± SD. Top and bottom of violin plots indicate minimum and maximum, respectively, and width represents frequency of values (B). See also Figure S1 and S2 and Table S1.
Figure 2.
Figure 2.. Loss of CD58 confers cancer immune evasion via impaired intratumoral T cell infiltration and proliferation.
(A) Experimental design of in vivo study of CD58 loss and re-expression in melanoma tumors. MaMel134 NLS-dsRed-expressing parental and CD58 KO or CD58-TM OE melanoma cells were implanted in NOG mice as bilateral subcutaneous flank injections, followed by two treatments with ACT of autologous TILs or PBS control (n=8 per treatment group). (B-C) Fold change volume of control and CD58 KO tumors following initial ACT treatment or PBS control, with individual tumors shown in (C). For each group, individual tumors with partial or complete response to therapy, defined as <4-fold change in volume from initial ACT treatment to endpoint, are indicated. (D) Ratio of human CD8+ cells to mouse CD45+ immune cells within ACT-treated control and CD58 KO tumors. (E) Representative multiplexed immunofluorescence of FFPE tissue sections from mouse tumors staining for DAPI, CD58, CD8, and Ki-67. Scale bar = 100 μm. (F) Percent of CD8+ TILs within ACT-treated control and CD58 KO tumors that express Ki-67. Statistical analysis performed using unpaired (B – PBS v. ACT) and paired (B – Control v. KO - D, F) two-sided T-tests. Line at median. Data represent mean ± SEM (B). See also Figure S3 and S4.
Figure 3.
Figure 3.. Concurrent upregulation of PD-L1 in CD58 loss contributes to cancer immune evasion.
(A-C) Surface (A-B) and whole protein (C) PD-L1 expression in 2686 and MaMel134 control, CD58 KO, CD58-TM, CD58K34A-TM, CD58-GPI, and CD58K34A-GPI OE cells following 72 h stimulation with 10 ng/mL IFN-ɣ assessed by flow cytometry and immunoblotting, respectively. (D) As in (A), but showing HLA-A,B,C expression. (E) Fold change in number of viable MaMel134 control and CD58 KO cells after 24 h co-culture with pre-stimulated autologous TILs in the presence of 10 μg/mL anti-PD-L1 (B7-H1) blocking antibody or IgG isotype control. TILs were stimulated overnight with 1 μg/mL anti-CD3 (OKT3) antibody prior to co-culture with melanoma cells. Experiments performed in duplicate (A, D) or triplicate (E). Independent experiments shown in (A, D) and representative experiment shown from at least two independent experiments in (B, C, E). Statistical analysis performed using one-way ANOVA with Tukey’s multiple comparisons test. Data represent mean ± SD. See also Figure S5.
Figure 4.
Figure 4.. Genome-scale CRISPR-Cas9 screen identifies CMTM6 as a positive regulator of CD58.
(A) Experimental design of whole genome-wide CRISPR-Cas9 KO screen to identify positive regulators of CD58. Screen was performed independently twice, with two technical replicates each. (B) Distribution of CRISPR-Cas9 target gene enrichment within the CD58lo population compared to the CD58mi population from an example replicate, showing log2 fold change of gene enrichment and P-value for enrichment calculated from a negative binomial model as determined by the Model-based Analysis of Genome-wide CRISPR-Cas9 Knockout (MAGeCK) algorithm. (C) Genes identified as positive regulators of CD58 (criterion of FDR<0.25 across all four replicates), ranked by log2 fold change enrichment of targeting sgRNAs in CD58lo versus control CD58mi population across replicates. Data represent mean ± SD. See also Figure S5 and Table S2 and S3.
Figure 5.
Figure 5.. CMTM6 binds to and promotes protein stability of CD58 via endosomal recycling.
(A) Genes whose encoded proteins were enriched in CD58 IP versus IgG isotype IP lysates from A375 melanoma cells by mass spectrometry analysis. Inclusion criteria: FDR<0.05, log2 FC of LFQ intensity value >3, and an average spectral count within CRAPome database <2 to exclude background contaminants. Experiment was performed with three biological replicates. (B) Immunoblotting for CD58 and CMTM6 of A375 CD58 IP lysates used for IP-MS analysis. (C-D) Cell surface expression of CD58 (C) and PD-L1 (D) in A375 and 2686 WT, CMTM6 KO, and CMTM6 OE cells as assessed by flow cytometry. (E) Immunoblotting for PD-L1, CD58, and CMTM6 in A375 and 2686 WT, CMTM6 KO, and CMTM6 OE cells after 72 h with or without 10 ng/mL IFN-ɣ. (F) Relative gene expression of CD58 in A375 and 2686 WT or CMTM6 KO cells. (G) 2686 WT cells were fixed and stained for CD58, CMTM6, and transferrin receptor (TfR), a marker of recycling endosomes, and analyzed by confocal microscopy. Profile plots of relative fluorescence intensity along yellow line shown at bottom. Scale bar = 20 μm. (H) 2686 WT and CMTM6 KO cells were stained for cell surface CD58, PD-L1, and HLA-A,B,C with fluorophore-conjugated antibodies following 72 h with 10 ng/mL IFN-ɣ stimulation, and then incubated at 37 °C for 3–6 h to allow for recycling of antibody-bound cell surface proteins in the presence or absence of lysosomal inhibitors chloroquine or concanamycin A. Remaining CD58, PD-L1, and HLA-A,B,C expression was assessed by flow cytometry. (I-K) Number of PLA foci representing CD58/CMTM6 interactions per cell in FFPE sections of CD58 WT versus KO tumors from mice shown in Figure 2A (I; n=7 each) and from patient primary (J; n=5) and metastatic (K; n=6) melanoma samples. Experiments performed in duplicate, with independent experiments shown (C-D). Representative images shown from two independent experiments (E, G). Experiments performed with four technical replicates, with three independent experiments shown (F). Experiments performed in duplicate, with representative experiment shown from two independent experiments (H). Statistical analysis performed using one-way ANOVA with Tukey’s multiple comparisons test (C, D) and two-sided unpaired (F, H) or paired (I-K) T-tests. Data represent mean ± SD. See also Figure S6 and Table S4.
Figure 6:
Figure 6:. CMTM6 is necessary for and enables an increase of PD-L1 in cells with CD58 loss.
(A) Flow cytometry analysis of surface expression of PD-L1 in 2686 control, CD58 KO, CD58/CMTM6 DKO, and CD58 KO/CMTM6 OE cells after 72 h with 10 ng/mL IFN-ɣ . (B) Co-IP of PD-L1 and CD58 with CMTM6 pulldown in 2686 WT, CMTM6 KO, and CMTM6 OE cells after 72 h with 10 ng/mL IFN-ɣ. (C) Co-IP of CMTM6 and PD-L1 with CD58 pulldown in 2686 WT, CD58 KO, CD58-TM, and CD58GPI OE cells after 72 h with 10 ng/mL IFN-ɣ. (D) Relative gene expression of CD274 in 2686 WT and CD58 KO cells after 72 h with or without 10 ng/ml IFN-ɣ. (E) Co-IP of CD58 and PD-L1 with CMTM6 pulldown in 2686 WT, CD58 KO, and CD58-TM OE cells after 72 h with 10 ng/mL IFN-ɣ. (F) Remaining PD-L1 and HLA-A,B,C in 2686 WT, CD58 KO, and CD58-TM OE cells (pre-stimulated with 10 ng/mL IFN-ɣ for 72 h) after 3 and 6 hours of incubation at 37 °C post-staining with fluorophore-conjugated antibodies, in the presence or absence of chloroquine or concanamycin A, as assessed by flow cytometry. (G) Co-IP of PD-L1–6His and CD58–6His protein with GST-CMTM6 protein from a mixture of 4 μg PD-L1–6His, 1 μg GST-CMTM6, and increasing amounts of CD58–6His purified recombinant proteins. (H) Surface expression of PD-L1 in 2686 control, CD274 KO, CD274 OE, and CD274H1Amut OE cells after 72 h with 10 ng/mL IFN-ɣ. Counts normalized to mode. (I) Co-IP of CMTM6 with PD-L1 pulldown in 2686 control, CD274 KO, CD274 OE, and CD274H1Amut OE cells after 72 h 10 ng/mL with IFN-ɣ. Representative blot shown from two independent experiments (B, C, E, G, I). Experiments performed in duplicate (A, F) or with four technical replicates (D), with independent experiments (A, D) or representative experiment (F) shown. Statistical analysis performed using two-sided T-test (D, F) and one-way ANOVA with Tukey’s multiple comparisons testing (A). Data represent mean ± SD.See also Figure S7.
Figure 7:
Figure 7:. Both extracellular loops in the MARVEL domain in CMTM6 are required for binding of CD58 or PD-L1
(A) AlphaFold prediction for human CMTM6 protein structure includes transmembrane (TM) MARVEL domain, two extracellular (EC) loops, and intracellular N’ and C’ tails,. (B) Altered amino acid sequences within extracellular loops of CMTM6 for EC1 and EC2 mutants derived from homologous regions in murine CMTM6. (C) Co-IP of PD-L1 and CD58 with human or mouse CMTM6 using anti-V5 IP in 2686 CMTM6-V5 OE and Cmtm6-V5 OE cells after 72h with 10 ng/mL IFN-ɣ. (D) Immunoblotting for V5-tagged protein in 2686 WT, CMTM6 KO, CMTM6-V5 OE, and shown CMTM6 mutant, V5-tagged protein-expressing cells. (E) 2686 V5-tagged CMTM6 WT and mutant-expressing cells were fixed and stained for V5 and transferrin receptor (TfR) and analyzed by confocal microscopy. Scale bars = 10 μm. (F) Co-IP of PD-L1 and CD58 with V5-tagged protein in 2686 V5-tagged CMTM6 WT and mutant-expressing cells after 72h with 10 ng/mL IFN-ɣ. (G) Proposed model of PD-L1 regulation by CD58. Representative images shown from two independent experiments (C, E, F).

References

    1. Hamid O, Robert C, Daud A, Hodi FS, Hwu WJ, Kefford R, Wolchok JD, Hersey P, Joseph R, Weber JS, et al. (2019). Five-year survival outcomes for patients with advanced melanoma treated with pembrolizumab in KEYNOTE-001. Annals of Oncology: Official Journal of the European Society for Medical Oncology 30, 582–588. 10.1093/annonc/mdz011. - DOI - PMC - PubMed
    1. Larkin J, Chiarion-Sileni V, Gonzalez R, Grob J-J, Rutkowski P, Lao CD, Cowey CL, Schadendorf D, Wagstaff J, Dummer R, et al. (2019). Five-Year Survival with Combined Nivolumab and Ipilimumab in Advanced Melanoma. The New England Journal of Medicine 381, 1535–1546. 10.1056/NEJMoa1910836. - DOI - PubMed
    1. Gao J, Shi LZ, Zhao H, Chen J, Xiong L, He Q, Chen T, Roszik J, Bernatchez C, Woodman SE, et al. (2016). Loss of IFN-gamma Pathway Genes in Tumor Cells as a Mechanism of Resistance to Anti-CTLA-4 Therapy. Cell 167, 397–404 e399. 10.1016/j.cell.2016.08.069. - DOI - PMC - PubMed
    1. Zaretsky JM, Garcia-Diaz A, Shin DS, Escuin-Ordinas H, Hugo W, Hu-Lieskovan S, Torrejon DY, Abril-Rodriguez G, Sandoval S, Barthly L, et al. (2016). Mutations Associated with Acquired Resistance to PD-1 Blockade in Melanoma. N Engl J Med 375, 819–829. 10.1056/NEJMoa1604958. - DOI - PMC - PubMed
    1. Sade-Feldman M, Jiao YJ, Chen JH, Rooney MS, Barzily-Rokni M, Eliane J-P, Bjorgaard SL, Hammond MR, Vitzthum H, Blackmon SM, et al. (2017). Resistance to checkpoint blockade therapy through inactivation of antigen presentation. Nature Communications 8, 1136. 10.1038/s41467017-01062-w. - DOI - PMC - PubMed

Publication types

LinkOut - more resources