. 2023 Jul 11;35(7):1163-1178.e10.
doi: 10.1016/j.cmet.2023.05.010. Epub 2023 Jun 15.

Acetate controls endothelial-to-mesenchymal transition

Affiliations

Acetate controls endothelial-to-mesenchymal transition

Xiaolong Zhu et al. Cell Metab. .

Abstract

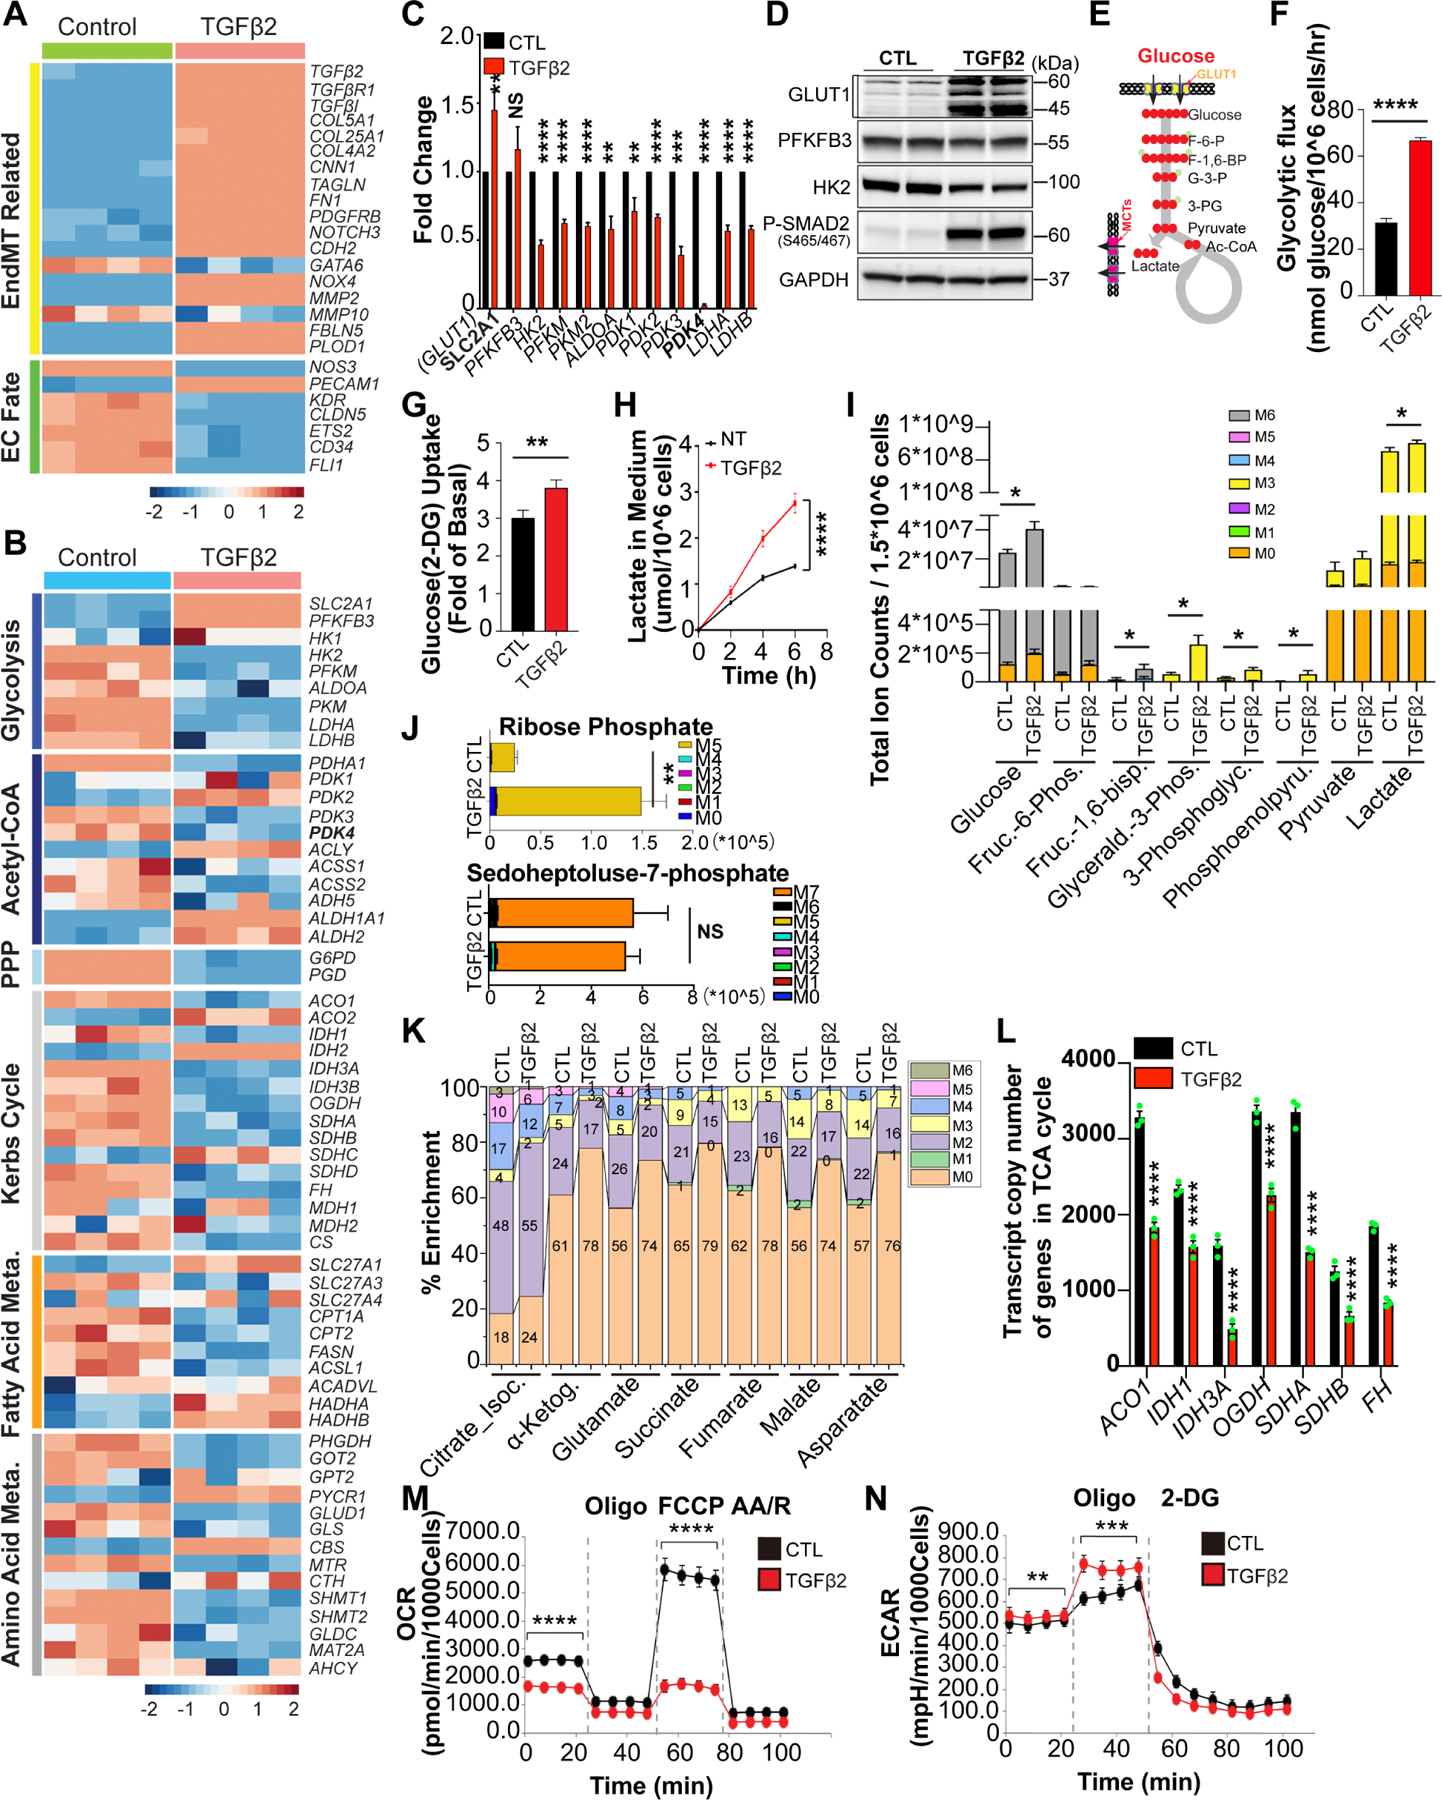
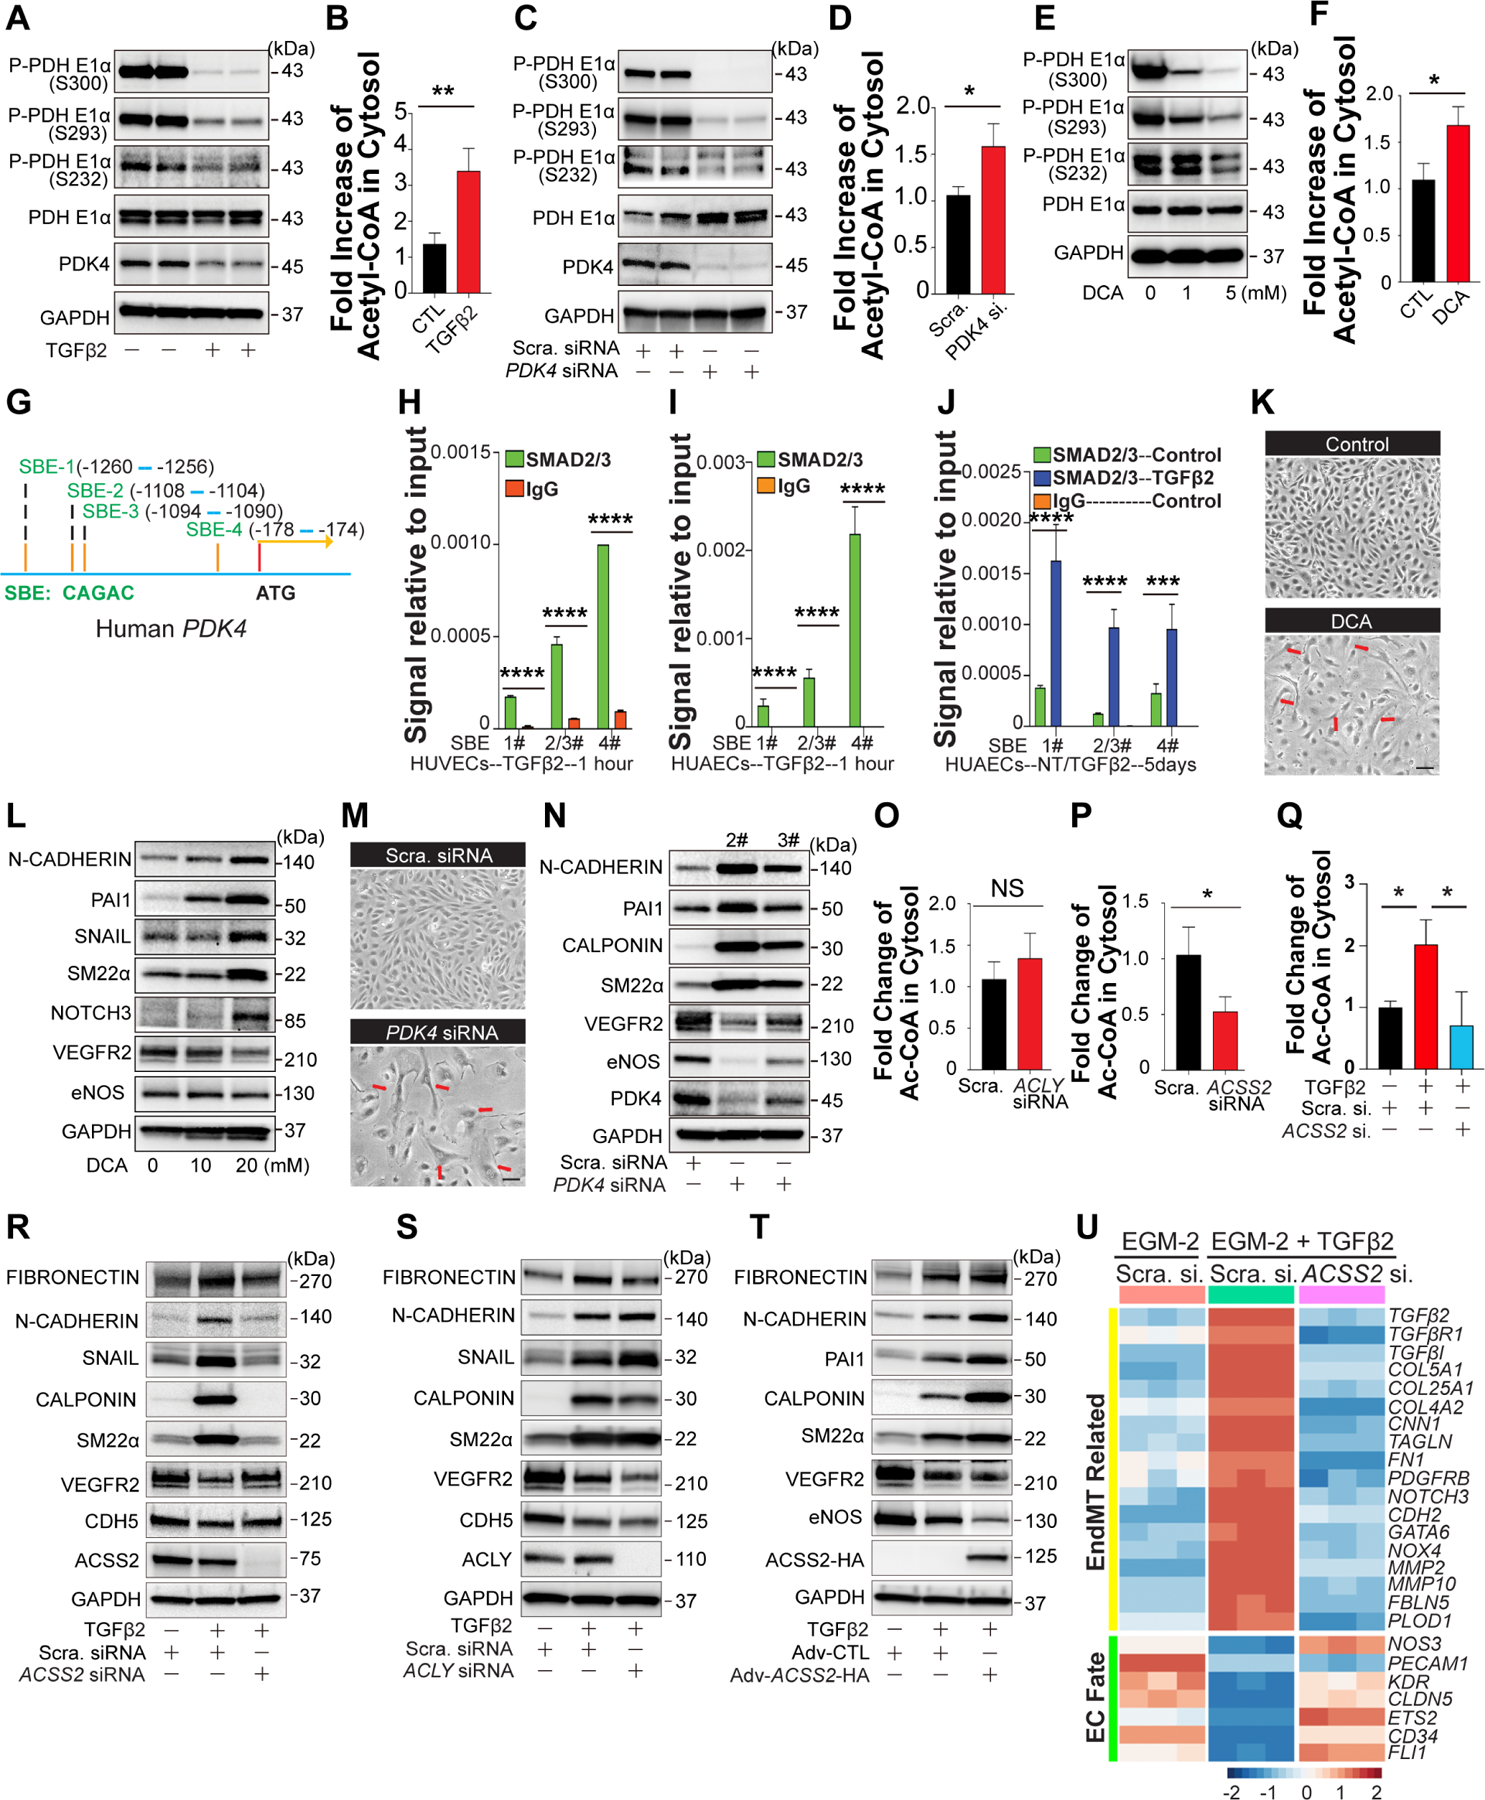
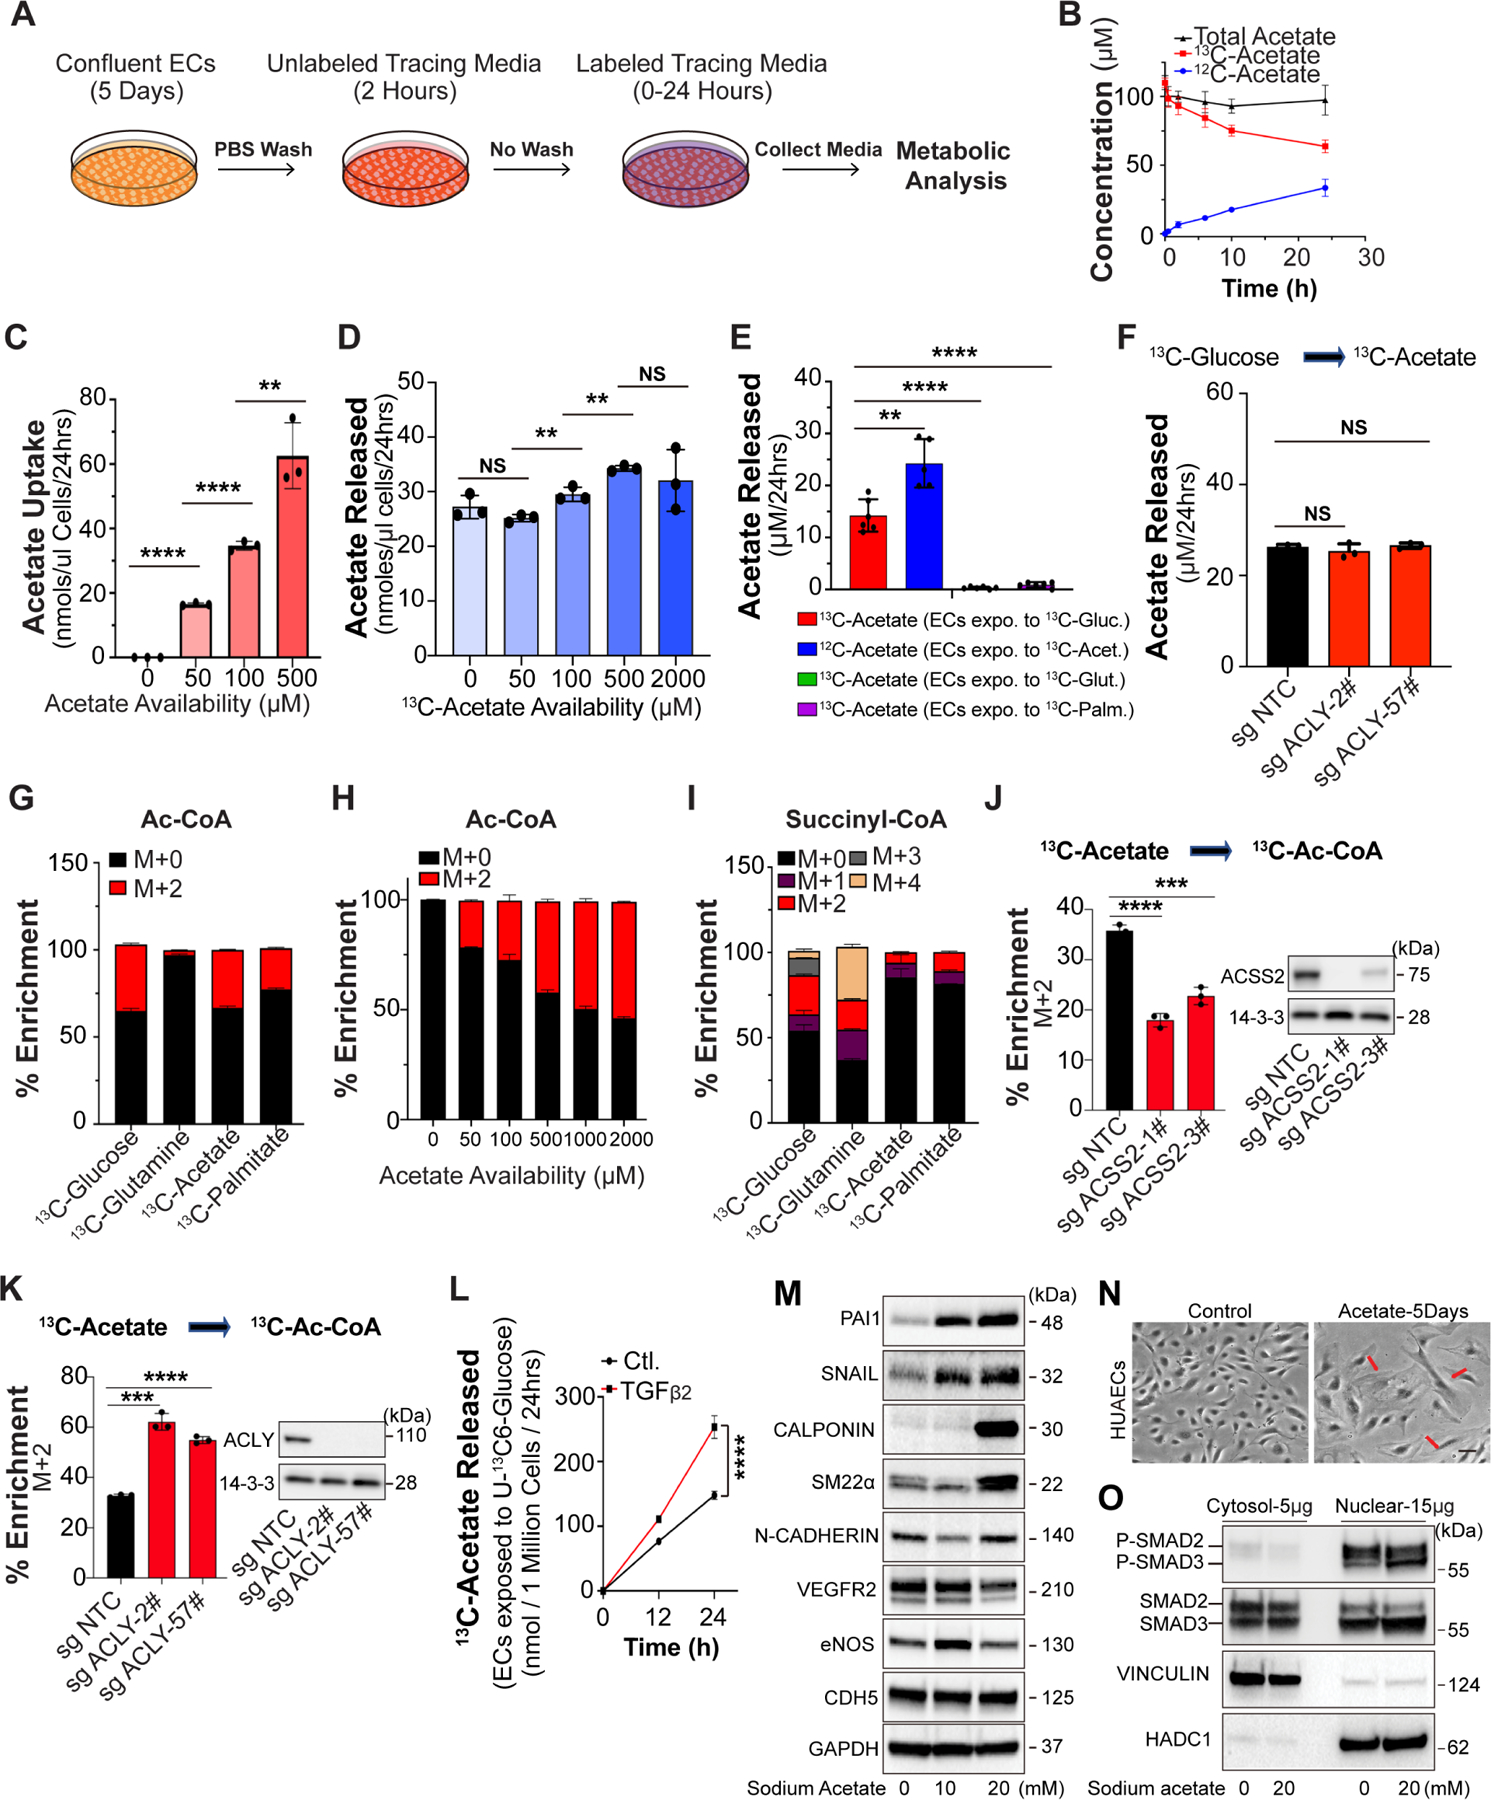
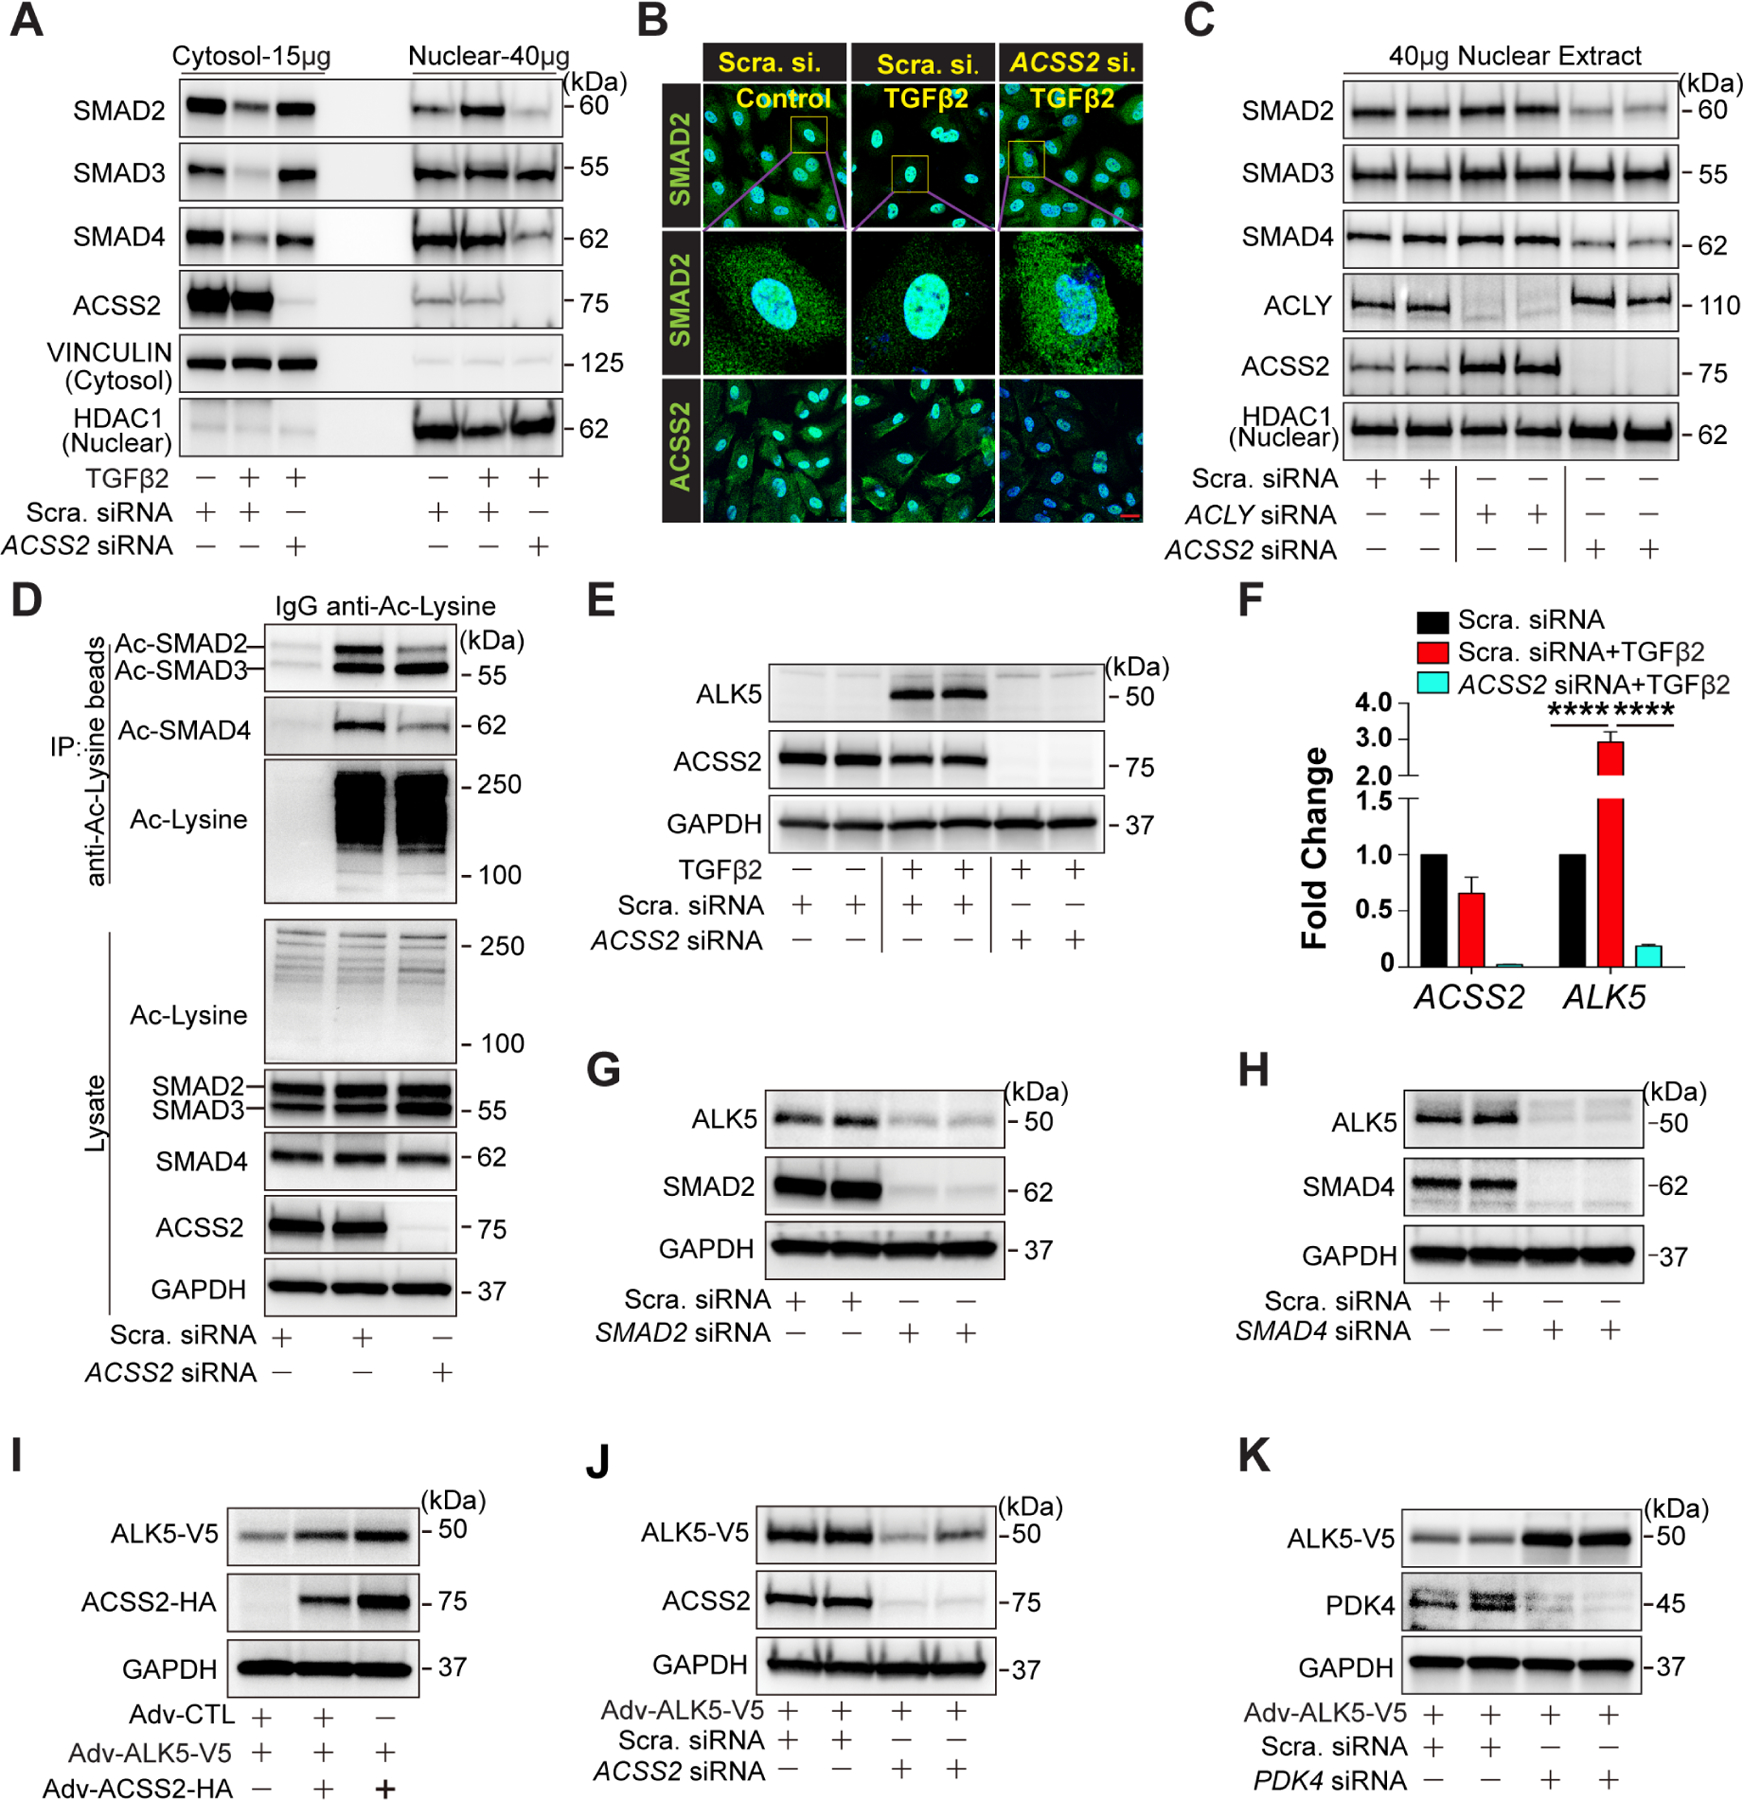
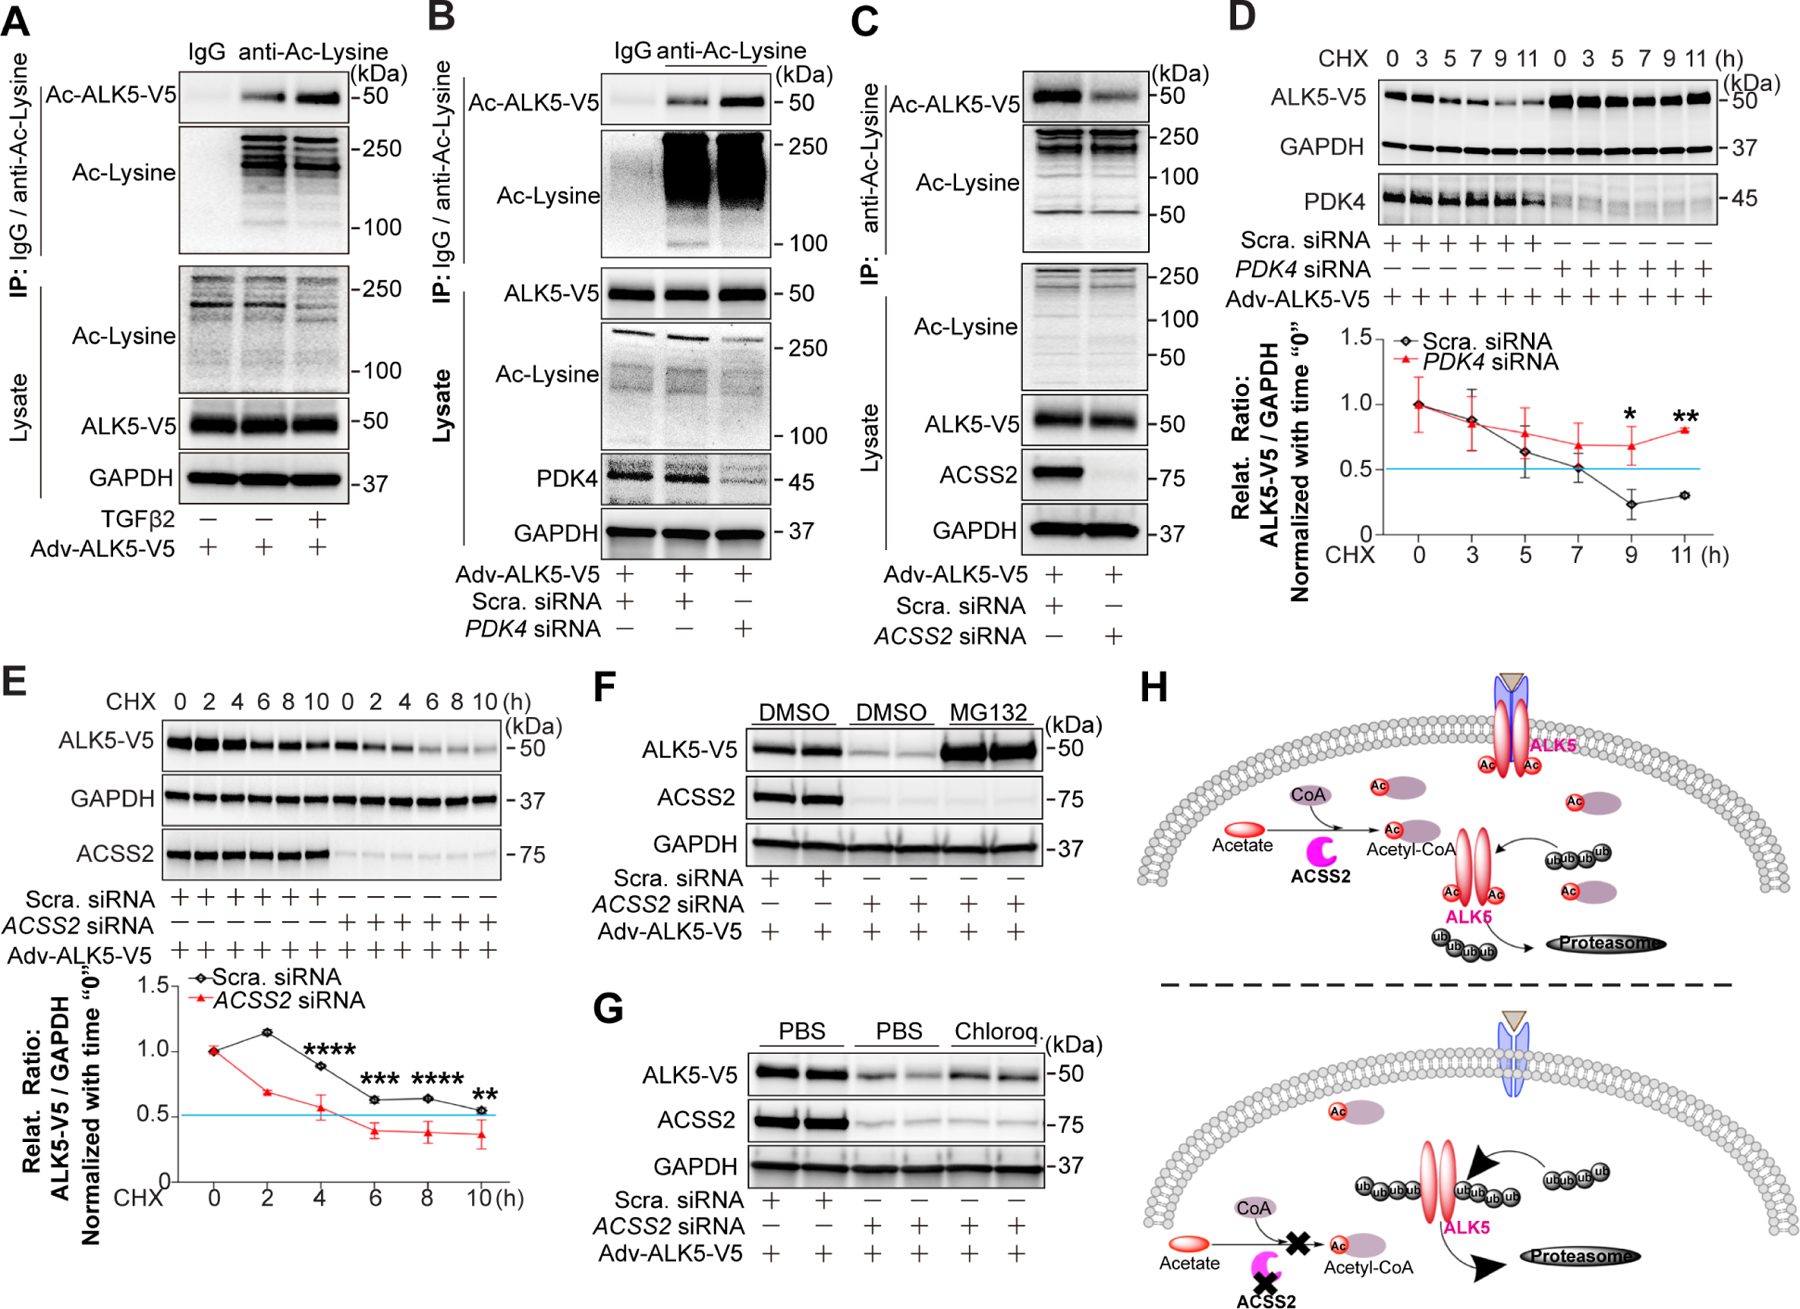
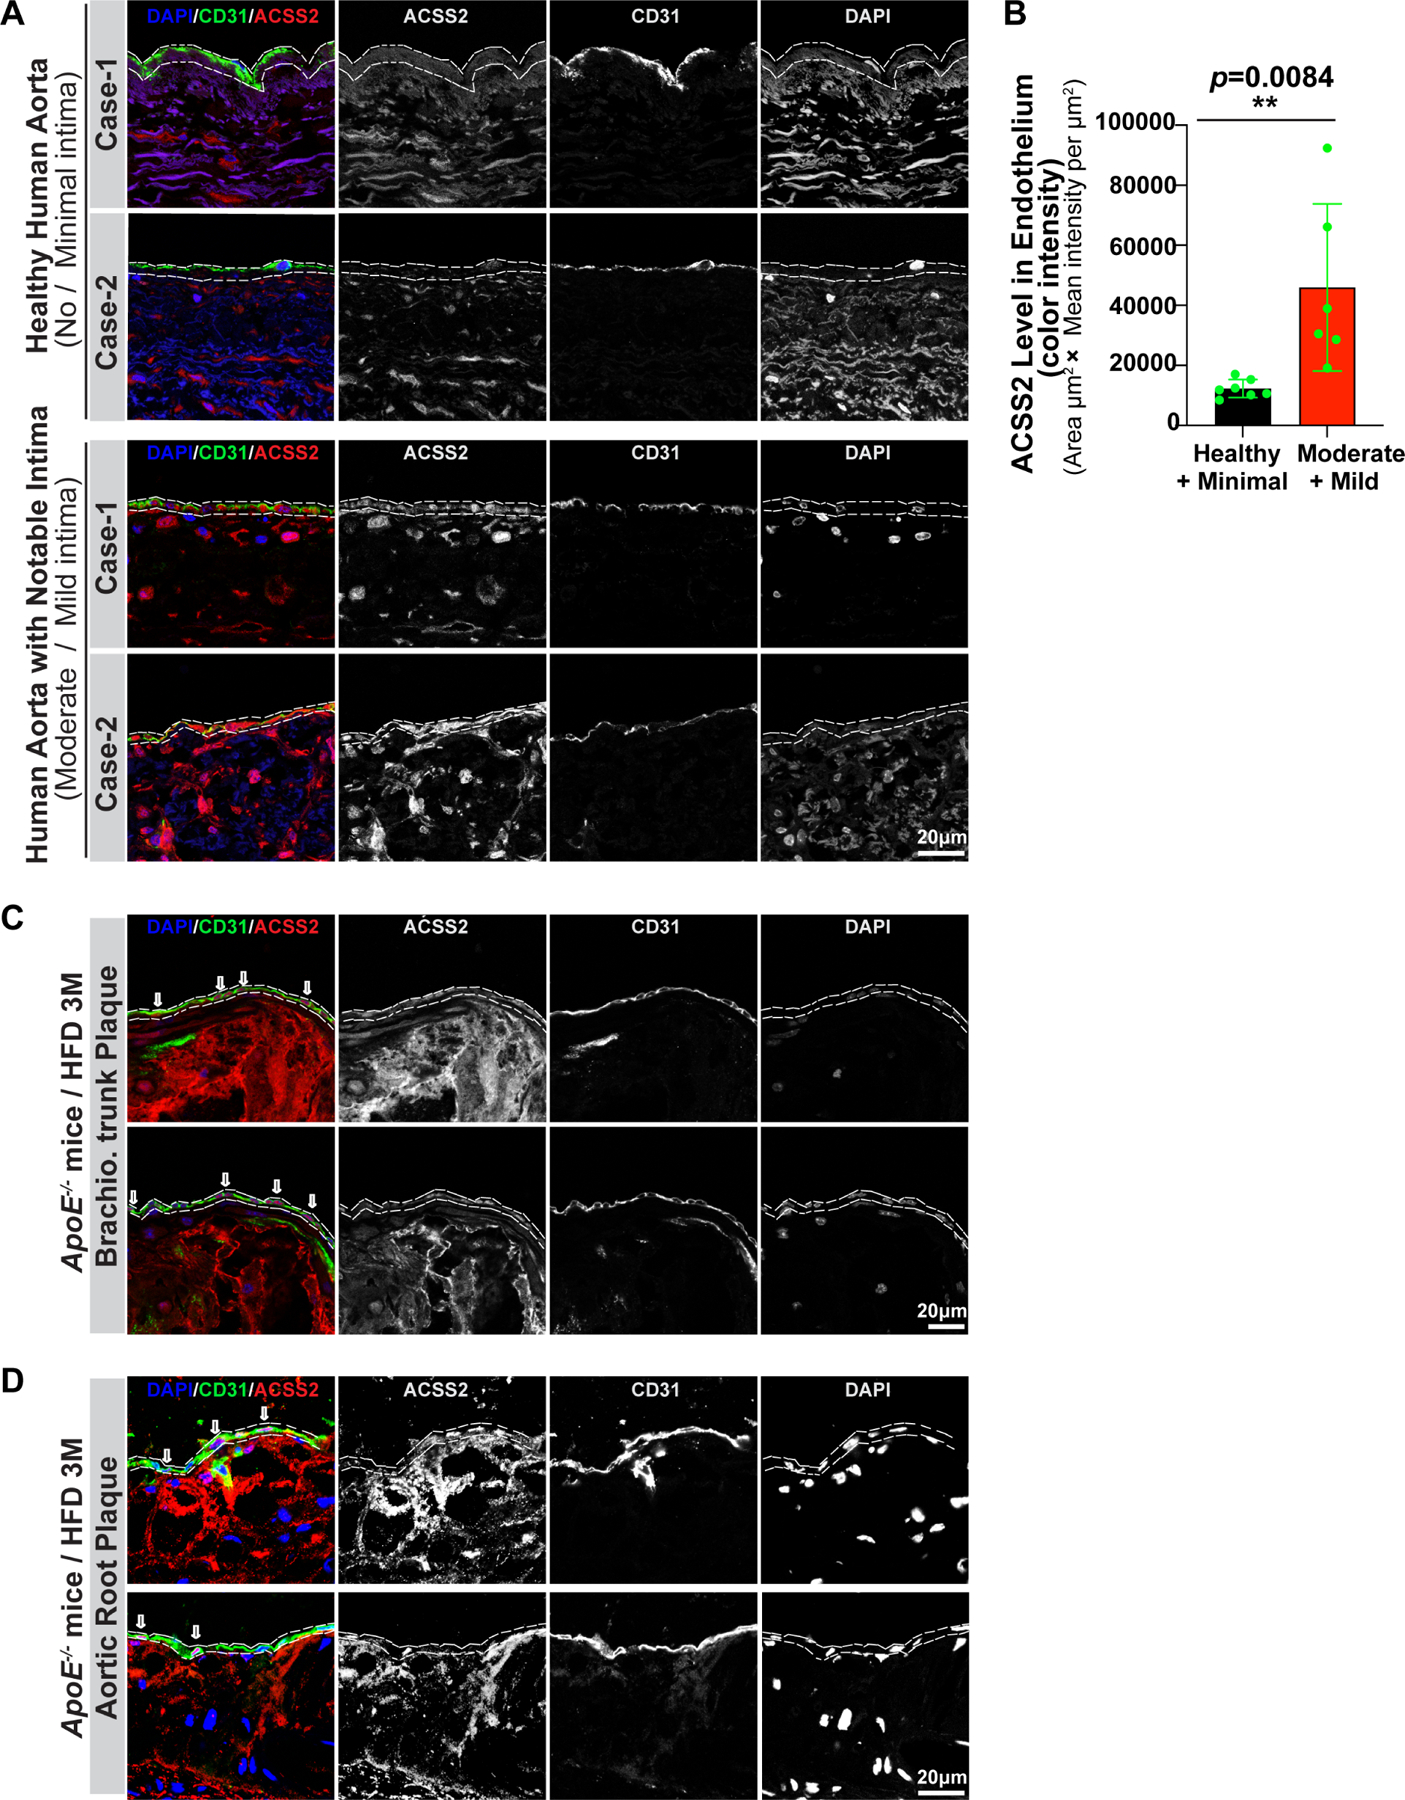
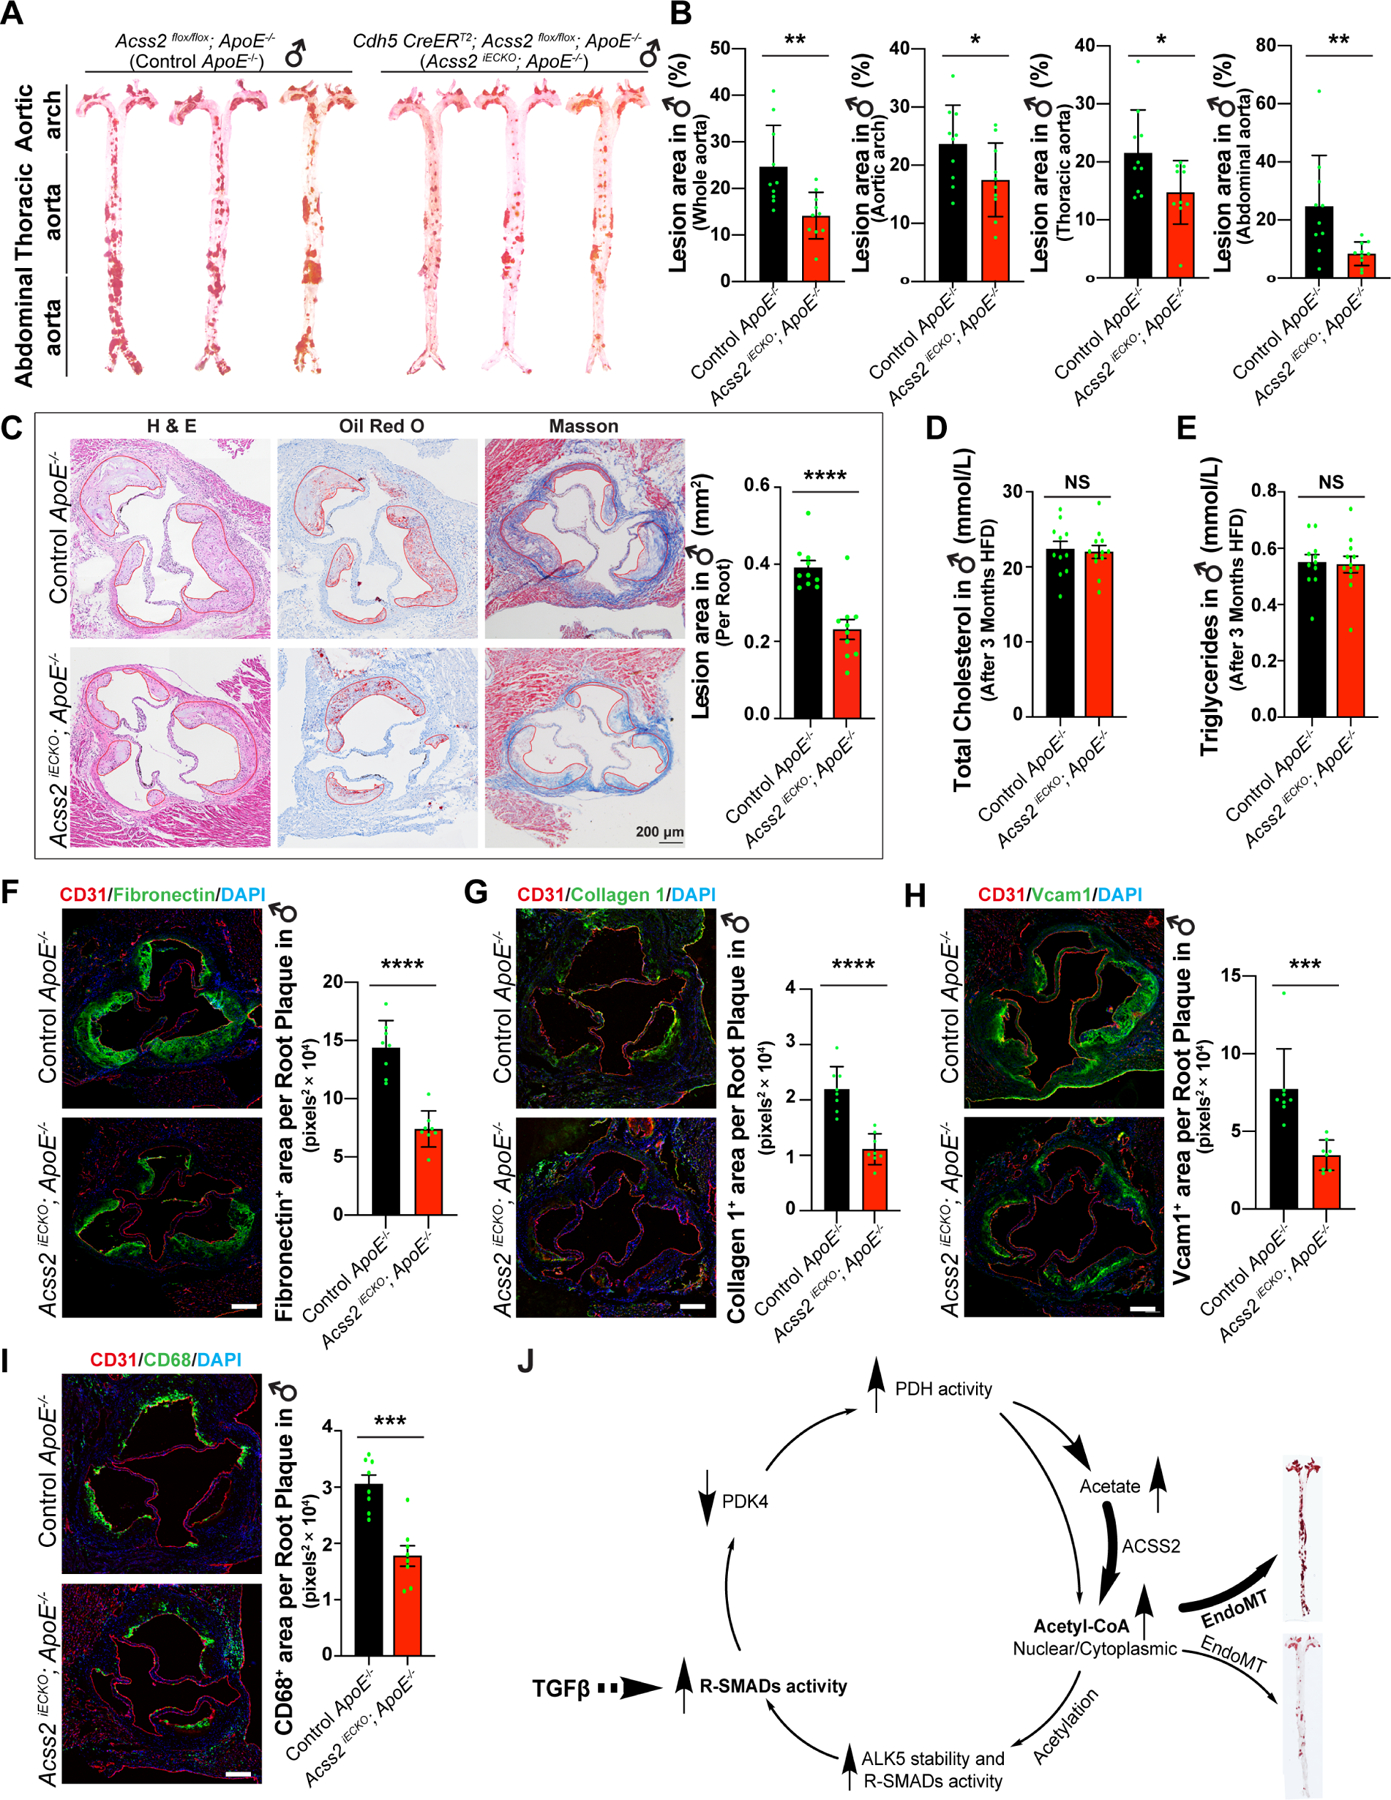
Endothelial-to-mesenchymal transition (EndMT), a process initiated by activation of endothelial TGF-β signaling, underlies numerous chronic vascular diseases and fibrotic states. Once induced, EndMT leads to a further increase in TGF-β signaling, thus establishing a positive-feedback loop with EndMT leading to more EndMT. Although EndMT is understood at the cellular level, the molecular basis of TGF-β-driven EndMT induction and persistence remains largely unknown. Here, we show that metabolic modulation of the endothelium, triggered by atypical production of acetate from glucose, underlies TGF-β-driven EndMT. Induction of EndMT suppresses the expression of the enzyme PDK4, which leads to an increase in ACSS2-dependent Ac-CoA synthesis from pyruvate-derived acetate. This increased Ac-CoA production results in acetylation of the TGF-β receptor ALK5 and SMADs 2 and 4 leading to activation and long-term stabilization of TGF-β signaling. Our results establish the metabolic basis of EndMT persistence and unveil novel targets, such as ACSS2, for the potential treatment of chronic vascular diseases.

Keywords: ACSS2; ALK5; PDK4; acetate; acetyl-CoA; atherosclerosis; endfothelial cells; endothelial-to-mesenchymal transition; transforming growth factor beta signaling.


Conflict of interest statement

Declaration of interests The authors declare no competing interests.

Figures

Figure 1.
Figure 1.. Metabolic effects of endothelial TGFβ signaling.
A-B, Bulk RNA-seq analysis of EndMT markers and endothelial cell (EC)-specific gene expression (A), and metabolic genes expression (B) in Human Umbilical Artery Endothelial Cells (HUAECs) with or without TGFβ2 stimulation (10ng/ml) in complete EGM-2 medium for 7 days. C, Quantitative Polymerase Chain Reactions (QPCR) analysis of glycolytic genes expression in HUAECs before and after TGFβ2 stimulation (10ng/ml) in complete EGM-2 medium for 7 days. D, Representative blots for key glycolytic proteins in HUAECs before and after TGFβ2 stimulation for 7 days. E, Diagram of carbon flux in glycolysis. F-H, Glycolytic activity was measured in HUAECs with or without TGFβ2 stimulation (10ng/ml) for 7 days. Glycolytic flux was then determined by testing the conversion of glucose, D-[5–3H(N)] to 3H2O (F). 2-Deoxyglucose (2-DG) and conversion to 2-DG-6-phosphate (2-DG6P) was measured to show the glucose uptake changes (G). Lactate concentration in the media collected from HUAECs culture under indicated conditions at specified time points normalized by the cell number (H). 5% dialyzed fetal bovine serum (D-FBS) with lower basal lactate was to the the medium instead of FBS. I-K, Liquid chromatography-mass spectrometry (LC-MS) metabolomics analysis of key metabolites in HUAECs treated with 13C-glucose (U-13C6-Glucose, 10mM) for 24 hours after 7 days of TGFβ2 stimulation. Total ion counts of key intermediaries of glycolysis can be found in (I), the change in the ribose phosphate which indicates the level of pentose phosphate pathway is shown in (J), 13C-glucose contribution to biosynthesis of TCA intermediates is shown (K). Changes in the transcript copy number of TCA related genes from RNAseq (L). Changes in the oxygen consumption rate (OCR) (M) and extracellular acidification rate (ECAR) (N) in HUAECs during TGFβ driven EndoMT were analyzed. The data in C, F, G, H, I, J, L, M and N were normalized to those of the non-TGFβ treated control or scramble siRNA–treated cells and are presented as the mean ± SEM from at least three independent experiments. ****P ≤ 0.0001, ***P ≤ 0.001, **P ≤ 0.01, *P ≤ 0.05, NS, not significant.
Figure 2.
Figure 2.. TGFβ regulates PDK4 expression and Ac-CoA synthesis, and increase in endothelial Ac-CoA levels induces EndMT in ACSS2-dependent manner.
A-B, Following 7 days of TGFβ2 stimulation (10ng/ml), the levels of phosphorylated PDHE1α and total PDK4 in HUAECs cell lysates (A) and Ac-CoA level in the cytosol of HUAECs (B) were determined. C-D, Scramble siRNA or PDK4 siRNA were transduced into HUAECs for 7 days, blocking efficiency of PDK4 siRNA and the levels of phosphorylated PDHE1α were analyzed using 20 μg lysate of HUAECs (C). Cytosolic Ac-CoA levels in 1.5 million HUAECs (D). E, Representative blots showing the effect of the PDKs inhibitor, dichloroacetate sodium (DCA) on PDHE1α activity in HUAECs treated with DCA for 3 days. F, Following DCA (10mM) treatment for 7 days, the cytosolic Ac-CoA level in 1.5 million HUAECs were determined. G, Four potential SMAD-binding elements (SBEs, Motif: CAGAC) were identified in the Human PDK4 promoter. H-J, Chromatin immunoprecipitation(CHIP)-QPCR testing of SMAD-2/3 binding to SBEs in Human PDK4 promoter in human umbilical vein endothelial cells (HUVECSs) (H) and HUAECs(I). After 5 days of TGFβ2 stimulation, the direct regulation of PDK4 expression by SMADs was analyzed (J). K-N, Pharmacological inhibition of PDKs and PDK4 knockdown induce EndMT. Cell shape transition of HUAECs after DCA treatment(K) or siRNA mediated PDK4 deficiency (M) for 7 days. Scale Bar: 15 μm. Representative blots showing EndMT markers and EC-specific gene expression in HUAECs treated with DCA(L) or PDK4 siRNA(N) for 7 days. O-P, In HUAECs, the contributions of ACLY(O) and ACSS2(P) to Ac-CoA production. Q, Cytosolic Ac-CoA level were measured in HUAECs transduced with Scramble siRNA, Scramble siRNA + TGFβ2, or ACSS2 siRNA + TGFβ2 respectively. R-S, Blots showing EndMT markers and EC-specific markers in HUAECs treated with Scramble siRNA, Scramble siRNA + TGFβ2, or ACSS2 siRNA + TGFβ2(R) / ACLY siRNA + TGFβ2(S) separately for 7 days. T, Changes of EndMT markers and EC-specific markers were determined in HUAECs treated with Adv-CTL, Adv-CTL + TGFβ2, or Adv-ACSS2-HA + TGFβ2 separately for 3 days. U, Bulk RNA-seq analysis of EndMT markers and EC-specific gene expression in HUAECs under different conditions: Scramble siRNA, Scramble siRNA + TGFβ2, or ACSS2 siRNA + TGFβ2. The data in B, D, F, O, P, and Q were normalized to those of the non-TGFβ treated control or scramble siRNA–treated cells and are presented as the mean ± SEM from at least three independent experiments. **P ≤ 0.01, *P ≤ 0.05, NS, not significant.
Figure 3.
Figure 3.. Endothelial Ac-CoA is largely derived from acetate in an ACLY-independent manner, and acetate drives EndMT.
A, Schematic representation of the stable isotope tracing experimental design. Confluent endothelial colony forming cells (ECFCs) were pre-treated in tracing medium with unlabeled substrates for two hours before being switched to labeled tracing medium. B, Concentration of extracellular 12C-acetate, 13C2-acetate and total acetate (sum of 12C-acetate and 13C2-acetate) when ECFCs were exposed to media containing 100 μM of 13C2-acetate. N=3. C, Acetate uptake over 24 hrs at varying concentrations of 13C2-acetate. Acetate concentration in medium was normalized to packed cell volume in μL. N=3. D, Acetate released (i.e. extracellular 12C-acetate) over 24 hrs at varying concentrations of starting 13C2-acetate. Acetate concentration was normalized to packed cell volume in μL. N=3. E, Measurement of indicated acetate stable isotope in the cell culture medium after incubation with either U-13C-glucose, U-13C-glutamine, 13C2-acetate or U-13C-palmitate for 24 hrs. Only incubation with U-13C-glucose led to appearance of extracellular 13C2-acetate. N=5–6. F, Measurement of glucose-derived acetate release (13C2-acetate from U-13C-glucose) upon ACLY KO with two different sgRNAs over 24 hrs. N=3. Single pair-wise comparison between two groups (C, D, E and F) performed by unpaired, two-tailed Student’s t-test using Prism 9. NS, no significance. **P values < 0.01. ***P values < 0.001. ****P values < 0.0001. G, Percent isotopologue enrichment of acetyl-CoA when ECFCs are exposed to 5 mM U-13C-glucose, 500 μM U-13C-glutamine, 100 μM 13C2-acetate and 100 μM U-13C-palmitate for 24 hours. The enrichment from 13C2-acetate is corrected for label dilution by intracellular acetate release. N=3. H, Percent isotopologue enrichment of acetyl-CoA when ECFCs are exposed to varying concentrations of 13C-acetate over 24 hours. Enrichment from 13C2-acetate is corrected for media label dilution. N=3. I, Same as in (G) but for succinyl-CoA. J, Percent isotopologue enrichment of M+2 acetyl-CoA from 100 μM 13C2-acetate upon ACSS2 KO with two different sgRNAs. Enrichment from 13C2-acetate is corrected for media label dilution. N=3. K, Percent isotopologue enrichment of M+2 acetyl-CoA from 100 μM 13C2-acetate upon ACLY KO with two different sgRNAs. Enrichment from 13C2-acetate is corrected for media label dilution. N=3. L, 13C2-acetate released from U-13C-glucose upon TGFβ2 treatment at time points indicated. Acetate concentration is media was normalized to cell number. N=3. M, Representative blots showing the changes of EndMT markers and EC-specific gene expression in HUAECs treated with acetate for 7 days in a dose-dependent manner. N, Cell shape transition of HUAECs after 5 days treatment of acetate (20mM). Scale Bar: 6 μm. O, Blots showing the subcellular localization and phosphorylation of SAMD2/3 in HUAECs treated with acetate for 7 days. The data in J, K, and L were normalized to those of the non-TGFβ treated control or sg control–treated cells and are presented as the mean ± SEM from at least three independent experiments. ****P ≤ 0.0001, ***P ≤ 0.001.
Figure 4.
Figure 4.. ACSS2-generated Ac-CoA regulates TGFβ signaling.
A-B, Cytosolic and nucleic R-SMADs examined by western blotting (A) and immunostaining (B) in HUAECs treated with Scramble siRNA, Scramble siRNA + TGFβ2, or ACSS2 siRNA + TGFβ2 respectively. Scale Bar: 25 μm. C, Representative blots of nucleic R-SMADs in HUAECs treated with Scramble siRNA, ACLY siRNA, or ACSS2 siRNA separately. D, Representative blots of acetylated R-SMADs in HUAECs transduced with Scramble siRNA or ACSS2 siRNA. Acetylated proteins were captured using agarose beads conjugated with anti-Acetylated lysine antibody, and acetylated R-SMADs (Ac-SMAD2/3/4) were detected using anti-SMAD2/3 antibody and anti-SMAD4 antibody. E, Blots showing the expression of ALK5 in HUAECs transduced with Scramble siRNA or ACSS2 siRNA in the presence of TGFβ2 for 7 days. F, mRNA level of ALK5 in HUAECs under different conditions: Scramble siRNA, Scramble siRNA + TGFβ2, or ACSS2 siRNA + TGFβ2 respectively. G, Blots of ALK5 level in HUAECs following with SMAD2 deficiency for 4 days. H, Blot showing ALK5 level in HUAECs transduced with Scramble siRNA or SMAD4 siRNA for 4 days. I, Representative blots of V5-tagged ALK5 (ALK5-V5) protein level following gradient overexpression of ACSS2-HA in HUAECs using adenoviral strategy(i). J-K, Representative blots of ALK5-V5 in HUAECs transfected with Scramble siRNA or ACSS2 siRNA(J) / PDK4 siRNA(K) separately for 4 days. ALK5-V5 was adenoviral overexpressed in HUAECs on the next day after siRNA transfection.
Figure 5.
Figure 5.. ACSS2-generated Ac-CoA promotes protein stability of ALK5.
ALK5-V5 was adenovirally overexpressed in HUAECs three days before assays. A, Representative blot of acetylated ALK5-V5 in HUAECs treated or non-treated with TGFβ2 (10 ng/ml in complete EGM-2 medium) for 7 days. Acetylated proteins were captured using agarose beads conjugated with anti-Acetylated lysine antibody, and acetylated ALK5-V5 (Ac-ALK5-V5) was detected using anti-V5 tag antibody. B-C, Blots of Ac-ALK5-V5 in HUAECs transduced with Scramble siRNA or PDK4 siRNA(B) / ACSS2 siRNA(C) separately for 7 days. Acetylated proteins were captured and detected as described above. D-E, Half-life of ALK5-V5 in HUAECs transduced with Scramble siRNA or PDK4 siRNA(D) / ACSS2 siRNA (E). ALK5-V5 was adenovirally overexpressed in HUAECs cycloheximide (CHX, 10 μg/ml) treatment at indicated time points. ALK5-V5 protein level was determined by anti-V5 antibody. F-G, Representative blots showing the regulation of ALK5 degradation in HUAECs. HUAECs were first transduced with Scramble siRNA or ACSS2 siRNA, then ALK5-V5 was adenovirally overexpressed in HUAECs followed by treatment with a proteasome inhibitor MG132(F) or a lysosome inhibitor chloroquine (G). H, Diagram for Ac-CoA-regulated ALK5 acetylation results in increased protein half-life due to decreased proteasomal degradation.
Figure 6.
Figure 6.. Immunostaining of ACSS2 in human aorta and mice brachiocephalic trunk and aortic root.
A, ACSS2 expression was studied in human aortas (n=13) from normal organ donors with minimal or moderate atherosclerosis extent. In all cases, ACSS2 expression was examined in relatively normal aortic segments (no/minimal disease) and in segments demonstrating mild/moderate atherosclerosis as judged by the extent of neointima development. ACSS2 expression (red signal), endothelial cells identified with anti-CD31 (green staining), nuclei identified with DAPI (blue). B, Quantification of ACSS2 expression in endothelial cells areas (as indicated with dashed line) from normal/minimal disease and mild/moderate disease specimens. Statistical analysis was performed by unpaired, two-tailed Student’s t-test using Prism 9. **P values < 0.01. Representative frozen sections of the brachiocephalic trunk (C) and aortic root (D) dissected from control ApoE−/− mice after three months of high fat diet were immunostained with anti-CD31 (green), DAPI (blue) and anti-Acss2 (red) antibodies. Merged channels, single channel of Acss22/CD31/DAPI were displayed in grey color. And the area of endothelium was indicated with dashed lines.
Figure 7.
Figure 7.. Reduced development of atherosclerosis following endothelial-specific deletion of Acss2 in ApoE−/− mice.
A, Plaques in aortas of control ApoE−/− mice (♂) and Acss2 iECKO; ApoE−/− mice (♂) were stained with Oil-Red-O. B, Oil-Red-O analysis of whole aortas, aortic arch, thoracic aorta, and abdominal aorta from control (n=10) and Acss2 iECKO; ApoE−/− mice (♂) (n=10). The plaque lesion area and total surface area of aortas were quantified using ImageJ software. A single pair-wise comparison between two groups performed by unpaired, two-tailed Student’s t-test using Prism 9. *P values < 0.05, **P values < 0.01. C, Plaques in aortic roots of control ApoE−/− mice and Acss2 iECKO; ApoE−/− mice were analyzed with H&E staining, Oil-Red-O staining and Masson staining. The area of the plaque per root were quantified. A single pair-wise comparison between two groups performed by unpaired, two-tailed Student’s t-test using Prism 9. ****P values < 0.0001. D-E, total cholesterol level (D) and triglycerides (E) in plasma collected from control ApoE−/− mice and Acss2 iECKO; ApoE−/−mice after 3 months of high fat diet. NS, no significance. F-I, immunostaining of Fibronectin 1 (F), Collagen 1 (G), Vcam1 (H), and CD68 (I) on aortic root sections from both control ApoE−/− mice and Acss2 iECKO; ApoE−/−mice. A single pair-wise comparison between two groups performed by unpaired, two-tailed Student’s t-test using Prism 9. ***P values < 0.001, ****P values < 0.0001. J, Diagram of metabolic reprogramming regulated by TGFβ signaling in EndMT. TGFβ signaling promotes glucose uptake and glycolysis in endothelial cells and increases the activity of pyruvate dehydrogenase complex (PDC) by suppressing PDK4 expression. TGFβ signaling induces glucose conversion to acetate which is then followed by the conversion of acetate to cytosolic acetyl-CoA mediated by ACSS2, ultimately leading to increased activity of R-SMADs and ALK5 subsequently that in turn further promotes TGFβ signaling there by establishing a positive feedback loop. Blocking the acetate conversion to Ac-CoA by ACSS2 knockdown decreased the acetylation of R-SMADs and ALK5 and disrupts TGFβ signaling thereby interrupting in this positive feedback loop.

Comment in

References

    1. Chen PY, Schwartz MA, and Simons M (2020). Endothelial-to-Mesenchymal Transition, Vascular Inflammation, and Atherosclerosis. Front Cardiovasc Med 7, 53. 10.3389/fcvm.2020.00053. - DOI - PMC - PubMed
    1. Dejana E, Hirschi KK, and Simons M (2017). The molecular basis of endothelial cell plasticity. Nature communications 8, 14361. 10.1038/ncomms14361. - DOI - PMC - PubMed
    1. Kovacic JC, Dimmeler S, Harvey RP, Finkel T, Aikawa E, Krenning G, and Baker AH (2019). Endothelial to Mesenchymal Transition in Cardiovascular Disease: JACC State-of-the-Art Review. Journal of the American College of Cardiology 73, 190–209. 10.1016/j.jacc.2018.09.089. - DOI - PMC - PubMed
    1. Piera-Velazquez S, and Jimenez SA (2019). Endothelial to Mesenchymal Transition: Role in Physiology and in the Pathogenesis of Human Diseases. Physiological reviews 99, 1281–1324. 10.1152/physrev.00021.2018. - DOI - PMC - PubMed
    1. Di Benedetto P, Ruscitti P, Berardicurti O, Vomero M, Navarini L, Dolo V, Cipriani P, and Giacomelli R (2021). Endothelial-to-mesenchymal transition in systemic sclerosis. Clinical and experimental immunology 205, 12–27. 10.1111/cei.13599. - DOI - PMC - PubMed

Publication types

MeSH terms

Substances