

doi: 10.1038/s41467-023-38958-9.
Signaling mechanisms in renal compensatory hypertrophy revealed by multi-omics
Affiliations
- PMID: 37328470
- PMCID: PMC10276015
- DOI: 10.1038/s41467-023-38958-9
Item in Clipboard
Signaling mechanisms in renal compensatory hypertrophy revealed by multi-omics
Nat Commun.
.
Abstract
Loss of a kidney results in compensatory growth of the remaining kidney, a phenomenon of considerable clinical importance. However, the mechanisms involved are largely unknown. Here, we use a multi-omic approach in a unilateral nephrectomy model in male mice to identify signaling processes associated with renal compensatory hypertrophy, demonstrating that the lipid-activated transcription factor peroxisome proliferator-activated receptor alpha (PPARα) is an important determinant of proximal tubule cell size and is a likely mediator of compensatory proximal tubule hypertrophy.
© 2023. The Author(s).
Conflict of interest statement
The authors declare no competing interests.
Figures
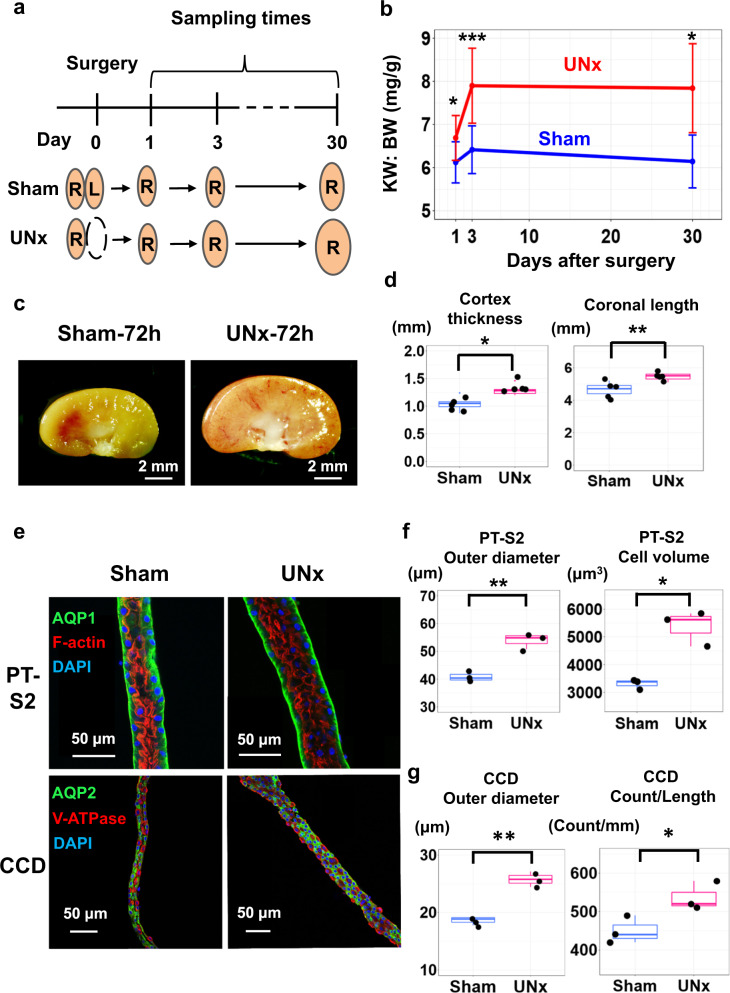
a Sample collection protocol. R, right kidney; L, left kidney. b Time course of kidney growth. (n = 11 for sham-day 1, n = 12 for sham-day 3, n = 5 for sham-day 30, n = 9 for UNx-day 1, n = 15 for UNx-day 3, n = 5 for UNx-day 30). Data are presented as mean ± SD. KW, kidney weight; BW, body weight. *P < 0.05; ***P < 0.001 (two-sided Student’s t test). c Representative kidney images for Sham and UNx mice 3 days after surgery. d Kidney size parameters. Data are presented as mean ± SD. *p < 0.05, **p < 0.01 (Cortex: p = 0.011, Coronal: p = 0.005, two-sided Student’s t test). e Representative confocal fluorescence images of microdissected proximal tubules (S2 segment, PT-S2) and cortical collecting ducts (CCD) from Sham and UNx mice. PT-S2, straight part of proximal tubule obtained from medullary ray in cortex region. Representative images were selected from n = 3 sham vs. UNx sets. f Size metrics for PT-S2 as calculated by IMARIS image analysis software. PT measurements of tubule outer diameter and cell volumes were significantly elevated in UNx (pink) vs. Sham (blue) samples. Morphometry method described in Supplementary Fig. 1e. Data are presented as mean ± SD. **p = 0.003, *p = 0.031, two-sided Student’s t test. Box-and-whisker plots represent median and 25th and 75th percentiles-interquartile range; IQR and whiskers extend to maximum and minimum values. g Size metrics for CCD as calculated by IMARIS image analysis software. Morphometry described in Supplementary Fig. 1e. **p = 0.0015, *p = 0.033, two-sided Student’s t test. Box-and-whisker plots as in (f).
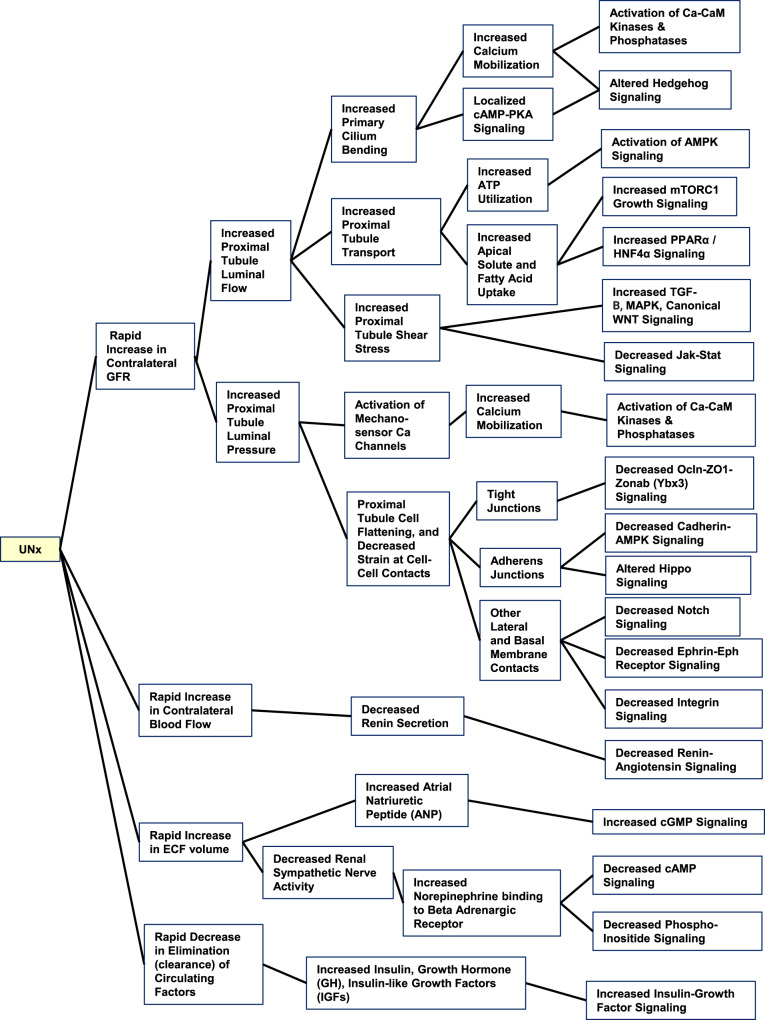
These hypotheses summarize signaling pathways known to mediate responses to mechanical or metabolic signals likely to be triggered by loss of one kidney. (See also Supplementary Discussion 1 and Supplementary Data 4). UNx unilateral nephrectomy, GFR glomerular filtration rate, ECF extracellular fluid, Ca calcium, CaM calmodulin, TGF transforming growth factor, OCLN occludin.
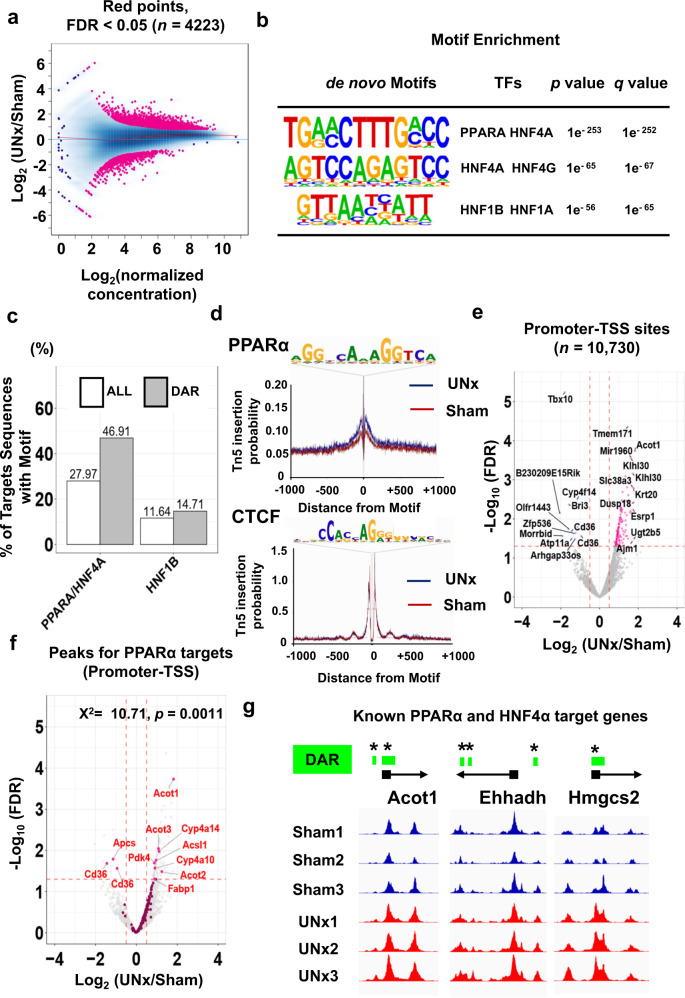
a Ratio-intensity plot. Points represent peak regions determined by MACS2 for individual peaks. The x-axis represents average signal intensity within the region, and the y-axis represents log2 ratio of Sham and UNx signals. Red line is Loess fit. Among the 125,973 open chromatin regions identified among all samples, 4223 were identified as differentially accessible sites (FDR < 0.05, highlighted in magenta). (n = 3 for each group) b HOMER analysis identifies the enriched TF binding motifs in chromatin regions that are more accessible in UNx vs Sham (applying cumulative hypergeometric distribution adjusted for multiple testing with the Benjamini-Hochberg method) (See also Supplementary Data 5 for all results). c Percentages of motif sequences in all peaks (white) or in differentially accessible regions (grey) for the PPARα/HNF4α target motif and the HNF1B target motif. d Transcription factor foot-printing profiles generated using all identified ATAC-seq peaks for PPARα and CTCF (negative control) for microdissected PT-S1 to quantitate Tn5 insertion enrichment in the UNx vs. sham. e Volcano plot indicating peaks of chromatin accessibility within annotated promoter-TSS regions. Magenta points, increased accessibility in the UNx vs Sham treatment (FDR < 0.05 and log2(UNx/Sham)> 0.5). Blue points, decreased accessibility (FDR < 0.05 and log2(UNx/Sham) < −0.5). Chromatin accessible regions with top 10 or bottom 10 log2(UNx/Sham) values annotated by nearest gene name. f Volcano plot indicating chromatin accessibility at promoter regions near annotated TSS. Magenta points, PPARα target regions. Target genes for PPARα are listed in Supplementary Data 7. g Examples of ATAC-seq peaks for known PPARα and HNF4α target genes, each showing differences in peak heights between UNx and Sham treatments at their promoter-TSS regions (highlighted in green; DAR, differentially accessible region, vertical axes are of equal length). All data are available on a genome browser at https://esbl.nhlbi.nih.gov/IGV_mo/ and a Shiny-based web page (https://esbl.nhlbi.nih.gov/UNx/ ). * FDR < 0.05 (Benjamini and Hochberg method, adjusted p values are provided in Supplementary Data 6).
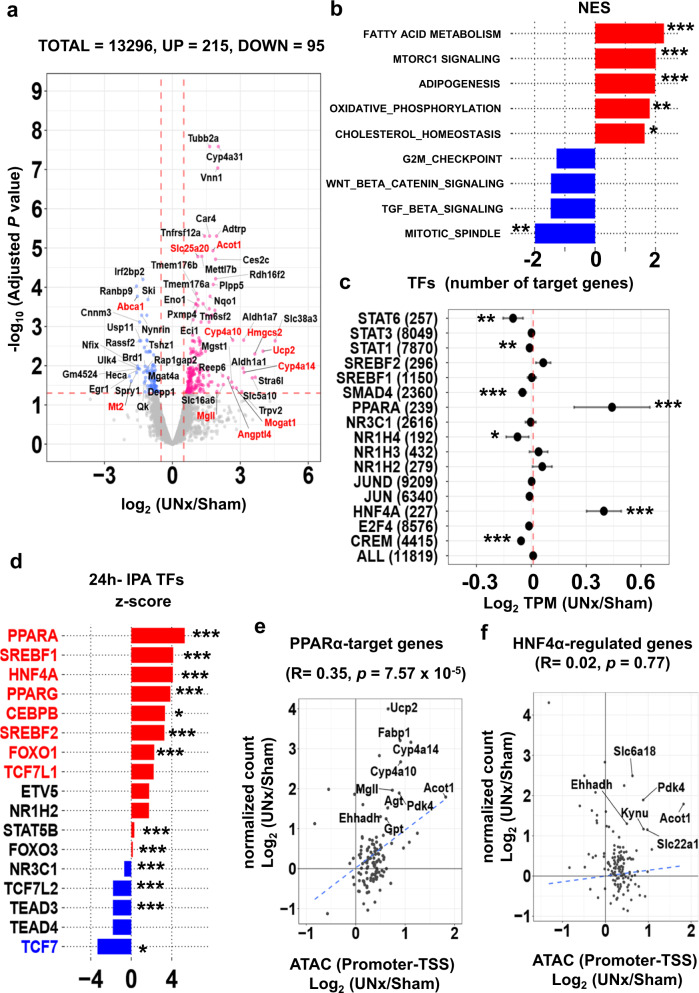
a Volcano plot. Magenta points, significantly increased expression. Blue points, significantly decreased expression. Significant differential expression was determined using thresholds of padj < 0.05 and |log2(UNx/Sham)| > 0.5. Red font, genes known to be regulated by PPARα. (n = 3 for Sham, n = 4 for UNx). b Top-ranked Hallmark Pathway gene sets determined using Gene Set Enrichment Analysis (GSEA). Normalized enrichment score (NES) was calculated using PT-S1 differentially expressed genes for UNx vs. Sham treatments at 24 h post-surgery. *p < 0.05, **p < 0.01, ***p < 0.001 (weighted Kolmogorov–Smirnov test, p values are provided in Supplementary Table 2). c Target gene set analysis for TFs listed in Supplementary Table 1 at 24 h after UNx. Log2(UNx/Sham) values were plotted for members of curated target gene sets. Error bars indicate 95% confidence interval. The measure of center for the error bars is the averages of log2 ratios (UNx/Sham) of TPM values (in RNA-seq) for TF-target gene sets. The gene sets were listed in Supplementary Data 6. *p < 0.05, **p < 0.01, ***p < 0.001 (un-paired, two-tailed Student’s t-test, specific p values provided in Supplementary Data 8.) (n = 3 for Sham, n = 4 for UNx). d Prediction of upstream regulatory transcription factors using Ingenuity Pathway Analysis (IPA). Predictions performed using differentially expressed genes in UNx vs. Sham treatments at 24 h. Genes with normalized z-scores larger than 2, red; those with normalized z-scores less than −2, blue. *p < 0.05, **p < 0.01, ***p < 0.001. Fisher’s exact test (specific p values provided in Supplementary Data 10). e, f Correlation between gene expression and chromatin accessibility (UNx vs. sham treatments) for PPARα target genes (e) and for HNF4α target genes (f) at 24 h timepoint. *p < 0.05, **p < 0.01, ***p < 0.001 (Pearson’s correlation). TSS, transcription start site. Significant correlation was assessed with Pearson’s product moment correlation coefficient using the stat_cor function (method = Pearson, two-sided) in R.
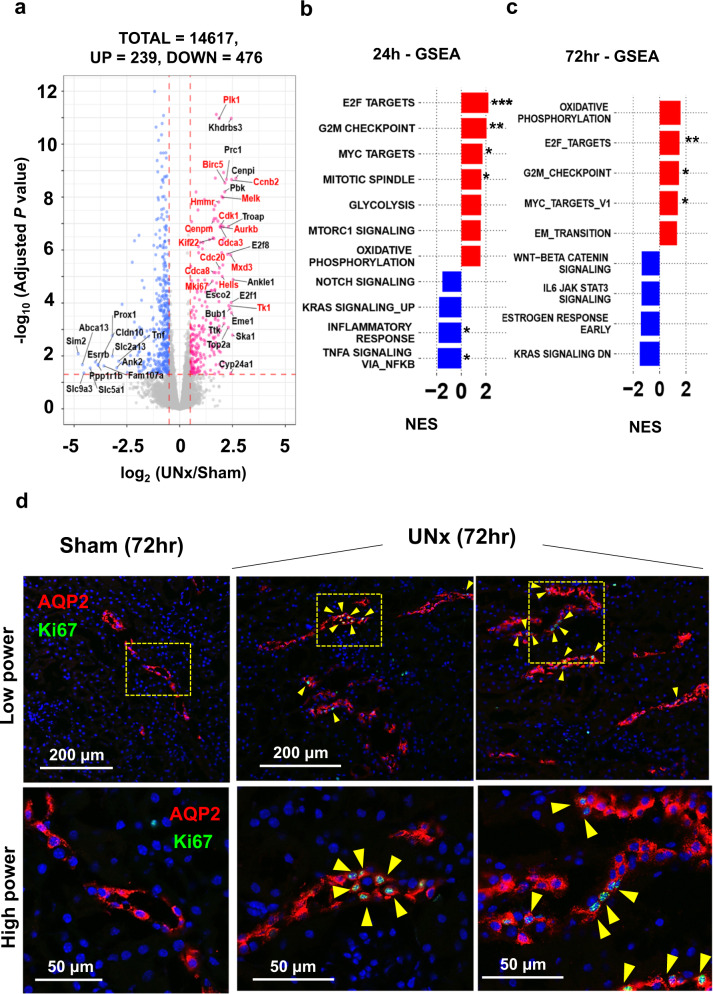
a Volcano plot for UNx vs. Sham. Magenta points, significantly increased expression. Blue points, significantly decreased expression. Significant differential expression was determined using thresholds of padj < 0.05 and |log2(UNx/Sham)| > 0.5. Known E2F targets highlighted in red font. (n = 4 for Sham, n = 3 for UNx). b, c Top-ranked Hallmark Pathway gene sets determined using Gene Set Enrichment Analysis (GSEA). Normalized enrichment score (NES) calculated using CCD differentially expressed genes for UNx vs. Sham treatments at 24-h post-surgery (b) and at 72-h post-surgery (c). *p < 0.05, **p < 0.01, ***p < 0.001 (weighted Kolmogorov–Smirnov test, p values are provided in Supplementary Table 3). d Immunofluorescence labeling of mouse renal cortex 72 h after Sham or UNx. Labelling for aquaporin-2 (AQP2; red) identifies collecting ducts. Ki67 (green) identifies dividing cells (yellow arrows). Representative images were selected from Sham (n = 8) and from UNx (n = 7) biological replicates.
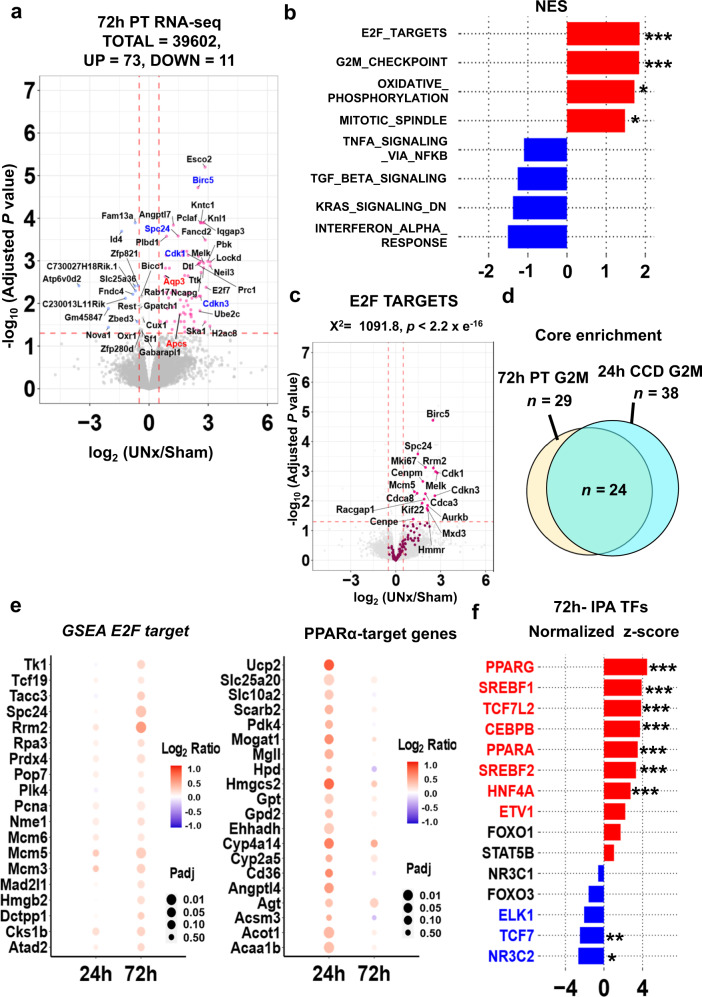
a Volcano plot. Magenta points, significantly increased expression. Blue points, significantly decreased expression. Significant differential expression was determined using thresholds of padj < 0.05 and |log2(UNx/Sham)| > 0.5. Genes known to be regulated by PPARα in red font. Cell-cycle regulated genes highlighted in blue font. (n = 5 for both UNx and Sham). b Top-ranked Hallmark Pathway gene sets from Gene Set Enrichment Analysis (GSEA) in PT-S1 NES, normalized enrichment score. *p < 0.05, **p < 0.01, ***p < 0.001 (weighted Kolmogorov–Smirnov test; p values are provided in Supplementary Table 2). c Volcano plot with magenta points indicating E2F target genes (GSEA), which were significantly enriched based on Chi-squared analysis. d Venn diagram of genes annotated as “G2M_CHECKPOINT” that were enriched in proximal tubule RNA-seq dataset at 72-h and in cortical collecting duct RNA-seq datasets at 24-h. e Bubble plots showing differential changes between the 24 h and 72 h time points for E2F target genes and for PPARα target genes. Adjusted p values (Benjamini and Hochberg method) are visualized in circle size, and log2 ratios are visualized in color. f Prediction of upstream regulatory transcription factors using Ingenuity Pathway Analysis (IPA). Predictions based on differentially expressed genes in UNx vs. Sham at 72 h. Genes with normalized z-score more than 2 are colored in red, and with normalized z-score less than −2 are colored in blue. *p < 0.05, **p < 0.01, ***p < 0.001 (right-tailed Fisher’s Exact Test, p values are provided in Supplementary Data 15).
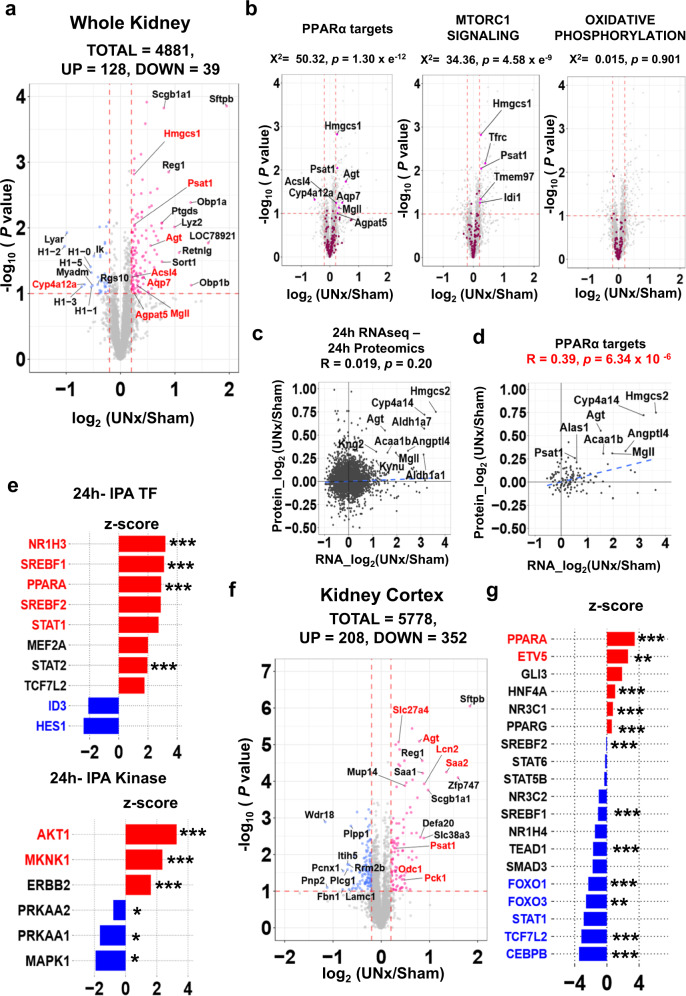
Data from TMT-based quantitative proteomics using LC-MS/MS) of whole kidney from mice with either Sham (n = 4) or UNx (n = 4) surgery. a Volcano plot. Red, upregulated in UNx (p < 0.1 and log2 (UNx/Sham) > 0.2); blue, proteins downregulated in UNx (p < 0.1 and log2 (UNx/Sham) < −0.2). PPARα regulated proteins are highlighted in red font. b Volcano plots for the proteins known to be regulated by PPARα, and the proteins annotated as “MTORC1_SIGNALING” and “OXIDATIVE_PHOSPHORYLATION” in GSEA. (indicated by magenta points in respective plots). p-value represents the likelihood of enrichment of respective gene sets among regulated peaks using Chi-squared analysis. c Log2 of the abundance ratio of all identified proteins plotted against log2 of the abundance ratio of transcripts identified in proximal tubule 24 h RNA-seq. Blue dashed line shows best-fit linear correlation (Pearson’s product moment correlation coefficient using the stat_cor function in R). d Log2 of the protein abundance ratio of PPARα target proteins plotted against log2 of the mRNA abundance ratio of PPARα target genes at the 24-h timepoint. Blue dashed line shows best-fit linear correlation (Pearson’s product moment correlation coefficient using the stat_cor function in R). e Prediction of upstream regulatory transcription factors (top) and kinases (bottom) determined using Ingenuity Pathway Analysis (IPA). (Fisher’s Exact Test, p values are provided in Supplementary Data 17). f Volcano plot for cortical samples. Sham (n = 5) or UNx (n = 5) surgery. Red dots, proteins upregulated in UNx (p < 0.1 and log2 (UNx/Sham) > 0.2); blue dots, proteins downregulated in UNx (p < 0.1 and log2 (UNx/Sham) < −0.2). PPARα-regulated proteins highlighted in red font. g Prediction of upstream regulatory transcription factors using Ingenuity Pathway Analysis (IPA) based on kidney cortex proteomics. *p < 0.05, **p < 0.01, ***p < 0.001 (Fisher’s Exact Test, p values are provided in Supplementary Data 19).
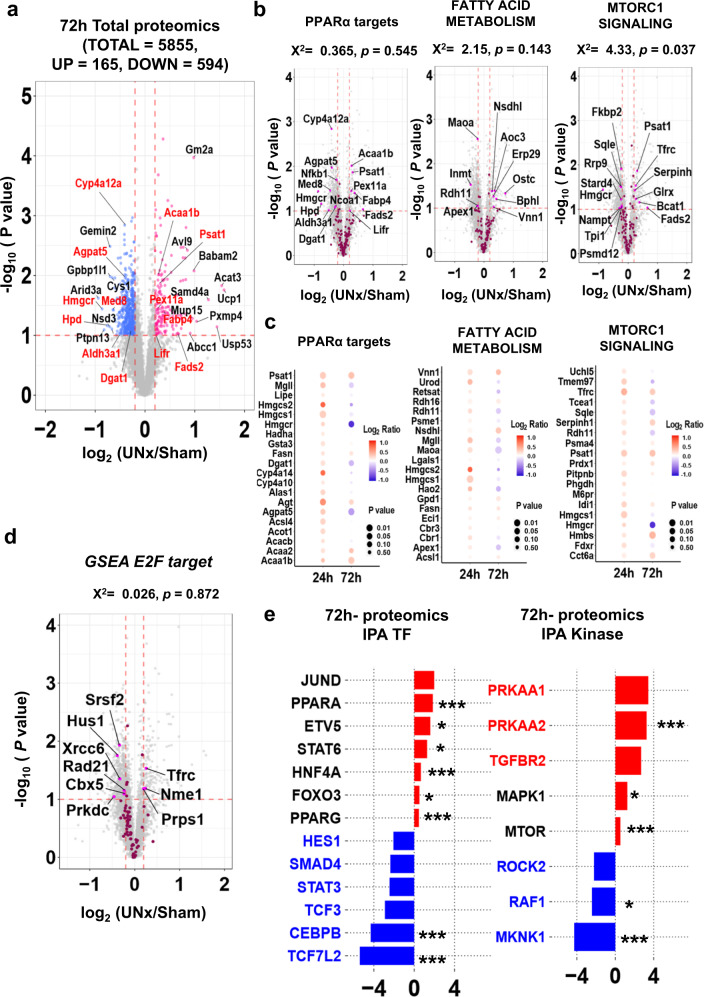
a Volcano plot for UNx vs. Sham. TMT-based quantitative proteomics LC-MS/MS of whole kidneys from mice with either Sham (n = 4) or UNx (n = 4) surgery. Red dots, upregulated proteins upregulated in UNx (p < 0.1 and log2 (UNx/Sham) > 0.2); blue dots, downregulated proteins in UNx (p < 0.1 and log2 (UNx/Sham) < −0.2). PPARα regulated proteins in red font. b Volcano plots highlighting proteins known to be regulated by PPARα, and proteins with roles in “FATTY ACID METABOLISM” and “MTORC1_SIGNALING” in GSEA indicated by magenta points. p-values associated with enrichment of respective gene sets (Chi-squared analysis). c Bubble plots showing differential changes of proteins between the 24 h and 72 h time points for the proteins regulated by PPARα, and for the proteins annotated as “FATTY ACID METABOLISM” and “MTORC1_SIGNALING” in GSEA. P values (unpaired, two-tailed t-test) are visualized by circle size, and log2 ratios are visualized by color. d Volcano plot for the proteins annotated as “E2F TARGET” in GSEA. Magenta points, known E2F targets. Significant differential abundance was determined using thresholds of p < 0.1 (unpaired, two-tailed T-test) and|log2 (UNx/Sham)| > 0.2. p-value represents the likelihood of E2F target protein enrichment among regulated peaks using Chi-squared analysis. e Prediction of upstream regulatory transcription factors (left) and kinases (right) determined using Ingenuity Pathway Analysis (IPA) at 72 h. *p < 0.05, **p < 0.01, ***p < 0.001 (Fisher’s Exact Test, p values are provided in Supplementary Data 21).
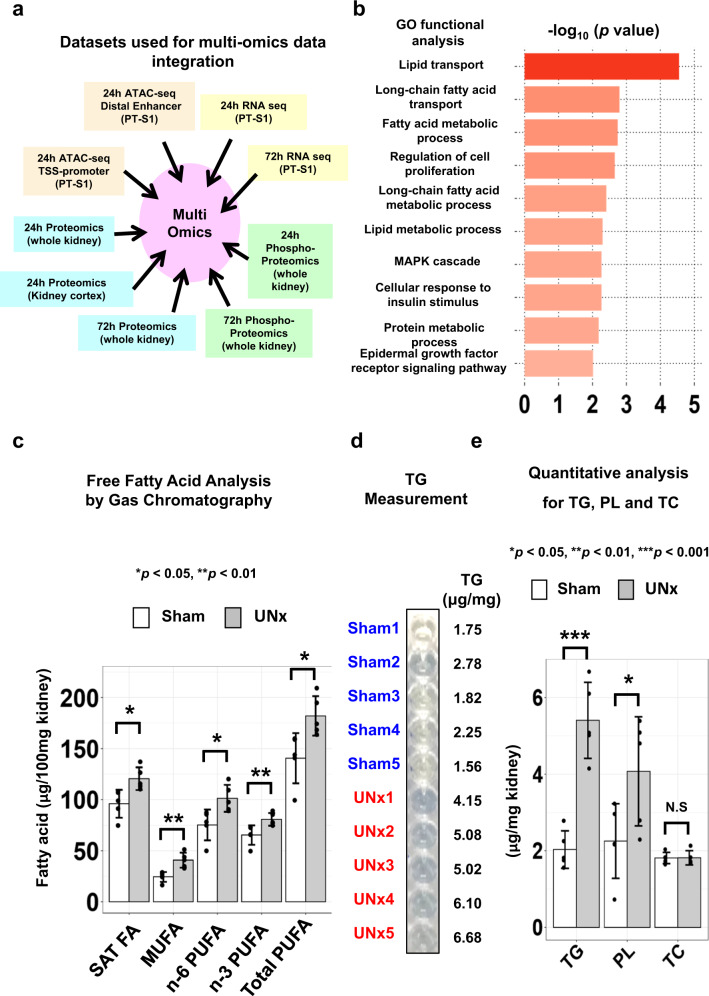
a Datasets used for multi-omics data integration using DAVID. b GO functional enrichment in biological process using output from data integration. The selected 10 significantly enriched GO biological process terms relevant to original hypothesis proposed in Fig. 2 and Supplementary Data 4. (p < 0.05, Fisher’s Exact test, p values are provided in Supplementary Data 25). GO gene ontology. c Concentrations of total saturated fatty acids (SAT FA, p = 0.013), monounsaturated fatty acids (MUFA, p = 0.007), n-6 and n-3 poly unsaturated fatty acid (PUFA, p = 0.015, p = 0.008), and total PUFA (p = 0.012) in Sham (n = 5) versus UNx (n = 5), analyzed by gas chromatography in kidney tissue. Data are presented as mean ± SD. *p < 0.05, **p < 0.01 (unpaired, two-tailed T-test). d Representative image of colorimetric assay for triglycerides comparing sham and UNx samples. Uncropped image is provided as a Source Data file. e Concentration of triglycerides (TG, p = 0.00013), phospholipid (PL, p = 0.046) and total cholesterol (TC, p = 0.976) by colorimetric quantitative analysis in kidney tissue from UNx (n = 5) vs. Sham (n = 5). Data are presented as mean ± SD. *p < 0.05, **p < 0.01, ***p < 0.001 (unpaired, two-tailed T-test).
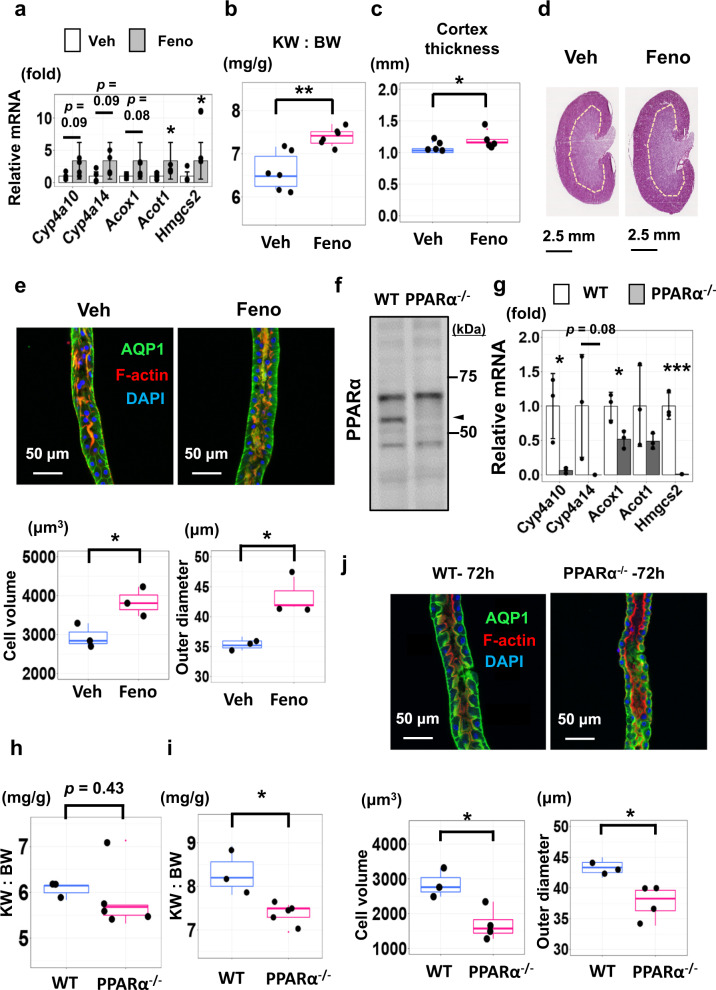
a Expression of PPARα target genes in the kidney determined using qRT-PCR. Fenofibrate (Feno, grey) vs vehicle (Veh, white). Mean ± SD (n = 4). b KW:BW ratios in mice treated with fenofibrate (Feno) or vehicle (Veh) for 14 days. (n = 6 for each group). **p = 0.0018, unpaired, two-sided student t-test. c Cortical thickness of the kidneys in mice treated with fenofibrate versus vehicle (n = 5 for vehicle, n = 6 for fenofibrate). *p = 0.0013. d Hematoxylin and eosin stained kidneys from mice treated with vehicle (Veh) or fenofibrate (Feno) for 14 days. e Upper; representative confocal fluorescence image of a microdissected proximal tubules (S2 segment, PT). Lower; cell volume (left) and tubular outer diameter (right) with fenofibrate versus vehicle (n = 3 for each group). *p < 0.05 (Cell volume: p = 0.034, Outer diameter: p = 0.010). f Western blot for PPARα (nuclear protein fractions from wild-type versus PPARα−/− kidneys). Arrowhead, expected molecular weight. Data are representative of biological replicates (n = 7 for wild-type, n = 9 for PPARα−/−). Source data are provided as a Source Data file. g Expressions of PPARα target genes in wild-type (WT, white) or PPARα−/− (grey) mice (qRT-PCR). Mean ± SD (n = 3). h KW:BW in WT and PPARα−/− mice for the resected left kidney at UNx surgery; n = 3 for WT, n = 5 for PPARα−/−. (p = 0.43, unpaired, two-sided student t-test). i KW:BW ratios in WT and PPARα−/− mice for the remnant kidney 3 days after UNx surgery. n = 3 for WT, n = 5 for PPARα−/−. *p = 0.015. (unpaired, two-sided student t-test). j Upper; representative confocal fluorescence images of a microdissected proximal tubule (S2 segment) from WT and PPARα−/− mice 3 days after UNx surgery. Lower; cell volume (left), tubular outer diameter (right) in PPARα−/− versus WT mice. n = 3 for WT, n = 4 for PPARα−/−. *p < 0.05. (Cell volume: p = 0.019, Outer diameter: p = 0.028, unpaired, two-sided student T-test). Box-and-whisker plots represent median and 25th and 75th percentiles-interquartile range.
References
-
- Fine LG, Bradley T. Adaptation of proximal tubular structure and function: insights into compensatory renal hypertrophy. Fed. Proc. 1985;44:2723–2727. - PubMed
Publication types
MeSH terms
Grants and funding
LinkOut - more resources
Full Text Sources
Molecular Biology Databases
