. 2023 Jun 16;13(1):9797.
doi: 10.1038/s41598-023-36704-1.

Analysis of gut microbiota in patients with Williams-Beuren Syndrome reveals dysbiosis linked to clinical manifestations

Affiliations

Analysis of gut microbiota in patients with Williams-Beuren Syndrome reveals dysbiosis linked to clinical manifestations

Federica Del Chierico et al. Sci Rep. .

Abstract

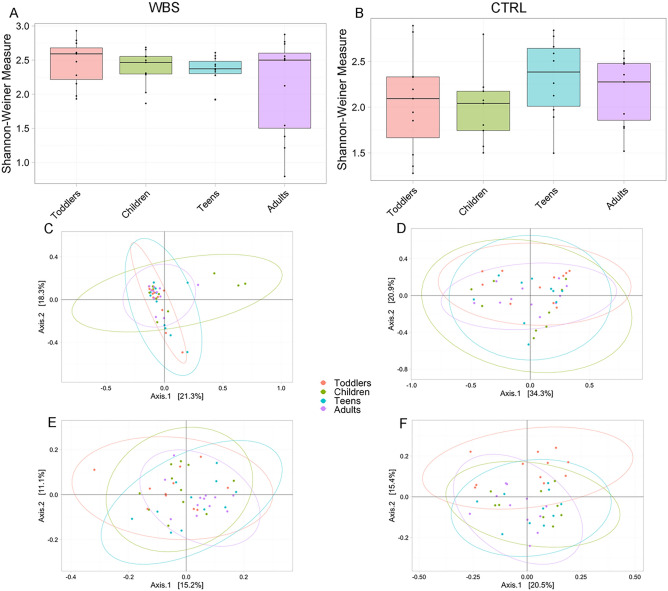
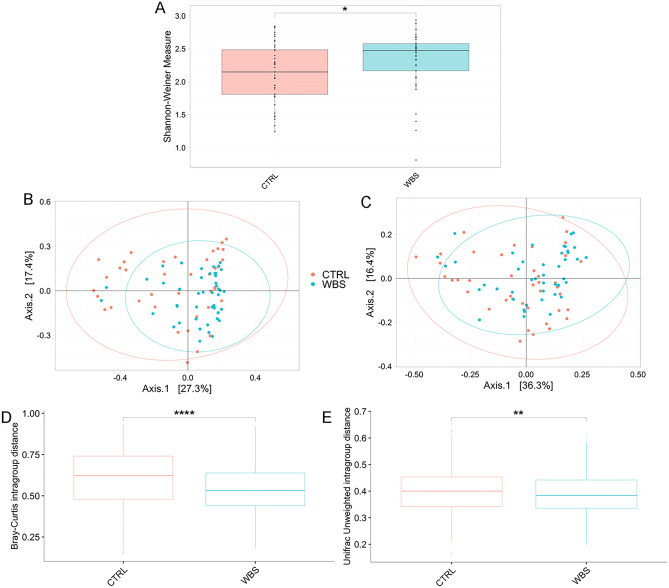
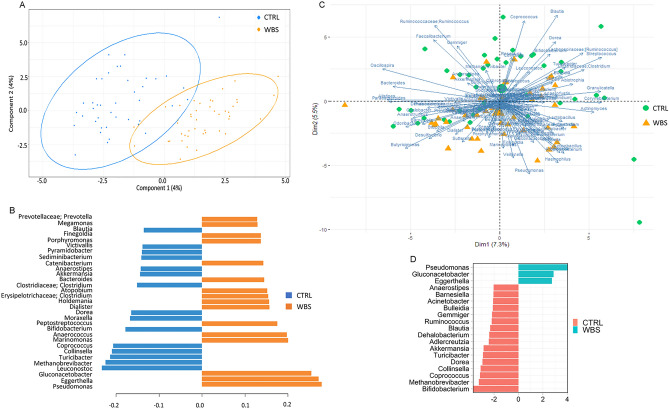
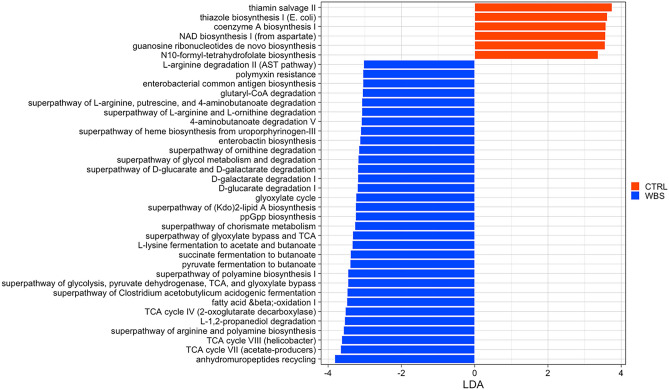
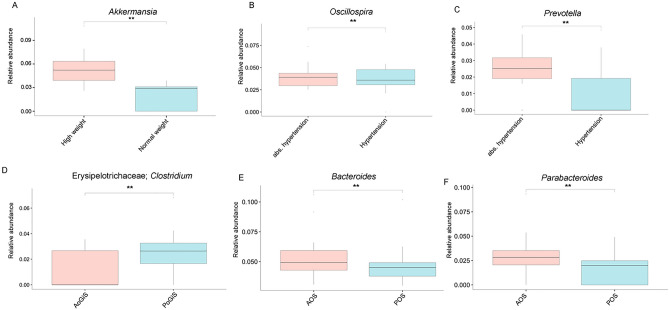
Williams-Beuren syndrome (WBS) is a multisystem genetic disease caused by the deletion of a region of 1.5-1.8 Mb on chromosome 7q11.23. The elastin gene seems to account for several comorbidities and distinct clinical features such including cardiovascular disease, connective tissue abnormalities, growth retardation, and gastrointestinal (GI) symptoms. Increasing evidence points to alterations in gut microbiota composition as a primary or secondary cause of some GI or extra-intestinal characteristics. In this study, we performed the first exploratory analysis of gut microbiota in WBS patients compared to healthy subjects (CTRLs) using 16S rRNA amplicon sequencing, by investigating the gut dysbiosis in relation to diseases and comorbidities. We found that patients with WBS have significant dysbiosis compared to age-matched CTRLs, characterized by an increase in proinflammatory bacteria such as Pseudomonas, Gluconacetobacter and Eggerthella, and a reduction of anti-inflammatory bacteria including Akkermansia and Bifidobacterium. Microbial biomarkers associated with weight gain, GI symptoms and hypertension were identified. Gut microbiota profiling could represent a new tool that characterise intestinal dysbiosis to complement the clinical management of these patients. In particular, the administration of microbial-based treatments, alongside traditional therapies, could help in reducing or preventing the burden of these symptoms and improve the quality of life of these patients.


Conflict of interest statement

The authors declare no competing interests.

Figures

Figure 1
Figure 1
Ecological analyses of WBS and CTRL stratified by age groups. Alpha diversity analysis (A and B). Box plots show the Shannon-Weiner index of WBS and CTRL groups based on their age’s classes. In box plot the values of median, first and third quartiles, minimum and maximum values of Shannon index for each group are reported. Statistical test is performed by Kruskal–Wallis test (p-adj values > 0.05). Beta-diversity analyses. Principal Coordinates Analysis (PCA) plots of Bray Curtis dissimilarity (C and D) and Unweighted UniFrac phylogenetic distance matrices (E and F). Each ellipse represents the 95% confidence interval of standard error. The PERMANOVA test applied on Bray–Curtis dissimilarity reveals the absence of a statistically significant dissimilarity amongst age groups (WBS p value = 0.11, CTRL p value = 0.11). The PERMANOVA test applied on Unweighted UniFrac reveals a statistically significance (WBS p value = 0.02, CTRL p value = 0.04). The ANOSIM test on Bray–Curtis confirms the similarity amongst the age groups (WBS: R-value = 0.02, p value = 0.21; CTRL: R value = 0.06, p value = 0.08). The same analysis performed on Unweighted UniFrac matrices results not statistically significant for WBS (R = 0.03; p value = 0.09) while statistically significant for CTRLs (R-value = 0.09; p value = 0.01).
Figure 2
Figure 2
Ecological analyses of WBS and CTRL. Alpha diversity analysis (A). Box plots show the Shannon-Weiner index of WBS and CTRL. In box plot the values of median, first and third quartiles, minimum and maximum values of Shannon index for both groups are reported. Beta-diversity analyses. Principal Coordinates Analysis (PCA) plots of Bray Curtis dissimilarity (B) and Unweighted UniFrac phylogenetic distance matrices (C). Each ellipse represents the 95% confidence interval of standard error. The PERMANOVA and ANOSIM tests applied on β-diversity matrices reveal the statistically significant dissimilarity between WBS and CTRLs (Bray–Curtis matrix: PERMANOVA p value = 0.002; ANOSIM: R value = 0.10, p value = 0.001; unweighted UniFrac matrix: PERMANOVA p value = 0.001; ANOSIM R value = 0.14; p value = 0.001). Intragroup distances calculation. Box plots of intragroup distances calculated on (D) Bray–Curtis and (E) Unweighted UniFrac distances. Statistically significant comparisons by Wilcoxson test are indicated by asterisk (*p-adj ≤ 0.05; **p-adj ≤ 0.01; ****p-adj ≤ 0.0001).
Figure 3
Figure 3
Compositional analyses at the genus level of WBS and CTRL. (A) Partial least squares discriminant analysis (PLS-DA) plot; (B), plot of loading variables, filtered for loading coefficient > 0.1. The Root Mean Square Error (RMSE) = 0.24 indicates a good accuracy in classification’s prediction; (C), Principal component analysis (PCA) plot. More the loadings are distant from the origin, more they influence the model. The loadings separated by a small angle show a positive correlation; the loadings separated by a large angle have a negative correlation, and those with a right angle indicate no correlation. (D), Univariate ANCOM-BC plot.
Figure 4
Figure 4
Microbial functional profiling. Linear discriminant analysis (LDA) effect size (LEfSe) was performed on the PICRUSt2 predicted biochemical pathways matrix. The reported pathways were filtered for statistically significance and LDA ± 3.0.
Figure 5
Figure 5
Compositional analyses at genus level of patients stratified for weight‐related and clinical features. Box plots indicate the median abundances and interquartile ranges of the taxa resulted statistically significant by ANCOM-BC test (*p-adj ≤ 0.05; **p-adj ≤ 0.01;). (A) comparisons between WBS normal weight and high weight; (B and C) comparisons between patients stratified for the presence of hypertension or not (abs. hypertension); (D) for absence (AoGiS) or presence of gastrointestinal symptoms (PoGiS) (constipation or diarrhoea); (E and F) for absence (AOS) or presence of at least 1 gastrointestinal symptom (POS) (gastroesophageal reflux disease, diarrhoea, constipation, abdominal pain).

References

    1. Twite MD, Stenquist S, Ing RJ. Williams syndrome. Pediatr. Anaesth. 2019;29:483–490. doi: 10.1111/pan.13620. - DOI - PubMed
    1. Adams GN, Schmaier AH. The Williams-Beuren syndrome—A window into genetic variants leading to the development of cardiovascular disease. PLoS Genet. 2012;8:e1002479. doi: 10.1371/journal.pgen.1002479. - DOI - PMC - PubMed
    1. Strømme P, Bjømstad PG, Ramstad K. Prevalence estimation of williams syndrome. J. Child Neurol. 2002;17:269–271. doi: 10.1177/088307380201700406. - DOI - PubMed
    1. Williams JCP, Barratt-Boyes BG, Lowe JB. Supravalvular aortic stenosis. Circulation. 1961;24:1311–1318. doi: 10.1161/01.CIR.24.6.1311. - DOI - PubMed
    1. Beuren AJ, Apitz J, Harmjanz D. Supravalvular aortic stenosis in association with mental retardation and a certain facial appearance. Circulation. 1962;26:1235–1240. doi: 10.1161/01.CIR.26.6.1235. - DOI - PubMed

Publication types

MeSH terms

Substances