. 2023 Jun 16;13(1):9754.
doi: 10.1038/s41598-023-36833-7.

CXCL10 as a shared specific marker in rheumatoid arthritis and inflammatory bowel disease and a clue involved in the mechanism of intestinal flora in rheumatoid arthritis

Affiliations

CXCL10 as a shared specific marker in rheumatoid arthritis and inflammatory bowel disease and a clue involved in the mechanism of intestinal flora in rheumatoid arthritis

Yin Guan et al. Sci Rep. .

Abstract

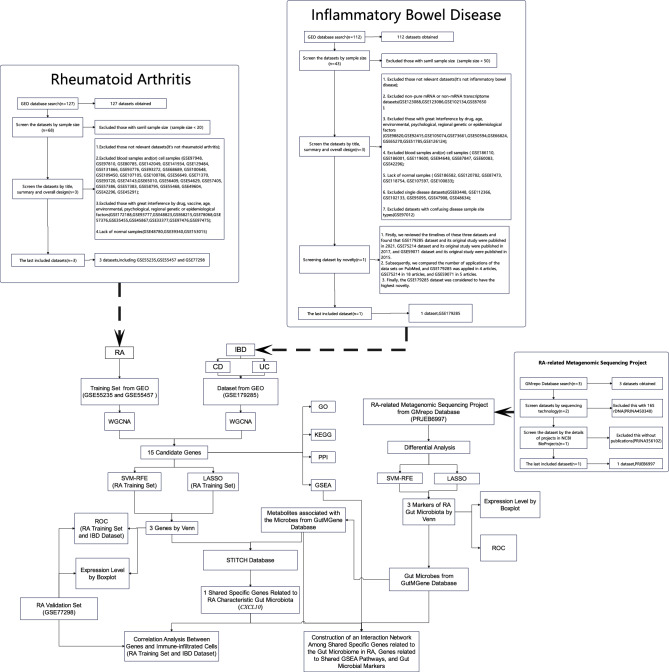
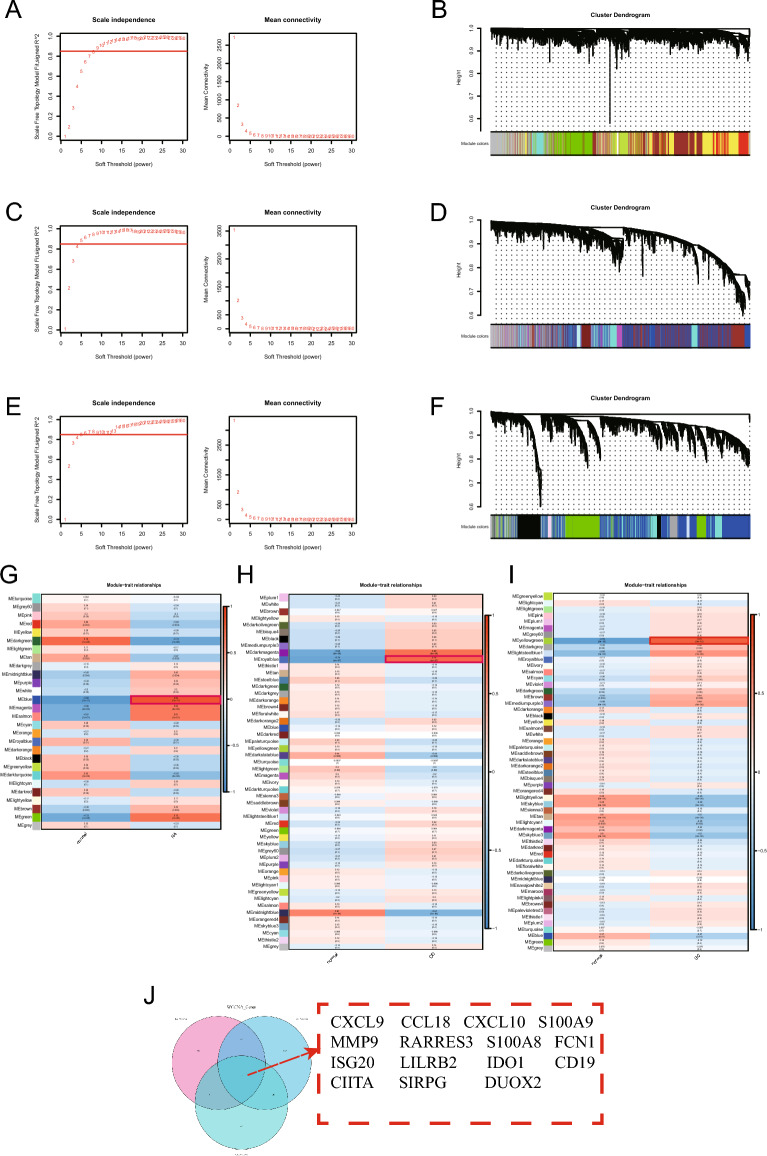
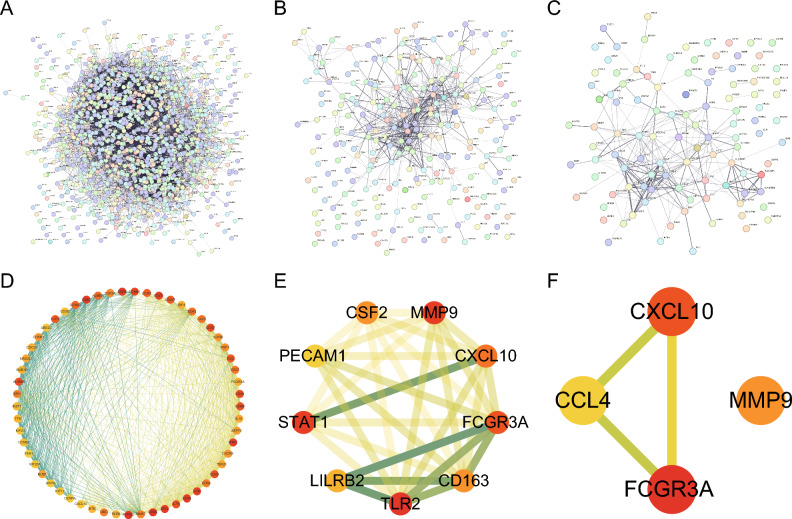
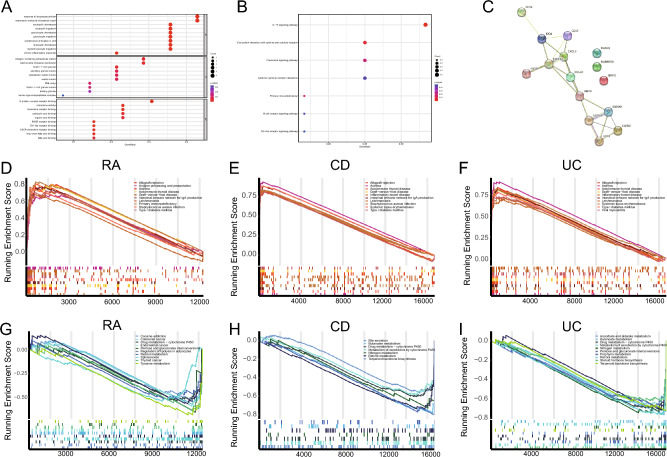
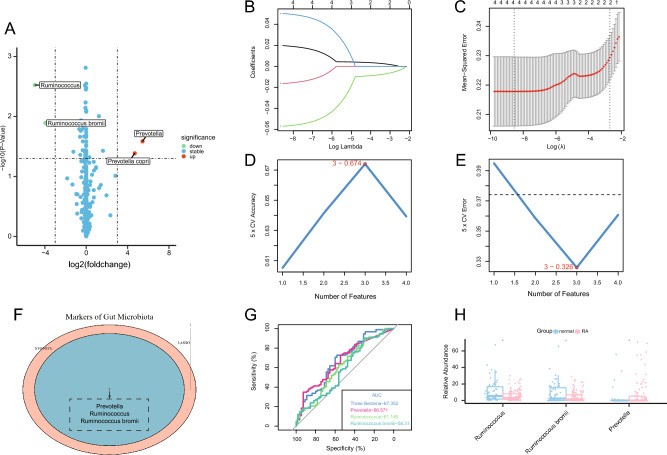
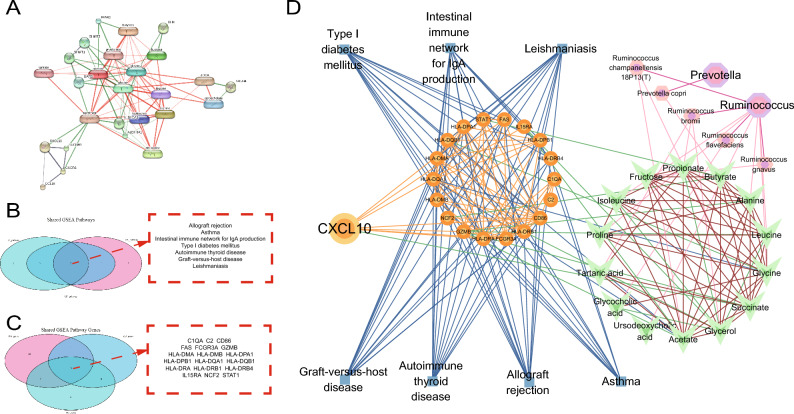
This study aimed to identify shared specific genes associated with rheumatoid arthritis (RA) and inflammatory bowel disease (IBD) through bioinformatic analysis and to examine the role of the gut microbiome in RA. The data were extracted from the 3 RA and 1 IBD gene expression datasets and 1 RA gut microbiome metagenomic dataset. Weighted correlation network analysis (WGCNA) and machine learnings was performed to identify candidate genes associated with RA and IBD. Differential analysis and two different machine learning algorithms were used to investigate RA's gut microbiome characteristics. Subsequently, the shared specific genes related to the gut microbiome in RA were identified, and an interaction network was constructed utilizing the gutMGene, STITCH, and STRING databases. We identified 15 candidates shared genes through a joint analysis of the WGCNA for RA and IBD. The candidate gene CXCL10 was identified as the shared hub gene by the interaction network analysis of the corresponding WGCNA module gene to each disease, and CXCL10 was further identified as the shared specific gene by two machine learning algorithms. Additionally, we identified 3 RA-associated characteristic intestinal flora (Prevotella, Ruminococcus, and Ruminococcus bromii) and built a network of interactions between the microbiomes, genes, and pathways. Finally, it was discovered that the gene CXCL10 shared between IBD and RA was associated with the three gut microbiomes mentioned above. This study demonstrates the relationship between RA and IBD and provides a reference for research into the role of the gut microbiome in RA.


Conflict of interest statement

The authors declare no competing interests.

Figures

Figure 1
Figure 1
Flowchart of the analytical process.
Figure 2
Figure 2
Principal component analysis (PCA) of combined data sets before and after batch effect removal. (A) PCA analysis was performed before batch effect elimination. (B) PCA analysis was performed after batch effect elimination. The GSE55235 dataset is red, and the GSE55457 dataset is blue. The triangular dots and the circular dots indicate samples from the RA and normal groups, respectively.
Figure 3
Figure 3
Potential genes implicated in both rheumatoid arthritis (RA) and inflammatory bowel disease (IBD) were discovered using WGCNA. (A) Analysis of the network topology for RA utilizing various soft-threshold powers. (B) Determination of the gene modules that RA co-expresses. The 28 modules comprising the dendrogram’s branches are each assigned a different color. (C) A study of network topology for Crohn’s disease (CD) utilizing various soft-threshold powers. (D) Determination of the gene modules that CD co-expresses. The 52 modules comprising the dendrogram’s branches are each assigned a different color. (E) Analysis of the network topology for ulcerative colitis (UC) utilizing various soft-threshold powers. (F) Identification of the gene modules co-expressed by UC. The 57 modules comprising the dendrogram’s branches are each assigned a different color. (G) Heatmap depicting the association between the prevalence of RA and module genes. (H) Heatmap depicting the association between the prevalence of CD and module genes. (I) Heatmap depicting the association between the prevalence of UC and module genes. Red and blue show a positive and negative association, respectively, with the hue’s depth indicating each’s strength. (J) Venn diagram demonstrating the overlap between candidate genes of two IBD (CD and UC) modules and those of one RA module.
Figure 4
Figure 4
Protein–protein interaction network analysis of the corresponding WGCNA module genes for rheumatoid disease (RA) and inflammatory bowel disease (IBD) (Crohn’s disease [CD] and ulcerative colitis [UC]). (A) Protein interaction network of RA’s corresponding WGCNA module genes. (B) Protein interaction network of CD’s corresponding WGCNA module genes. (C) Protein interaction network of UC’s corresponding WGCNA module genes. (D) Network diagram of the hub nodes from RA. (E) Network diagram of the hub nodes from CD. (F) Network diagram of the hub nodes from UC.
Figure 5
Figure 5
Functional annotation of candidate genes and identification of pathways associated with RA and IBD. (A) Results of GO enrichment analysis of 15 candidate genes identified via WGCNA. (B) Results of KEGG enrichment analysis of 15 candidate genes identified via WGCNA. (C) PPI network of 15 candidate genes. (D) Upregulated enriched pathways identified via GSEA in the RA training cohort. (E) Upregulated enriched pathways identified via GSEA in the CD cohort. (F) Upregulated enriched pathways identified via GSEA in the UC cohort. (G) Downregulated enriched pathways identified via GSEA in the RA training cohort. (H) Downregulated enriched pathways identified via GSEA in the CD cohort. (I) Downregulated enriched pathways identified via GSEA in the UC cohort.
Figure 6
Figure 6
Machine learning-based identification and validation of potential shared specific genes. (A,B) Four genes were identified using the SVM-RFE algorithm in the RA training set. (C) LASSO coefficient profiles of 15 candidate genes in the RA training set. (D) LASSO coefficient profiles of 7 genes were selected as optimal (lambda) in the RA training set. (E) Venn diagram depicting the three key genes related to IBD in the RA training set. (F) Expression of CXCL10, DUOX2, and CCL18 in the RA training set. (G) Expression of CXCL10, DUOX2, and CCL18 in the CD dataset. (H) Expression of CXCL10, DUOX2, and CCL18 in the UC dataset. (I) Expression of CXCL10, DUOX2, and CCL18 in the RA validation set. (J) ROC curve for the verification of discriminative efficiency in the RA training set. (K) ROC curve for the verification of discriminative efficiency in the CD dataset. (L) ROC curve for the verification of discriminative efficiency in the UC dataset. (M) ROC curve for the verification of discriminative efficiency in the RA validation set (****P < 0.0001; ***P < 0.001; **P < 0.01; *P < 0.05).
Figure 7
Figure 7
Identification of gut microbes associated with RA. (A) Volcano map demonstrating the differential abundance of intestinal microbes based on the criteria of |log2 FC| values of > 3 and P < 0.05. (B) LASSO coefficients of four intestinal microbes in the PRJEB6997 dataset. (C) LASSO coefficients of four microbes selected as optimal (lambda) in the PRJEB6997 dataset. (D,E) The PRJEB6997 dataset was screened using the SVM-RFE algorithm to identify three diagnostic indicators. (F) Venn diagram demonstrating the three ideal diagnostic biomarkers in the PRJEB6997 dataset. (G) ROC curve for the verification of diagnostic efficiency in the PRJEB6997 dataset. (H) Relative abundance of three bacterial groups (Prevotella, Ruminococcus, and Ruminococcus bromii) in the PRJEB6997 dataset (*P < 0.05).
Figure 8
Figure 8
Construction of an interaction network among shared specific gene associated with the gut microbiome in RA, genes related to shared pathways identified via GSEA, and the RA-specific gut microbiome. (A) Interaction network of shared specific gene and metabolites associated with the gut microbiome in RA; CXCL10 was directly associated with the metabolites. (B) Venn diagram demonstrating 7 shared high-expression pathways associated with RA and IBD identified via GSEA. (C) Venn diagram demonstrating 18 common genes associated with the 7 pathways. (D) An interaction network between the, shared specific gene associated with the gut microbiome in RA, shared pathways via GSEA, genes related to shared pathways identified via GSEA, and the RA-specific gut microbiome.
Figure 9
Figure 9
Correlation between immune infiltration and shared specific gene related to the gut microbiome in RA. (A) Through the use of the CIBERSORT algorithm, the CXCL10 expression and immune cells that are entering the body were correlated in the RA training set. (B) Through the use of the CIBERSORT algorithm, the CXCL10 expression and immune cells that are entering the body were correlated in the CD dataset. (C) Through the use of the CIBERSORT algorithm, the CXCL10 expression and immune cells that are entering the body were correlated in the UC dataset. (D) Through the use of the CIBERSORT algorithm, the CXCL10 expression and immune cells that are entering the body were correlated in the RA validation set. (E) Through the use of the ssGSEA algorithm, the CXCL10 expression and immune cells that are entering the body were correlated in the RA training set. (F) Through the use of the ssGSEA algorithm, the CXCL10 expression and immune cells that are entering the body were correlated in the CD dataset. (G) Through the use of the ssGSEA algorithm, the CXCL10 expression and immune cells that are entering the body were correlated in the UC dataset. (H) Through the use of the ssGSEA algorithm, the CXCL10 expression and immune cells that are entering the body were correlated in the RA validation set. The size of the dots indicates the strength of the association between gene expression and immune cell infiltration; the bigger the dots, the greater the correlation. The P-value is represented by the color of the dots; the greener the color, the lower the P-value. Statistical significance was defined as P < 0.05.

Similar articles

Cited by

References

    1. Aletaha D, Smolen JS. Diagnosis and management of rheumatoid arthritis: A review. JAMA. 2018;320(13):1360–1372. doi: 10.1001/jama.2018.13103. - DOI - PubMed
    1. Scher JU, Sczesnak A, Longman RS, et al. Expansion of intestinal Prevotella copri correlates with enhanced susceptibility to arthritis. Elife. 2013;2:e01202. doi: 10.7554/eLife.01202. - DOI - PMC - PubMed
    1. Alpizar-Rodriguez D, Lesker TR, Gronow A, et al. Prevotella copri in individuals at risk for rheumatoid arthritis. Ann. Rheum. Dis. 2019;78(5):590–593. doi: 10.1136/annrheumdis-2018-214514. - DOI - PubMed
    1. Tajik N, Frech M, Schulz O, et al. Targeting zonulin and intestinal epithelial barrier function to prevent onset of arthritis. Nat. Commun. 2020;11(1):1995. doi: 10.1038/s41467-020-15831-7. - DOI - PMC - PubMed
    1. Lee YK, Mazmanian SK. Has the microbiota played a critical role in the evolution of the adaptive immune system? Science. 2010;330(6012):1768–1773. doi: 10.1126/science.1195568. - DOI - PMC - PubMed

Publication types

MeSH terms