. 2023 Jun 16;13(1):9800.
doi: 10.1038/s41598-023-36887-7.

Evaluation of inactivation of bovine coronavirus by low-level radiofrequency irradiation

Affiliations

Evaluation of inactivation of bovine coronavirus by low-level radiofrequency irradiation

Jody C Cantu et al. Sci Rep. .

Abstract

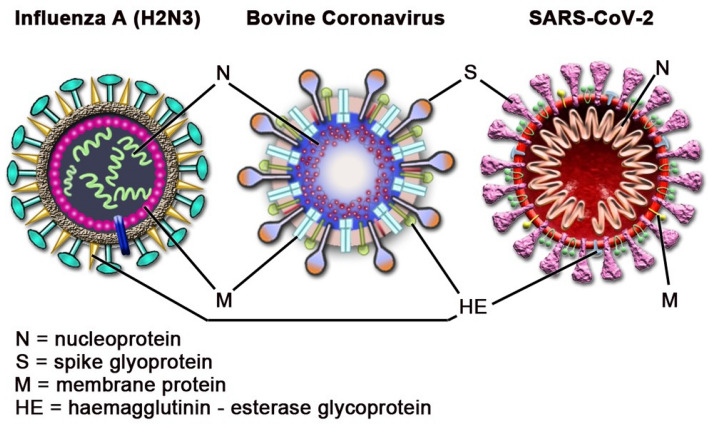
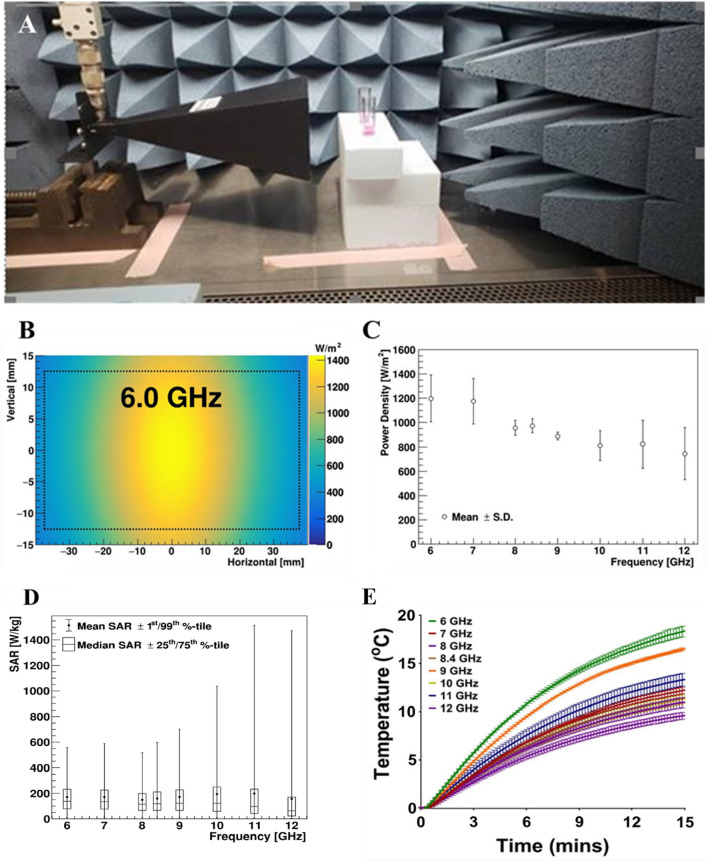
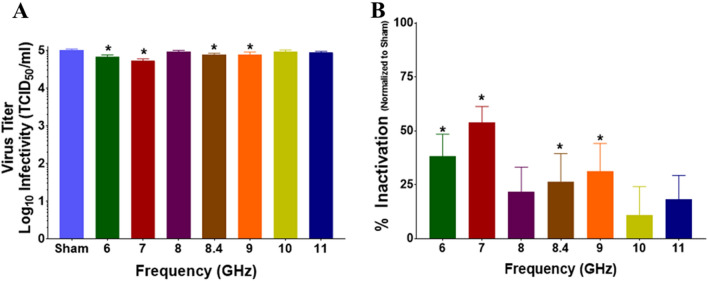
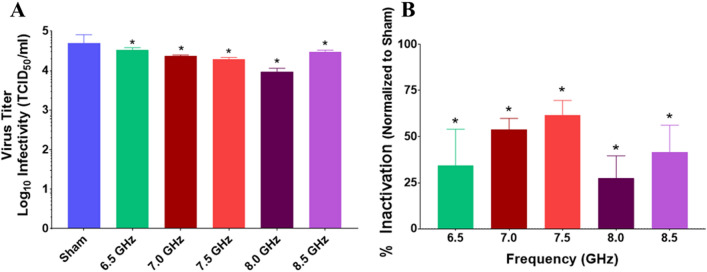
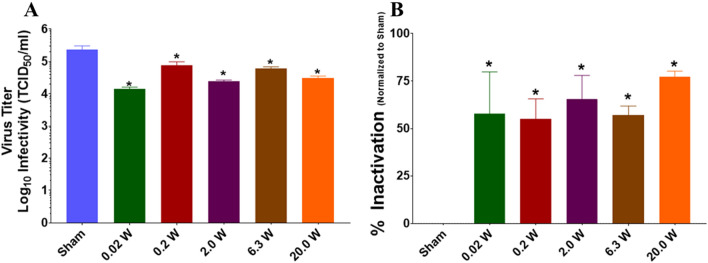
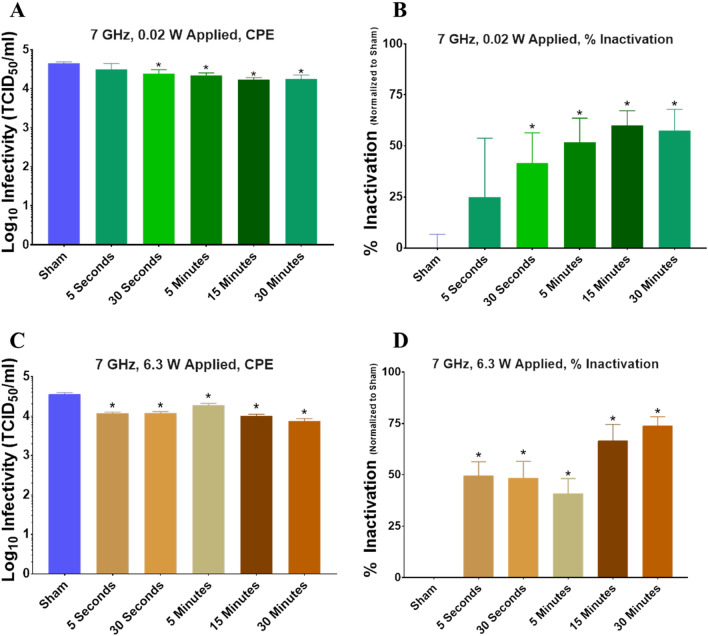
Inactivation of influenza A virus by radiofrequency (RF) energy exposure at levels near Institute of Electrical and Electronics Engineers (IEEE) safety thresholds has been reported. The authors hypothesized that this inactivation was through a structure-resonant energy transfer mechanism. If this hypothesis is confirmed, such a technology could be used to prevent transmission of virus in occupied public spaces where RF irradiation of surfaces could be performed at scale. The present study aims to both replicate and expand the previous work by investigating the neutralization of bovine coronavirus (BCoV), a surrogate of SARS-CoV-2, by RF radiation in 6-12 GHz range. Results showed an appreciable reduction in BCoV infectivity (up to 77%) due to RF exposure to certain frequencies, but failed to generate enough reduction to be considered clinically significant.


Conflict of interest statement

The authors declare no competing interests.

Figures

Figure 1
Figure 1
Comparison of BCoV composition to previously studied viruses.
Figure 2
Figure 2
Infectivity of BCoV in solution and in surface after exposure to heat. The experimental setup is shown in panel (A). Viral infectivity was assessed by CPE evaluation. Viral titers were determined upon titration on HRT-18G cells, as described in the methods, evaluated at 6 days post inoculation, and normalized to sham. (B,C) % Inactivation (i.e., data normalized to non-exposed virus sham) following incubation of solutions of BCoV at specific temperatures for 15 min duration plotted in columns or as a function of temperature. (D,E) % Inactivation following incubation of BCoV dried on glass slides at specific temperatures for 15 min duration plotted in columns or as a function of temperature. Data are expressed as mean values ± S.E.M. of at least three independent experiments (n = 3). Statistically significant differences are noted by an asterisk, which represents p-value < 0.05.
Figure 3
Figure 3
Characterization of the cuvette exposure system. (A) Photograph displays the experimental setup for exposure of BCoV in cuvettes. (B) Representative numerical simulation of the area of 6.0 GHz exposures using XFdtd® simulation software. Simulations were similar for all tested frequencies. (C) The power density was quantified based on the XFdtd® simulation for each free-space exposure and are reported as mean ± standard deviation for each frequency. (D) Candle plot of SAR voxel values based on the XFdtd® simulation for each exposure frequency, where the mean, median, 1st, 25th, 75th, and 99th percentile SAR values are depicted. (E) Temperature profiles from the cuvette exposures, as measured by a fiber-optic temperature sensor during the 15-min duration. The data are expressed as change in temperature (ΔT) from beginning to end of exposure (mean values ± S.E.M).
Figure 4
Figure 4
Infectivity of BCoV in solution after exposure to RF. Viral infectivity was assessed by CPE evaluation. Viral titers were determined upon titration on HRT-18G cells, as described in the methods, and evaluated at 6 days post inoculation. (A) Virus titer (TCID50/mL) following exposure to specific GHz frequencies with 6.3 W applied power for 15 min. (B) % Inactivation (i.e., data normalized to non-exposed virus sham) following exposure to specific GHz frequencies with 6.3 W applied power for 15 min durations. Data are expressed as mean values ± S.E.M. of at least three independent experiments (n = 3).
Figure 5
Figure 5
Infectivity of BCoV in solution after exposure to RF with high-applied power. Viral infectivity was assessed by CPE evaluation. Viral titers were determined upon titration on HRT-18G cells, as described in the methods, and evaluated at 6 days post inoculation. (A) Temperature profile from the cuvette exposures, measured by Opsens during the 15-min duration at higher applied power. (B) Virus titer (TCID50/mL) following exposure to 8.4 GHz frequencies with low (6.3 W) or high (30.0 W) applied power for 15 min durations compared to a matched heating. (C) % Inactivation (i.e. data normalized to non-exposed virus sham) following exposure to specific GHz frequencies with low (6.3 W) or high (30.0 W) applied power for 15 min durations compared to a matched heating. Data are expressed as mean values ± S.E.M. of at least three independent experiments (n = 3). Statistically significant differences are noted by an asterisk, which represents p-value < 0.05.
Figure 6
Figure 6
Characterization of the coupon exposure system. (A) Photograph displays the experimental setup for exposure of BCoV deposited on a glass slide. (B) Representative numerical simulation of the exposure area using XFdtd® simulation software. The squares in the middle of the simulation show the position of the dried BCoV sample within the field. (C) The power density was quantified based on the XFdtd® simulation for each exposure and are reported as mean ± standard deviation for each frequency.
Figure 7
Figure 7
Infectivity of BCoV on a glass surface after exposure to RF. Viral infectivity was assessed by CPE evaluation. Viral titers were determined upon titration on HRT-18G cells, as described in the methods, and evaluated at 6 days post inoculation. (A) Virus titer (TCID50/mL) following exposure to specific GHz frequencies with 6.3 W applied power for 15 min durations. (B) % Inactivation (i.e. data normalized to non-exposed virus sham) following exposure to specific GHz frequencies with 6.3 W applied power for 15-min durations. Data are expressed as mean values ± S.E.M. of at least three independent experiments (n = 3). Statistically significant differences are noted by an asterisk, which represents p-value < 0.05.
Figure 8
Figure 8
Infectivity of BCoV on a glass surface after exposure to RF: Expanded Frequency Range. BCoV was exposed to specified RF fields between 6.0 and 9.0 GHz in half step increments. Viral infectivity was assessed by CPE evaluation. Viral titers were determined upon titration on HRT-18G cells, as described in the methods, and evaluated at 6 days post inoculation. (A) Virus titer (TCID50/mL) following exposure to specific GHz frequencies with 6.3 W applied power for 15-min durations. (B) % Inactivation (i.e., data normalized to non-exposed virus sham) following exposure to specific GHz frequencies with 6.3 W applied power for 15-min durations. Data are expressed as mean values ± S.E.M. of at least three independent experiments (n = 3). Statistically significant differences are noted by an asterisk, which represents p-value < 0.05.
Figure 9
Figure 9
Infectivity of BCoV on a glass surface after RF exposure for variable applied power. Viral infectivity was assessed by CPE evaluation. Viral titers were determined upon titration on HRT-18G cells, as described in the methods, and evaluated at 6 days post inoculation. (A) Virus titer (TCID50/mL) following exposure to specific GHz frequencies with 6.3 W applied power for 15 min durations. (B) % Inactivation (i.e., data normalized to non-exposed virus sham) following exposure to 7.0 GHz RF with variable applied power (0, 0.02, 2.0, 6.3, or 20.0 W) for 15 min durations. Data are expressed as mean values ± S.E.M. of at least three independent experiments (n = 3). Statistically significant differences are noted by an asterisk, which represents p-value < 0.05.
Figure 10
Figure 10
Infectivity of BCoV on glass surfaces after RF exposure for variable time. Viral infectivity was assessed by CPE evaluation. Viral titers were determined upon titration on HRT-18G cells, as described in the methods, and evaluated at 6 days post inoculation. (A,B) Virus titer (TCID50/mL) or % Inactivation (i.e. data normalized to non-exposed virus sham) following exposure to 7.0 GHz RF with 0.02 W applied power for variable duration (5 s, 30 s, 5 min, 15 min, or 30 min). (C,D) Virus titer (TCID50/mL) or % Inactivation (i.e. data normalized to non-exposed virus sham) following exposure to 7.0 GHz RF with 6.3 W applied power for variable duration (5 s, 30 s, 5 min, 15 min, or 30 min). Data are expressed as mean values ± S.E.M. of at least three independent experiments (n = 3). Statistically significant differences are noted by an asterisk, which represents p-value < 0.05.

References

    1. Khan MH, Yadav H. Sanitization during and after COVID-19 pandemic: A short review. Trans. Indian Natl. Acad. Eng. 2020;5:617–627. doi: 10.1007/s41403-020-00177-9. - DOI
    1. Van Doremalen N, et al. Aerosol and surface stability of SARS-CoV-2 as compared with SARS-CoV-1. N. Engl. J. Med. 2020;382:1564–1567. doi: 10.1056/NEJMc2004973. - DOI - PMC - PubMed
    1. Kampf G, Todt D, Pfaender S, Steinmann E. Persistence of coronaviruses on inanimate surfaces and their inactivation with biocidal agents. J. Hosp. Infect. 2020;104:246–251. doi: 10.1016/j.jhin.2020.01.022. - DOI - PMC - PubMed
    1. Weaver DT, et al. UV decontamination of personal protective equipment with idle laboratory biosafety cabinets during the COVID-19 pandemic. PLoS ONE. 2021;16:e0241734. doi: 10.1371/journal.pone.0241734. - DOI - PMC - PubMed
    1. Ludwig-Begall LF, et al. The use of germicidal ultraviolet light, vaporized hydrogen peroxide and dry heat to decontaminate face masks and filtering respirators contaminated with a SARS-CoV-2 surrogate virus. J. Hosp. Infect. 2020;106:577–584. doi: 10.1016/j.jhin.2020.08.025. - DOI - PMC - PubMed