

Distinct taxonomic and functional profiles of high Arctic and alpine permafrost-affected soil microbiomes
- PMID: 37328770
- PMCID: PMC10276392
- DOI: 10.1186/s40793-023-00509-6
Distinct taxonomic and functional profiles of high Arctic and alpine permafrost-affected soil microbiomes
Abstract
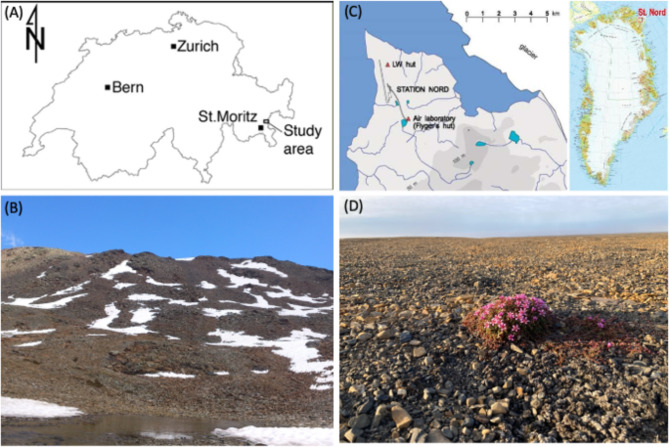
Background: Global warming is affecting all cold environments, including the European Alps and Arctic regions. Here, permafrost may be considered a unique ecosystem harboring a distinct microbiome. The frequent freeze-thaw cycles occurring in permafrost-affected soils, and mainly in the seasonally active top layers, modify microbial communities and consequently ecosystem processes. Although taxonomic responses of the microbiomes in permafrost-affected soils have been widely documented, studies about how the microbial genetic potential, especially pathways involved in C and N cycling, changes between active-layer soils and permafrost soils are rare. Here, we used shotgun metagenomics to analyze the microbial and functional diversity and the metabolic potential of permafrost-affected soil collected from an alpine site (Val Lavirun, Engadin area, Switzerland) and a High Arctic site (Station Nord, Villum Research Station, Greenland). The main goal was to discover the key genes abundant in the active-layer and permafrost soils, with the purpose to highlight the potential role of the functional genes found.
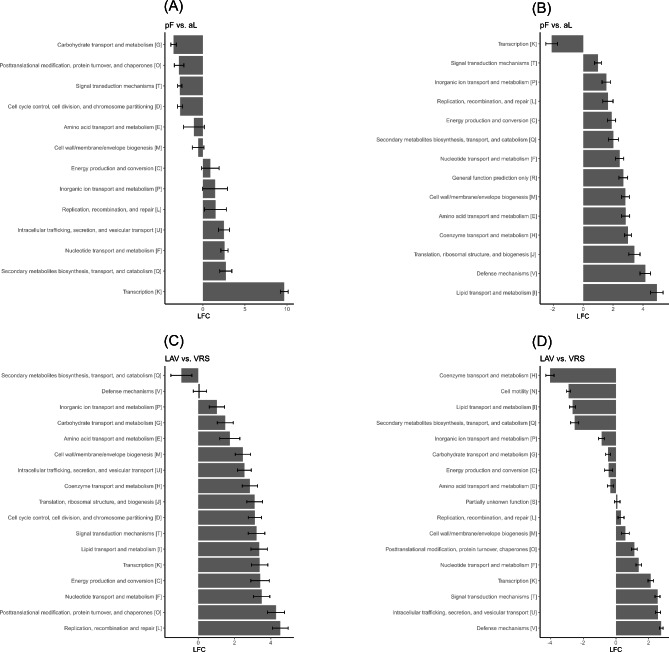
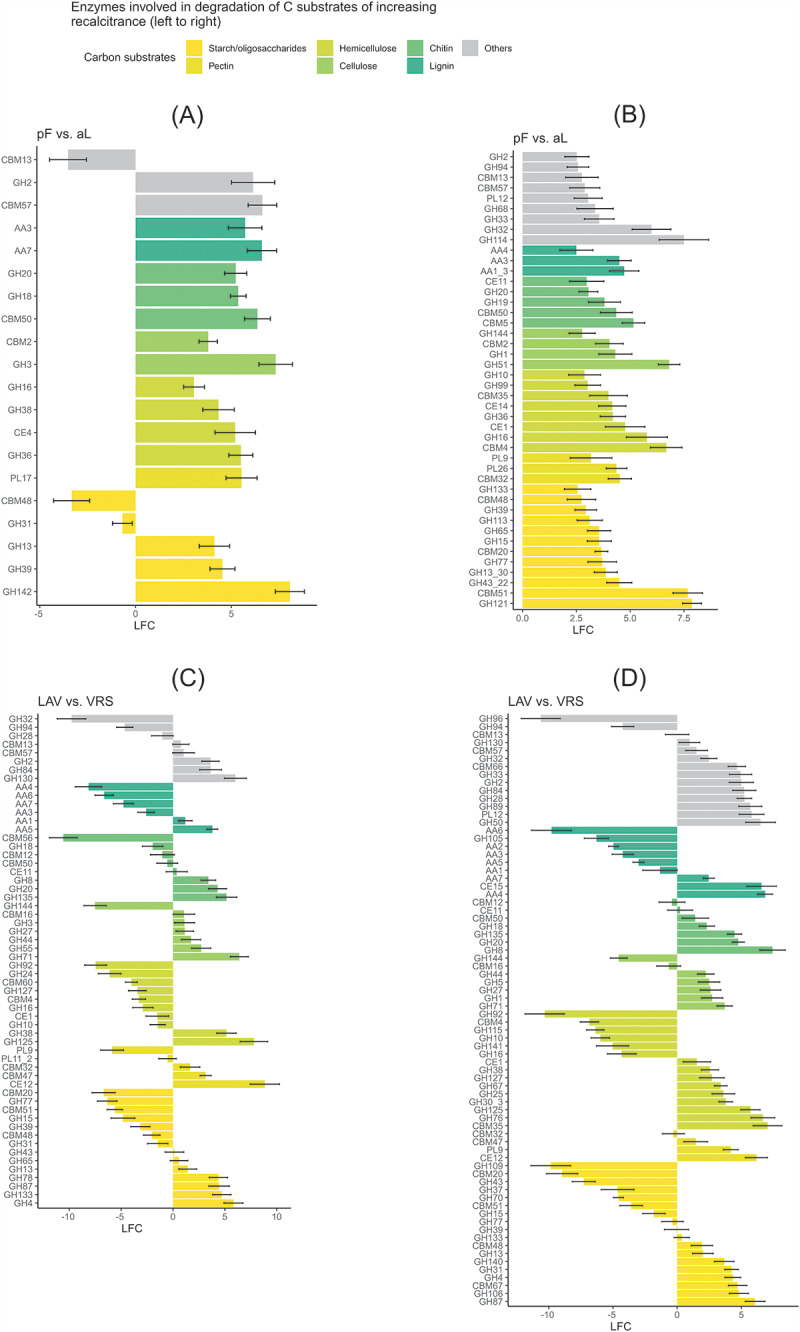
Results: We observed differences between the alpine and High Arctic sites in alpha- and beta-diversity, and in EggNOG, CAZy, and NCyc datasets. In the High Arctic site, the metagenome in permafrost soil had an overrepresentation (relative to that in active-layer soil) of genes involved in lipid transport by fatty acid desaturate and ABC transporters, i.e. genes that are useful in preventing microorganisms from freezing by increasing membrane fluidity, and genes involved in cell defense mechanisms. The majority of CAZy and NCyc genes were overrepresented in permafrost soils relative to active-layer soils in both localities, with genes involved in the degradation of carbon substrates and in the degradation of N compounds indicating high microbial activity in permafrost in response to climate warming.
Conclusions: Our study on the functional characteristics of permafrost microbiomes underlines the remarkably high functional gene diversity of the High Arctic and temperate mountain permafrost, including a broad range of C- and N-cycling genes, and multiple survival and energetic metabolisms. Their metabolic versatility in using organic materials from ancient soils undergoing microbial degradation determine organic matter decomposition and greenhouse gas emissions upon permafrost thawing. Attention to their functional genes is therefore essential to predict potential soil-climate feedbacks to the future warmer climate.
Keywords: Active layer; European alps; Functionality; High Arctic; Metagenome; Permafrost.
© 2023. The Author(s).
Figures


Similar articles
-
Shotgun metagenomics reveals distinct functional diversity and metabolic capabilities between 12 000-year-old permafrost and active layers on Muot da Barba Peider (Swiss Alps).Microb Genom. 2021 Apr;7(4):000558. doi: 10.1099/mgen.0.000558. Microb Genom. 2021. PMID: 33848236 Free PMC article.
-
Genomic insights into redox-driven microbial processes for carbon decomposition in thawing Arctic soils and permafrost.mSphere. 2024 Jul 30;9(7):e0025924. doi: 10.1128/msphere.00259-24. Epub 2024 Jun 11. mSphere. 2024. PMID: 38860762 Free PMC article.
-
Fast and persistent responses of alpine permafrost microbial communities to in situ warming.Sci Total Environ. 2022 Feb 10;807(Pt 1):150720. doi: 10.1016/j.scitotenv.2021.150720. Epub 2021 Oct 2. Sci Total Environ. 2022. PMID: 34610405
-
Microbiome assembly in thawing permafrost and its feedbacks to climate.Glob Chang Biol. 2022 Sep;28(17):5007-5026. doi: 10.1111/gcb.16231. Epub 2022 Jun 20. Glob Chang Biol. 2022. PMID: 35722720 Free PMC article. Review.
-
Dynamics of microbial communities and CO2 and CH4 fluxes in the tundra ecosystems of the changing Arctic.J Microbiol. 2019 May;57(5):325-336. doi: 10.1007/s12275-019-8661-2. Epub 2019 Jan 16. J Microbiol. 2019. PMID: 30656588 Review.
Cited by
-
Iron-oxidizing microorganisms affect the iron-bound organic carbon in the subsoil of alpine grassland during the thawing of seasonal frozen soil.Front Microbiol. 2025 Jan 6;15:1523084. doi: 10.3389/fmicb.2024.1523084. eCollection 2024. Front Microbiol. 2025. PMID: 39834369 Free PMC article.
-
Decrypting the phylogeny and metabolism of microbial dark matter in green and red Antarctic snow.ISME Commun. 2025 Jan 10;5(1):ycaf003. doi: 10.1093/ismeco/ycaf003. eCollection 2025 Jan. ISME Commun. 2025. PMID: 39866751 Free PMC article.
-
Exploring prokaryotic diversity in permafrost-affected soils of Ladakh's Changthang region and its geochemical drivers.Sci Rep. 2025 May 2;15(1):15388. doi: 10.1038/s41598-025-94542-9. Sci Rep. 2025. PMID: 40316627 Free PMC article.
-
Biodiversity in mountain soils above the treeline.Biol Rev Camb Philos Soc. 2025 Oct;100(5):1877-1949. doi: 10.1111/brv.70028. Epub 2025 May 14. Biol Rev Camb Philos Soc. 2025. PMID: 40369817 Free PMC article. Review.
References
-
- Nunez S, Arets E, Alkemade R, Verwer C, Leemans R. Assessing the impacts of climate change on biodiversity: is below 2°C enough? Clim Change [Internet]. Springer Netherlands; 2019 [cited 2023 Feb 1];154:351–65. Available from: https://link.springer.com/article/10.1007/s10584-019-02420-x. - DOI
-
- Pecl GT, Araújo MB, Bell JD, Blanchard J, Bonebrake TC, Chen IC et al. Biodiversity redistribution under climate change: Impacts on ecosystems and human well-being. Science (1979) [Internet]. American Association for the Advancement of Science; 2017 [cited 2023 Feb 1];355. Available from: https://www.science.org/doi/10.1126/science.aai9214. - PubMed
-
- Pachauri RK, Allen MR, Barros VR, Broome J, Cramer W, Christ R et al. Climate Change 2014: Synthesis Report. Contribution of Working Groups I, II and III to the Fifth Assessment Report of the Intergovernmental Panel on Climate Change. EPIC3Geneva, Switzerland, IPCC, 151 p, pp 151, ISBN: 978-92-9169-143-2 [Internet]. IPCC; 2014 [cited 2023 Jan 27]; Available from: https://www.ipcc.ch/pdf/assessment-report/ar5/syr/SYR_AR5_FINAL_full_wco....
-
- Shukla PR, Skeg J, Buendia EC, Masson-Delmotte V, Pörtner H-O, Roberts DC et al. Climate Change and Land: an IPCC special report on climate change, desertification, land degradation, sustainable land management, food security, and greenhouse gas fluxes in terrestrial ecosystems [Internet]. 2019 [cited 2023 Jan 27]. Available from: https://philpapers.org/rec/SHUCCA-2.
-
- Schwalm CR, Glendon S, Duffy PB. RCP8.5 tracks cumulative CO2 emissions. Proceedings of the National Academy of Sciences [Internet]. National Academy of Sciences; 2020 [cited 2023 Feb 3];117:19656–7. Available from: https://www.pnas.org/doi/abs/10.1073/pnas.2007117117. - PMC - PubMed
Grants and funding
LinkOut - more resources
Full Text Sources