

Magnetic resonance neurography and diffusion tensor imaging of the sciatic nerve in hereditary transthyretin amyloidosis polyneuropathy
- PMID: 37329346
- PMCID: PMC10511361
- DOI: 10.1007/s00415-023-11813-z
Magnetic resonance neurography and diffusion tensor imaging of the sciatic nerve in hereditary transthyretin amyloidosis polyneuropathy
Abstract
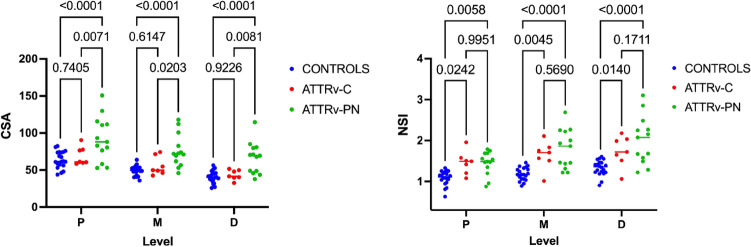
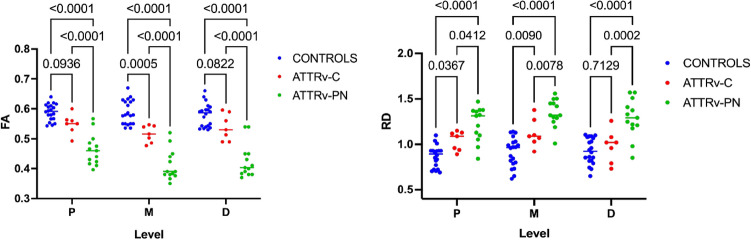
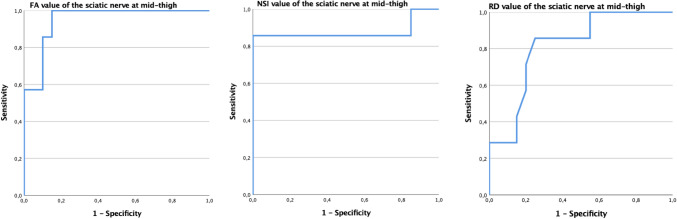
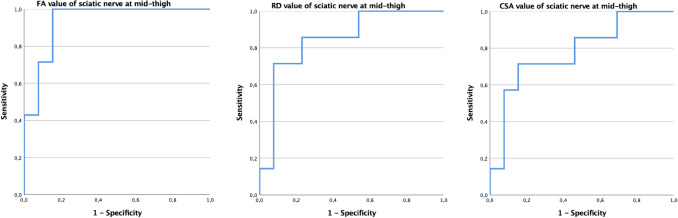
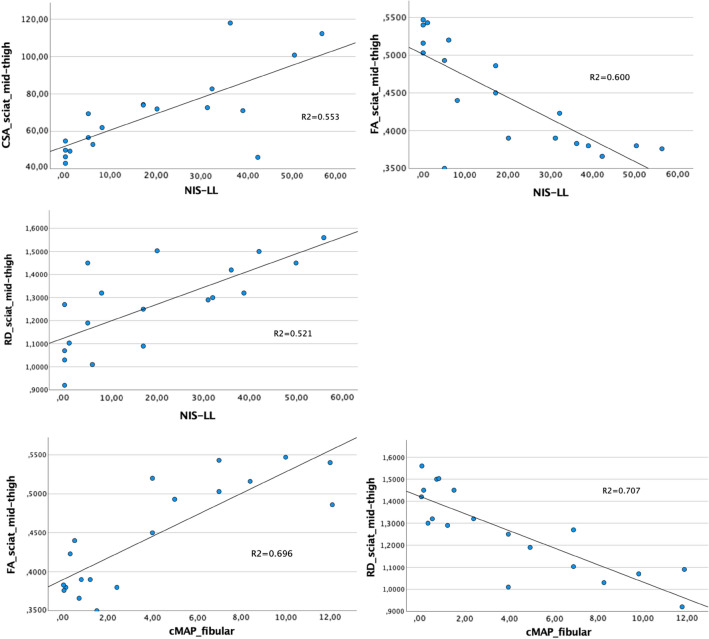
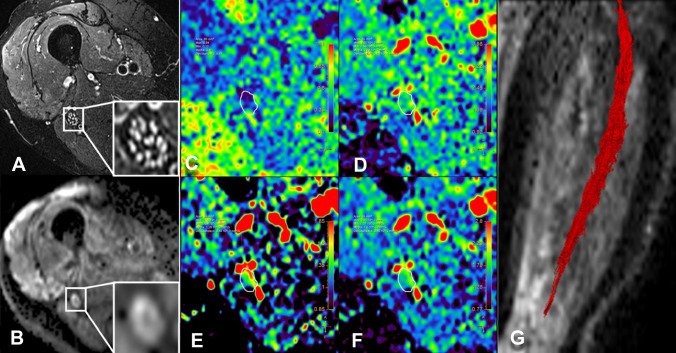
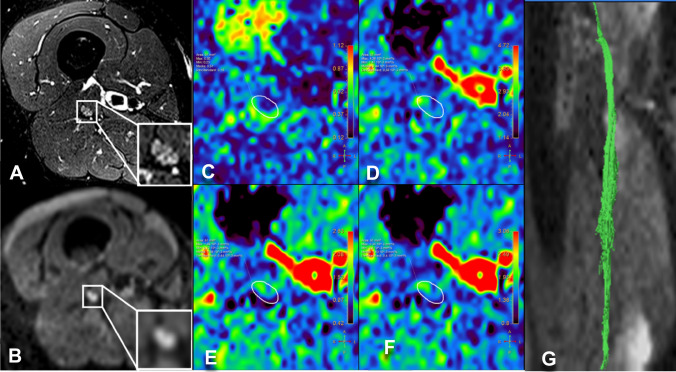
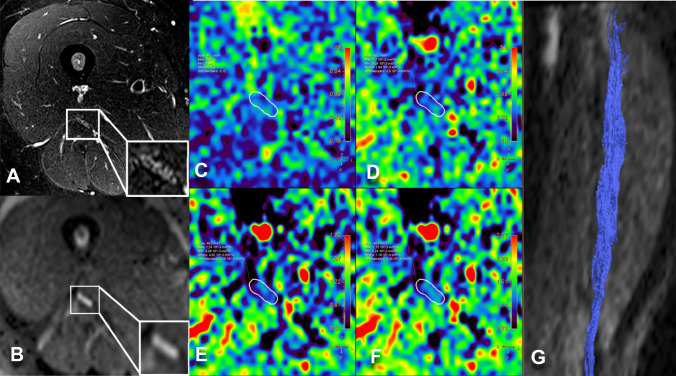
The therapeutic advance in hereditary transthyretin amyloidosis (ATTRv amyloidosis) requires quantitative biomarkers of nerve involvement in order to foster early diagnosis and monitor therapy response. We aimed at quantitatively assessing Magnetic Resonance Neurography (MRN) and Diffusion Tensor Imaging (DTI) properties of the sciatic nerve in subjects with ATTRv-amyloidosis-polyneuropathy (ATTRv-PN) and pre-symptomatic carriers (ATTRv-C). Twenty subjects with pathogenic variants of the TTR gene (mean age 62.20 ± 12.04 years), 13 ATTRv-PN, and 7 ATTRv-C were evaluated and compared with 20 healthy subjects (mean age 60.1 ± 8.27 years). MRN and DTI sequences were performed at the right thigh from the gluteal region to the popliteal fossa. Cross-sectional-area (CSA), normalized signal intensity (NSI), and DTI metrics, including fractional anisotropy (FA), mean (MD), axial (AD), and radial diffusivity (RD) of the right sciatic nerve were measured. Increased CSA, NSI, RD, and reduced FA of sciatic nerve differentiated ATTRv-PN from ATTRv-C and healthy subjects at all levels (p < 0.01). NSI differentiated ATTRv-C from controls at all levels (p < 0.05), RD at proximal and mid-thigh (1.04 ± 0.1 vs 0.86 ± 0.11 p < 0.01), FA at mid-thigh (0.51 ± 0.02 vs 0.58 ± 0.04 p < 0.01). According to receiver operating characteristic (ROC) curve analysis, cutoff values differentiating ATTRv-C from controls (and therefore identifying subclinical sciatic involvement) were defined for FA, RD, and NSI. Significant correlations between MRI measures, clinical involvement and neurophysiology were found. In conclusion, the combination of quantitative MRN and DTI of the sciatic nerve can reliably differentiate ATTRv-PN, ATTRv-C, and healthy controls. More important, MRN and DTI were able to non-invasively identify early subclinical microstructural changes in pre-symptomatic carriers, thus representing a potential tool for early diagnosis and disease monitoring.
Keywords: ATTRv amyloidosis; Amyloidotic polyneuropathy; Diffusion tensor imaging; Magnetic resonance neurography; Transthyretin amyloidosis.
© 2023. The Author(s).
Conflict of interest statement
The authors have no competing interests to declare that are relevant to the content of this article.
Figures
Similar articles
-
Intraepineurial Fat Fraction: A Novel MR Neurography-Based Biomarker in Transthyretin Amyloidosis Polyneuropathy.Eur J Neurol. 2025 Apr;32(4):e70168. doi: 10.1111/ene.70168. Eur J Neurol. 2025. PMID: 40256985 Free PMC article.
-
Magnetization transfer ratio quantifies polyneuropathy in hereditary transthyretin amyloidosis.Ann Clin Transl Neurol. 2020 May;7(5):799-807. doi: 10.1002/acn3.51049. Epub 2020 Apr 25. Ann Clin Transl Neurol. 2020. PMID: 32333729 Free PMC article.
-
3-T MR neurography of lumbo-sacral plexus in hereditary transthyretin-related amyloidosis with polyneuropathy.Eur Radiol. 2022 Nov;32(11):7865-7871. doi: 10.1007/s00330-022-08748-w. Epub 2022 Apr 19. Eur Radiol. 2022. PMID: 35438324
-
Rate of neuropathic progression in hereditary transthyretin amyloidosis with polyneuropathy and other peripheral neuropathies: a systematic review and meta-analysis.BMC Neurol. 2021 Feb 12;21(1):70. doi: 10.1186/s12883-021-02094-y. BMC Neurol. 2021. PMID: 33579211 Free PMC article.
-
The neuropathy in hereditary transthyretin amyloidosis: A narrative review.J Peripher Nerv Syst. 2021 Jun;26(2):155-159. doi: 10.1111/jns.12451. Epub 2021 May 11. J Peripher Nerv Syst. 2021. PMID: 33960565 Free PMC article. Review.
Cited by
-
Hereditary transthyretin amyloidosis: a comprehensive review with a focus on peripheral neuropathy.Front Neurol. 2023 Oct 5;14:1242815. doi: 10.3389/fneur.2023.1242815. eCollection 2023. Front Neurol. 2023. PMID: 37869146 Free PMC article. Review.
-
Intraepineurial Fat Fraction: A Novel MR Neurography-Based Biomarker in Transthyretin Amyloidosis Polyneuropathy.Eur J Neurol. 2025 Apr;32(4):e70168. doi: 10.1111/ene.70168. Eur J Neurol. 2025. PMID: 40256985 Free PMC article.
-
Low transthyretin is associated with the poor prognosis of colorectal cancer.Front Oncol. 2025 Feb 5;15:1397019. doi: 10.3389/fonc.2025.1397019. eCollection 2025. Front Oncol. 2025. PMID: 39975596 Free PMC article.
-
Nerve MR in the Differential Diagnosis of Neuropathies: A Case Series from a Single Center.J Clin Med. 2023 Jul 30;12(15):5009. doi: 10.3390/jcm12155009. J Clin Med. 2023. PMID: 37568411 Free PMC article.
-
Real-life experience with disease-modifying drugs in hereditary transthyretin amyloid polyneuropathy: A clinical and electrophysiological appraisal.Eur J Neurol. 2025 Jan;32(1):e16571. doi: 10.1111/ene.16571. Epub 2024 Nov 28. Eur J Neurol. 2025. PMID: 39606815 Free PMC article.
References
MeSH terms
Supplementary concepts
LinkOut - more resources
Full Text Sources
Research Materials
Miscellaneous
