

Plasma proteomic signatures of a direct measure of insulin sensitivity in two population cohorts
- PMID: 37329449
- PMCID: PMC10390625
- DOI: 10.1007/s00125-023-05946-z
Plasma proteomic signatures of a direct measure of insulin sensitivity in two population cohorts
Abstract
Aims/hypothesis: The euglycaemic-hyperinsulinaemic clamp (EIC) is the reference standard for the measurement of whole-body insulin sensitivity but is laborious and expensive to perform. We aimed to assess the incremental value of high-throughput plasma proteomic profiling in developing signatures correlating with the M value derived from the EIC.
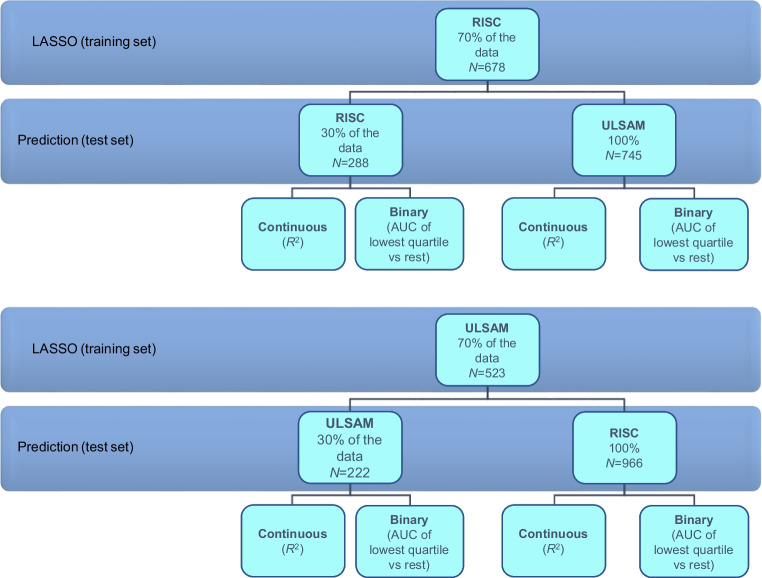
Methods: We measured 828 proteins in the fasting plasma of 966 participants from the Relationship between Insulin Sensitivity and Cardiovascular disease (RISC) study and 745 participants from the Uppsala Longitudinal Study of Adult Men (ULSAM) using a high-throughput proximity extension assay. We used the least absolute shrinkage and selection operator (LASSO) approach using clinical variables and protein measures as features. Models were tested within and across cohorts. Our primary model performance metric was the proportion of the M value variance explained (R2).
Results: A standard LASSO model incorporating 53 proteins in addition to routinely available clinical variables increased the M value R2 from 0.237 (95% CI 0.178, 0.303) to 0.456 (0.372, 0.536) in RISC. A similar pattern was observed in ULSAM, in which the M value R2 increased from 0.443 (0.360, 0.530) to 0.632 (0.569, 0.698) with the addition of 61 proteins. Models trained in one cohort and tested in the other also demonstrated significant improvements in R2 despite differences in baseline cohort characteristics and clamp methodology (RISC to ULSAM: 0.491 [0.433, 0.539] for 51 proteins; ULSAM to RISC: 0.369 [0.331, 0.416] for 67 proteins). A randomised LASSO and stability selection algorithm selected only two proteins per cohort (three unique proteins), which improved R2 but to a lesser degree than in standard LASSO models: 0.352 (0.266, 0.439) in RISC and 0.495 (0.404, 0.585) in ULSAM. Reductions in improvements of R2 with randomised LASSO and stability selection were less marked in cross-cohort analyses (RISC to ULSAM R2 0.444 [0.391, 0.497]; ULSAM to RISC R2 0.348 [0.300, 0.396]). Models of proteins alone were as effective as models that included both clinical variables and proteins using either standard or randomised LASSO. The single most consistently selected protein across all analyses and models was IGF-binding protein 2.
Conclusions/interpretation: A plasma proteomic signature identified using a standard LASSO approach improves the cross-sectional estimation of the M value over routine clinical variables. However, a small subset of these proteins identified using a stability selection algorithm affords much of this improvement, especially when considering cross-cohort analyses. Our approach provides opportunities to improve the identification of insulin-resistant individuals at risk of insulin resistance-related adverse health consequences.
Keywords: Euglycaemic–hyperinsulinaemic clamp; Insulin resistance; Insulin sensitivity; LASSO; Plasma proteomics; Population study; Stability selection.
© 2023. The Author(s).
Figures

References
-
- Einhorn D, Reaven GM, Cobin RH, et al. American college of endocrinology position statement on the insulin resistance syndrome. Endocr Pract. 2003;9(3):237–252. - PubMed
-
- Zethelius B, Hales CN, Lithell HO, Berne C. Insulin resistance, impaired early insulin response, and insulin propeptides as predictors of the development of type 2 diabetes: a population-based, 7-year follow-up study in 70-year-old men. Diabetes Care. 2004;27(6):1433–1438. doi: 10.2337/diacare.27.6.1433. - DOI - PubMed
-
- Zethelius B, Lithell H, Hales CN, Berne C. Insulin sensitivity, proinsulin and insulin as predictors of coronary heart disease. A population-based 10-year, follow-up study in 70-year old men using the euglycaemic insulin clamp. Diabetologia. 2005;48(5):862–867. doi: 10.1007/s00125-005-1711-9. - DOI - PubMed
