. 2023 Jul 12;31(7):1216-1231.e6.
doi: 10.1016/j.chom.2023.05.028. Epub 2023 Jun 16.

Virion glycosylation influences mycobacteriophage immune recognition

Affiliations

Virion glycosylation influences mycobacteriophage immune recognition

Krista G Freeman et al. Cell Host Microbe. .

Abstract

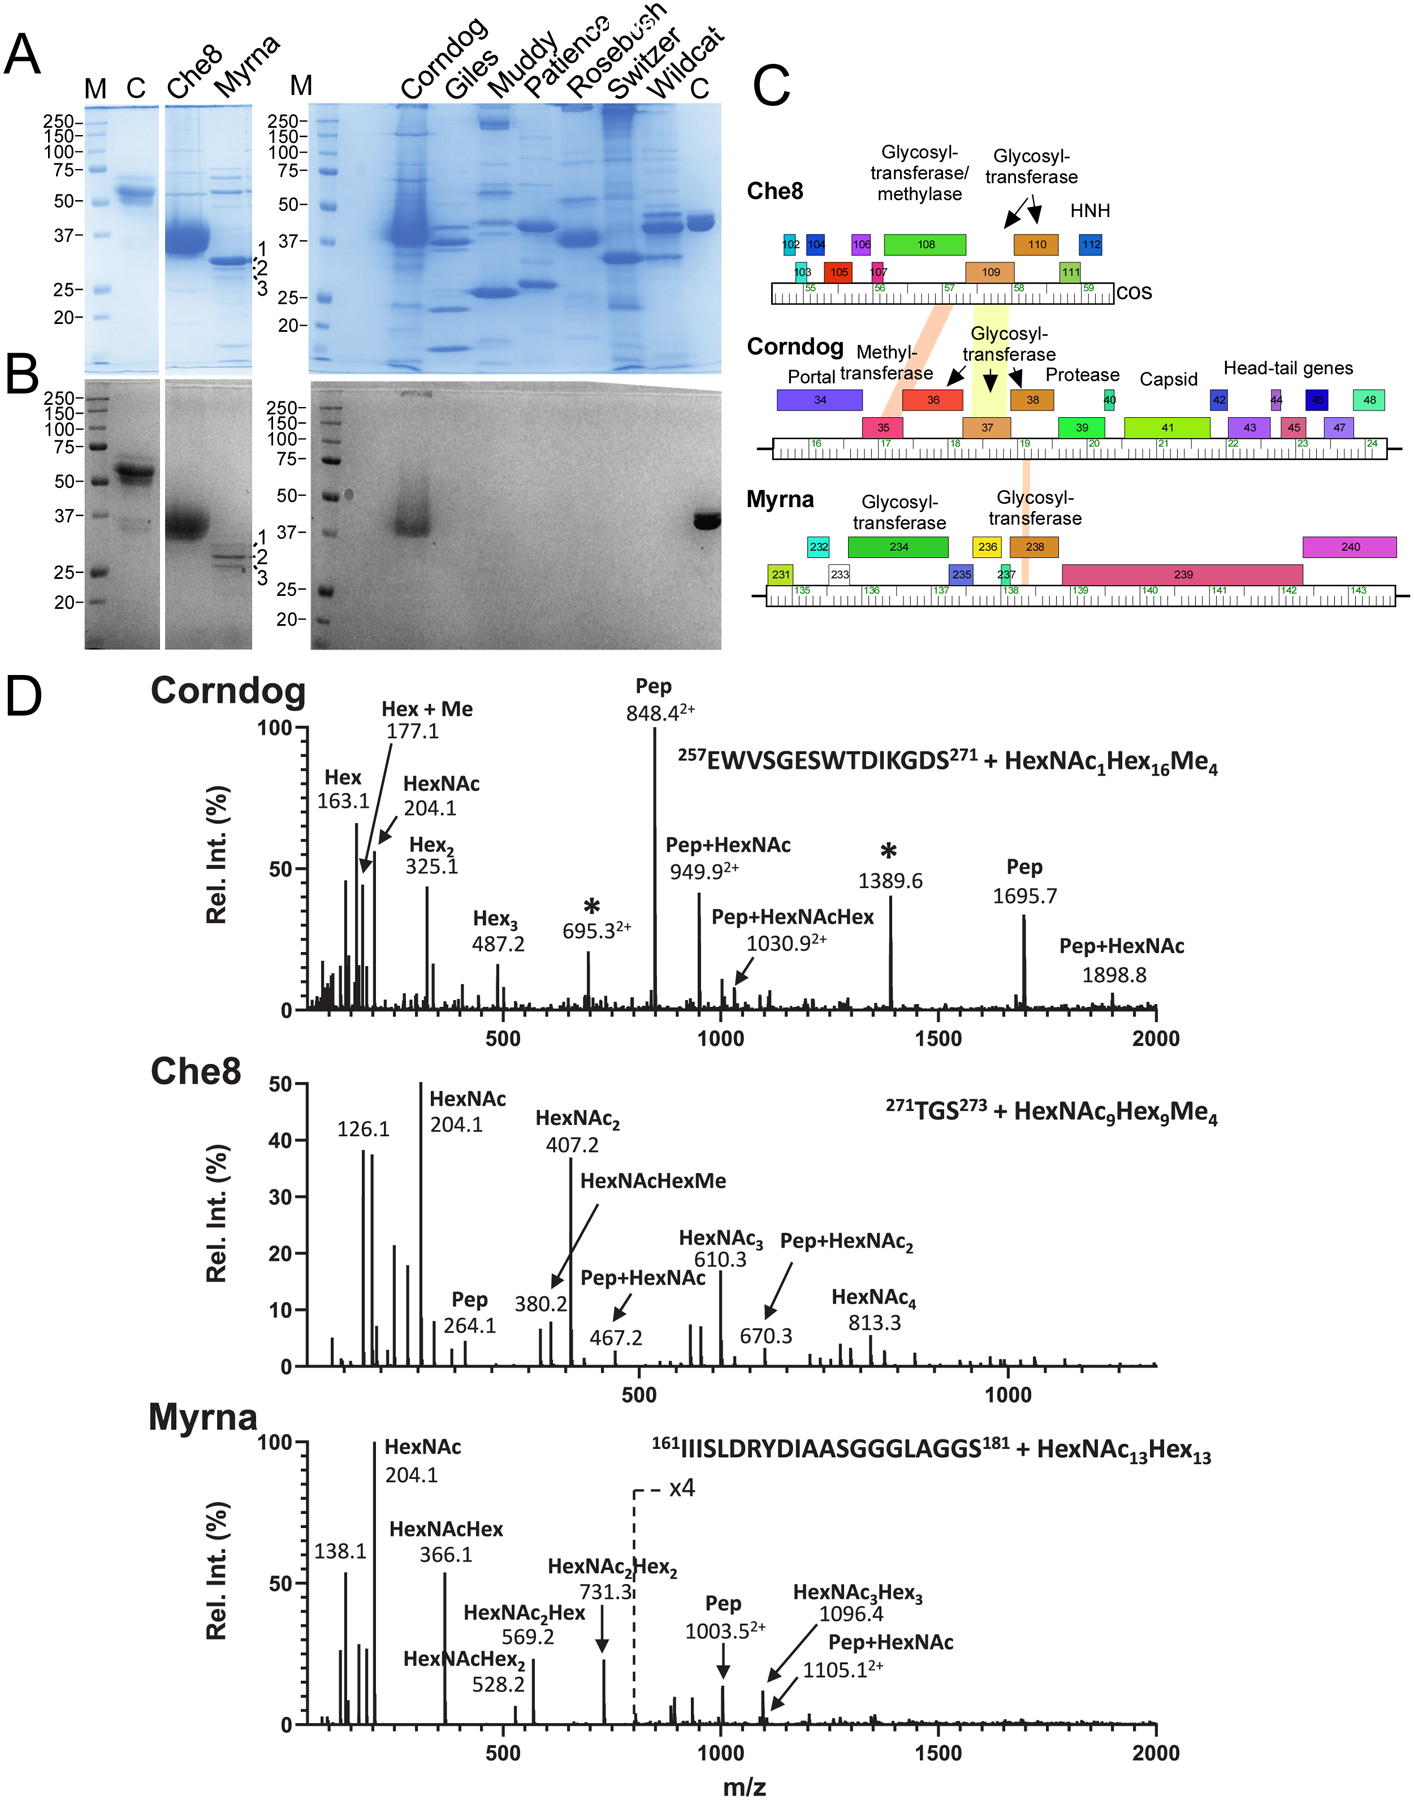
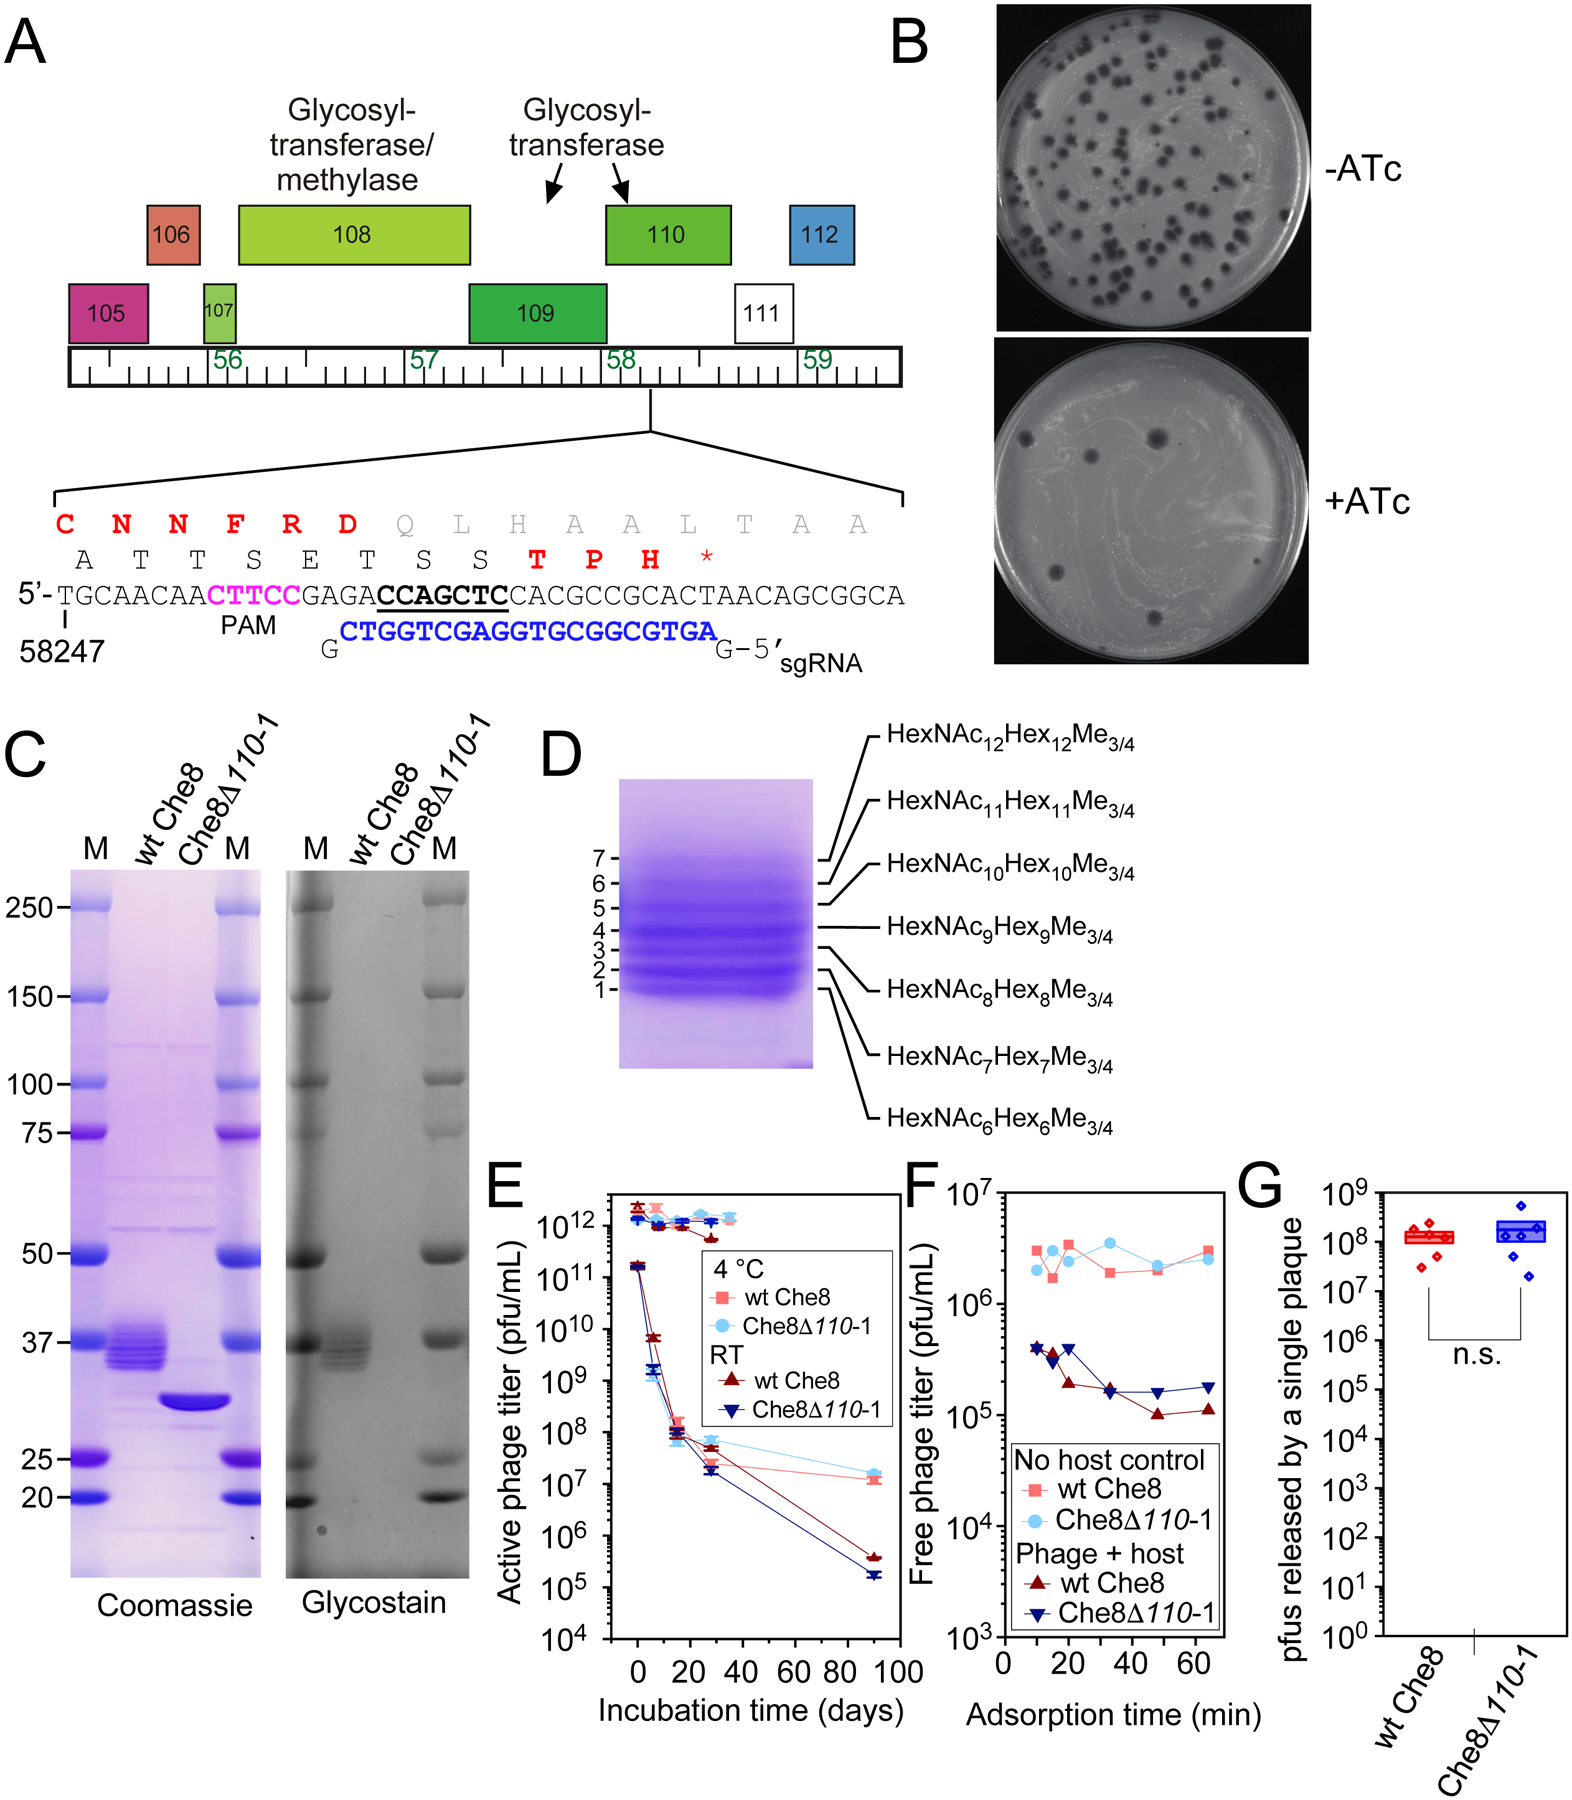
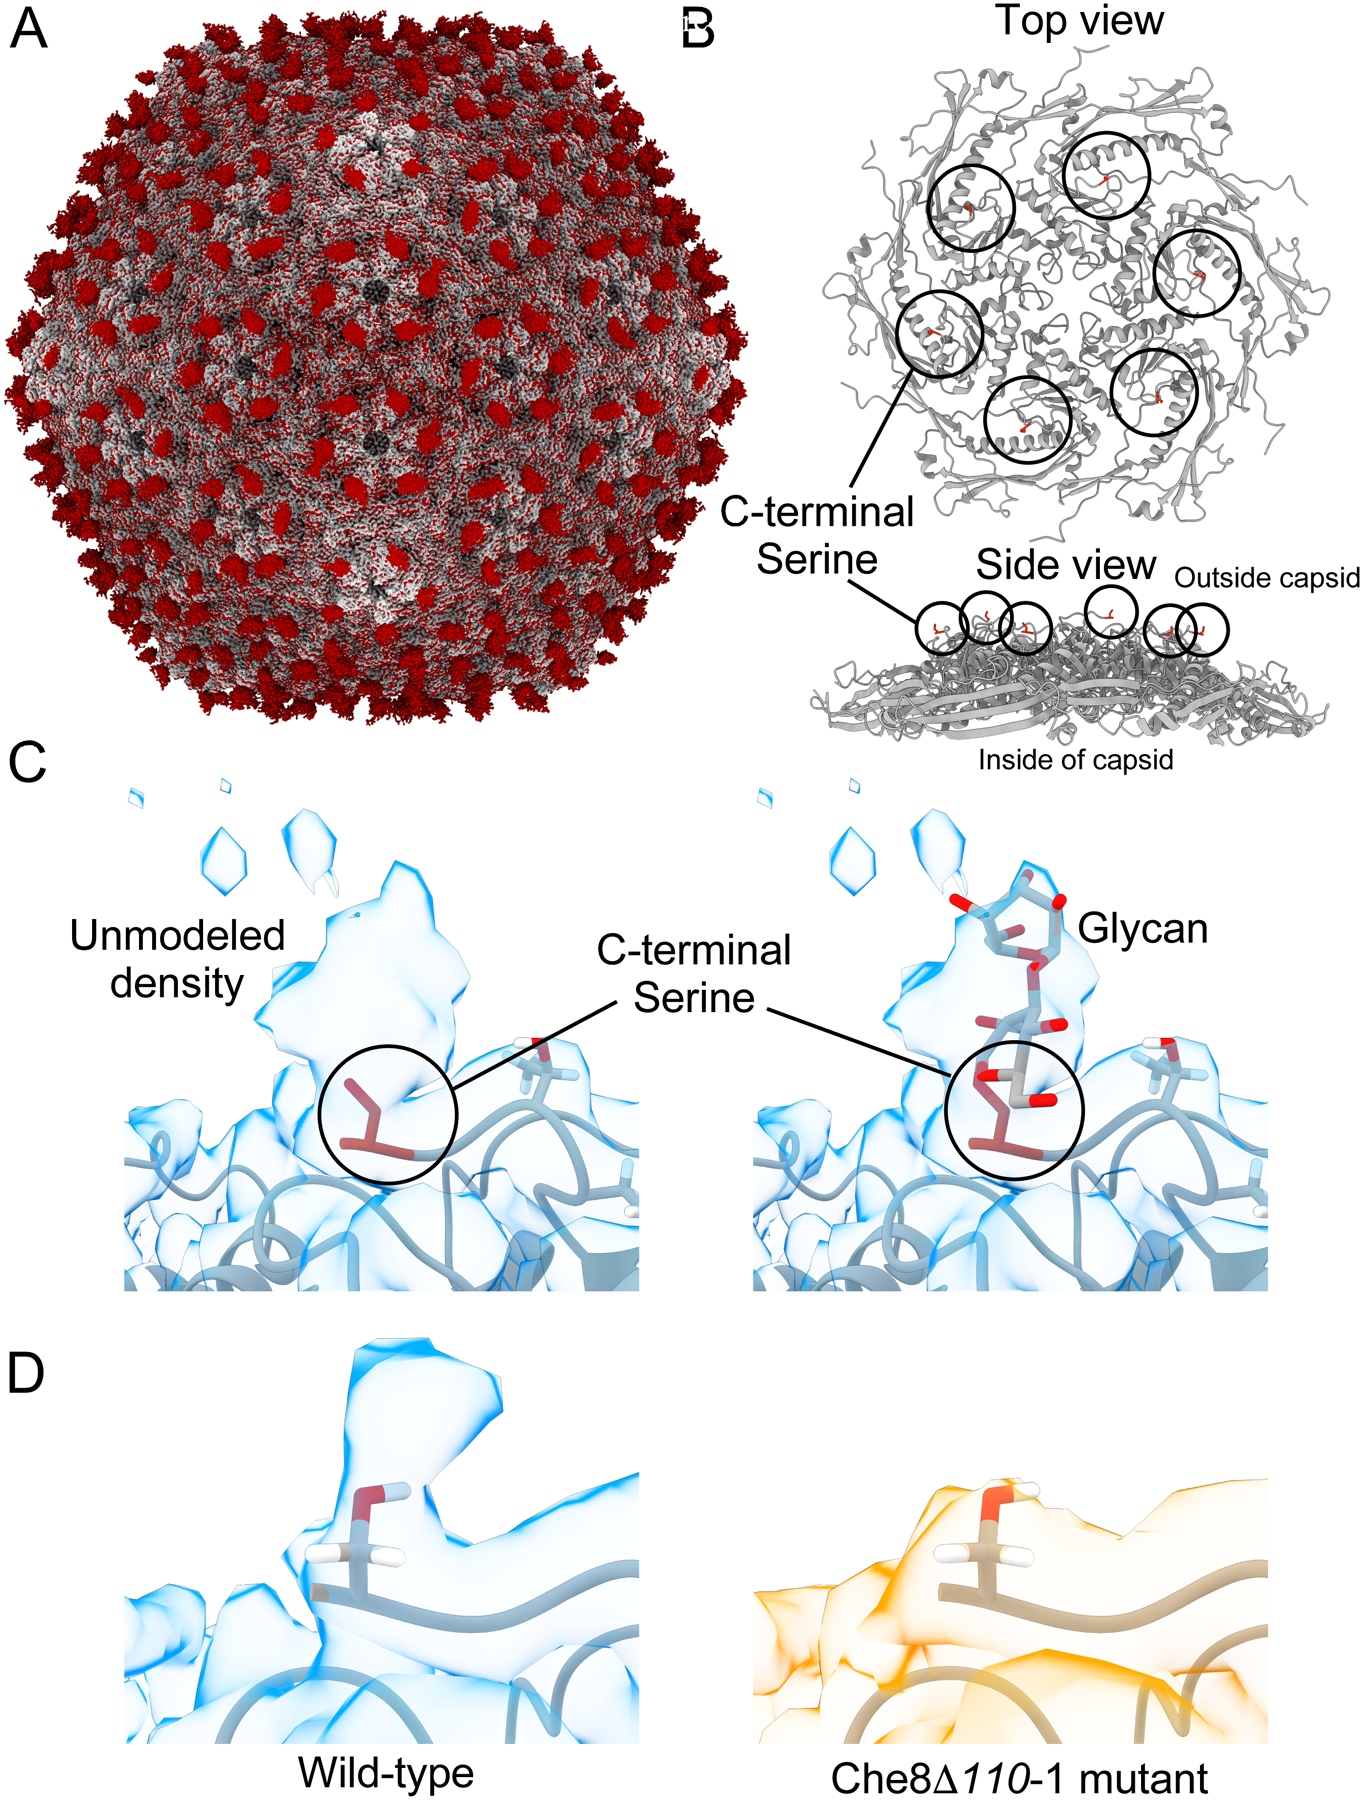
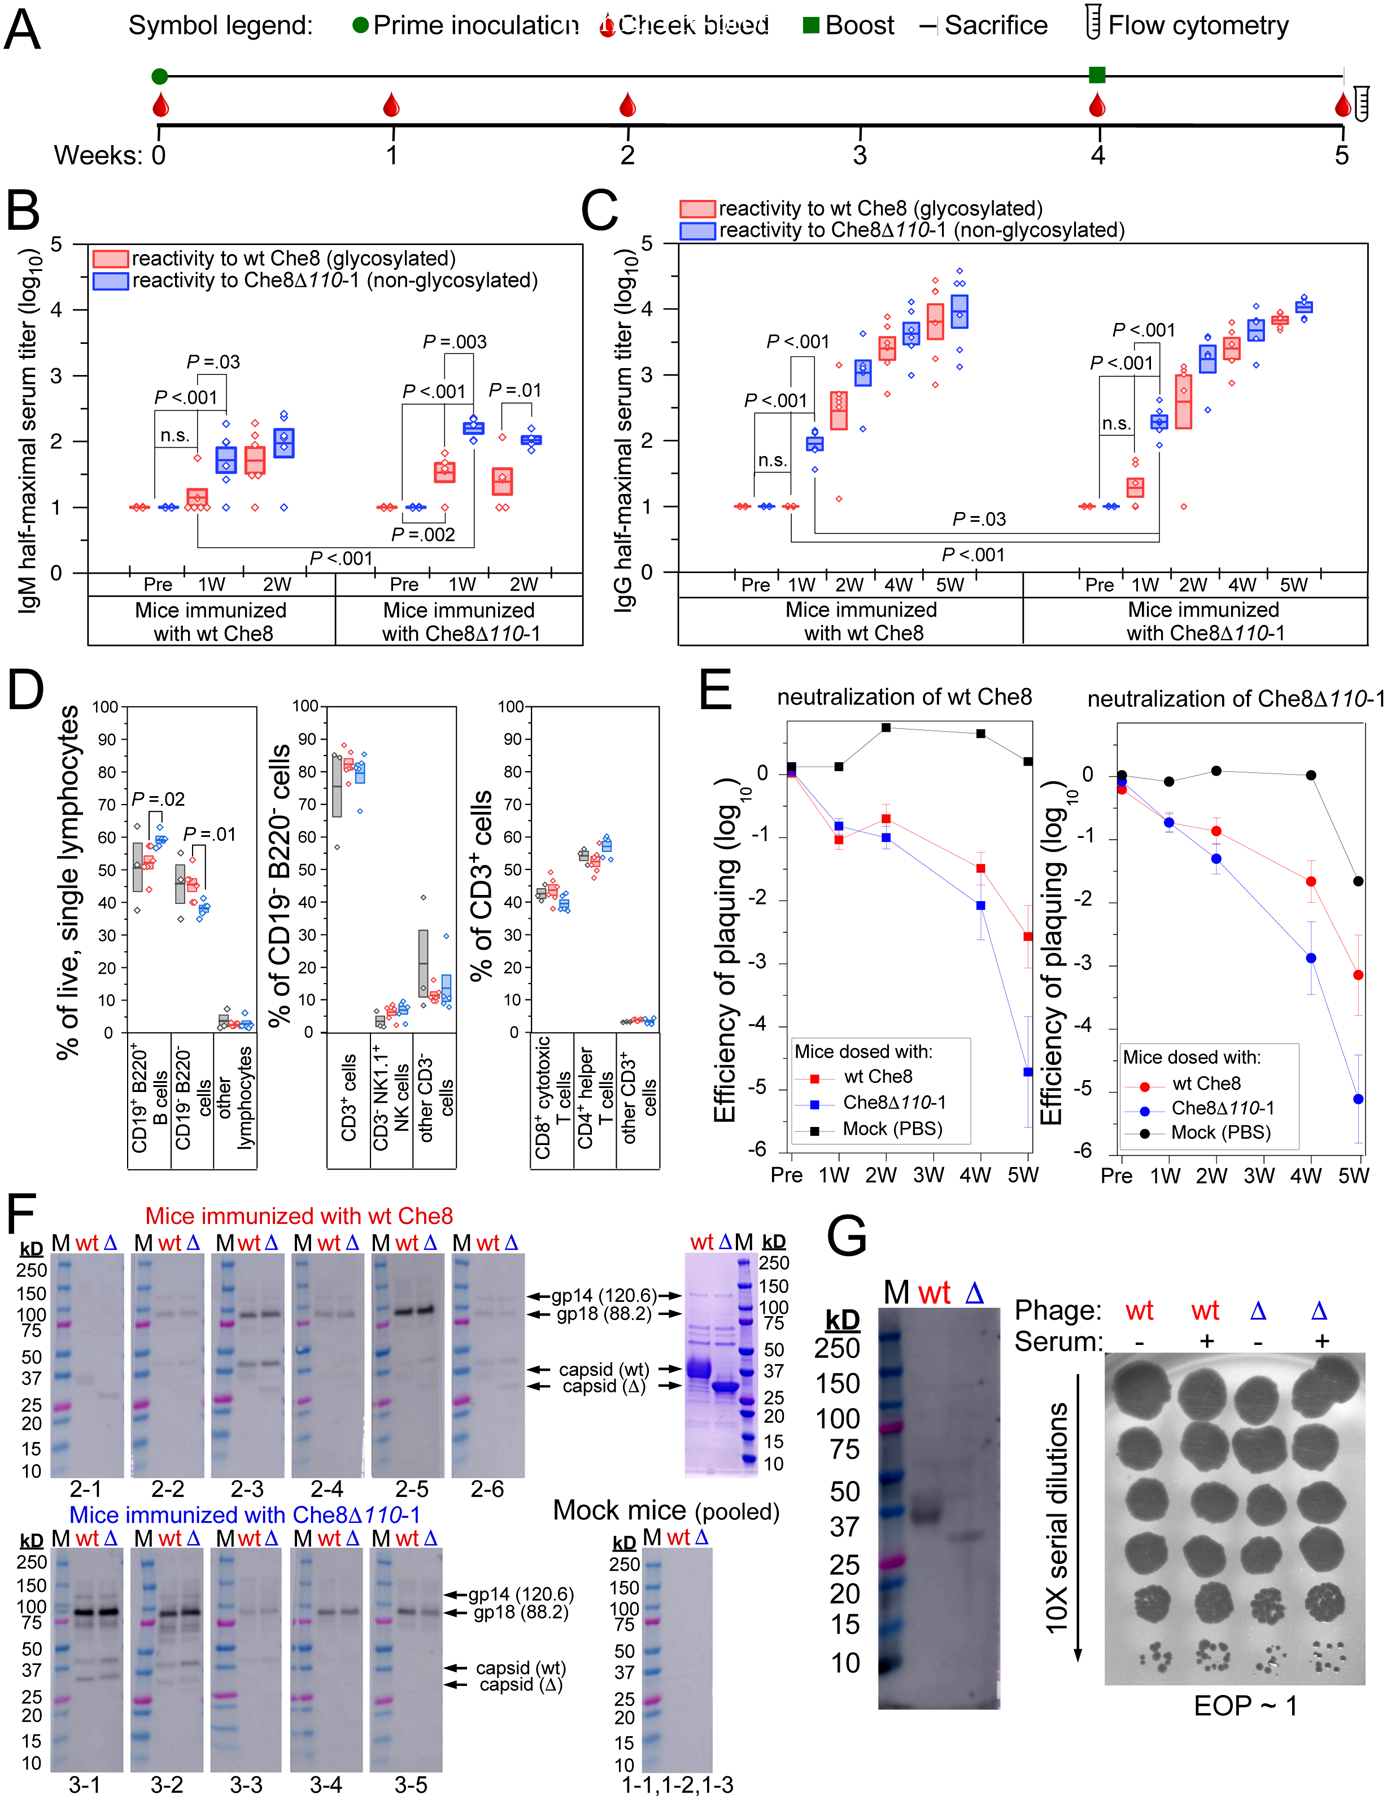
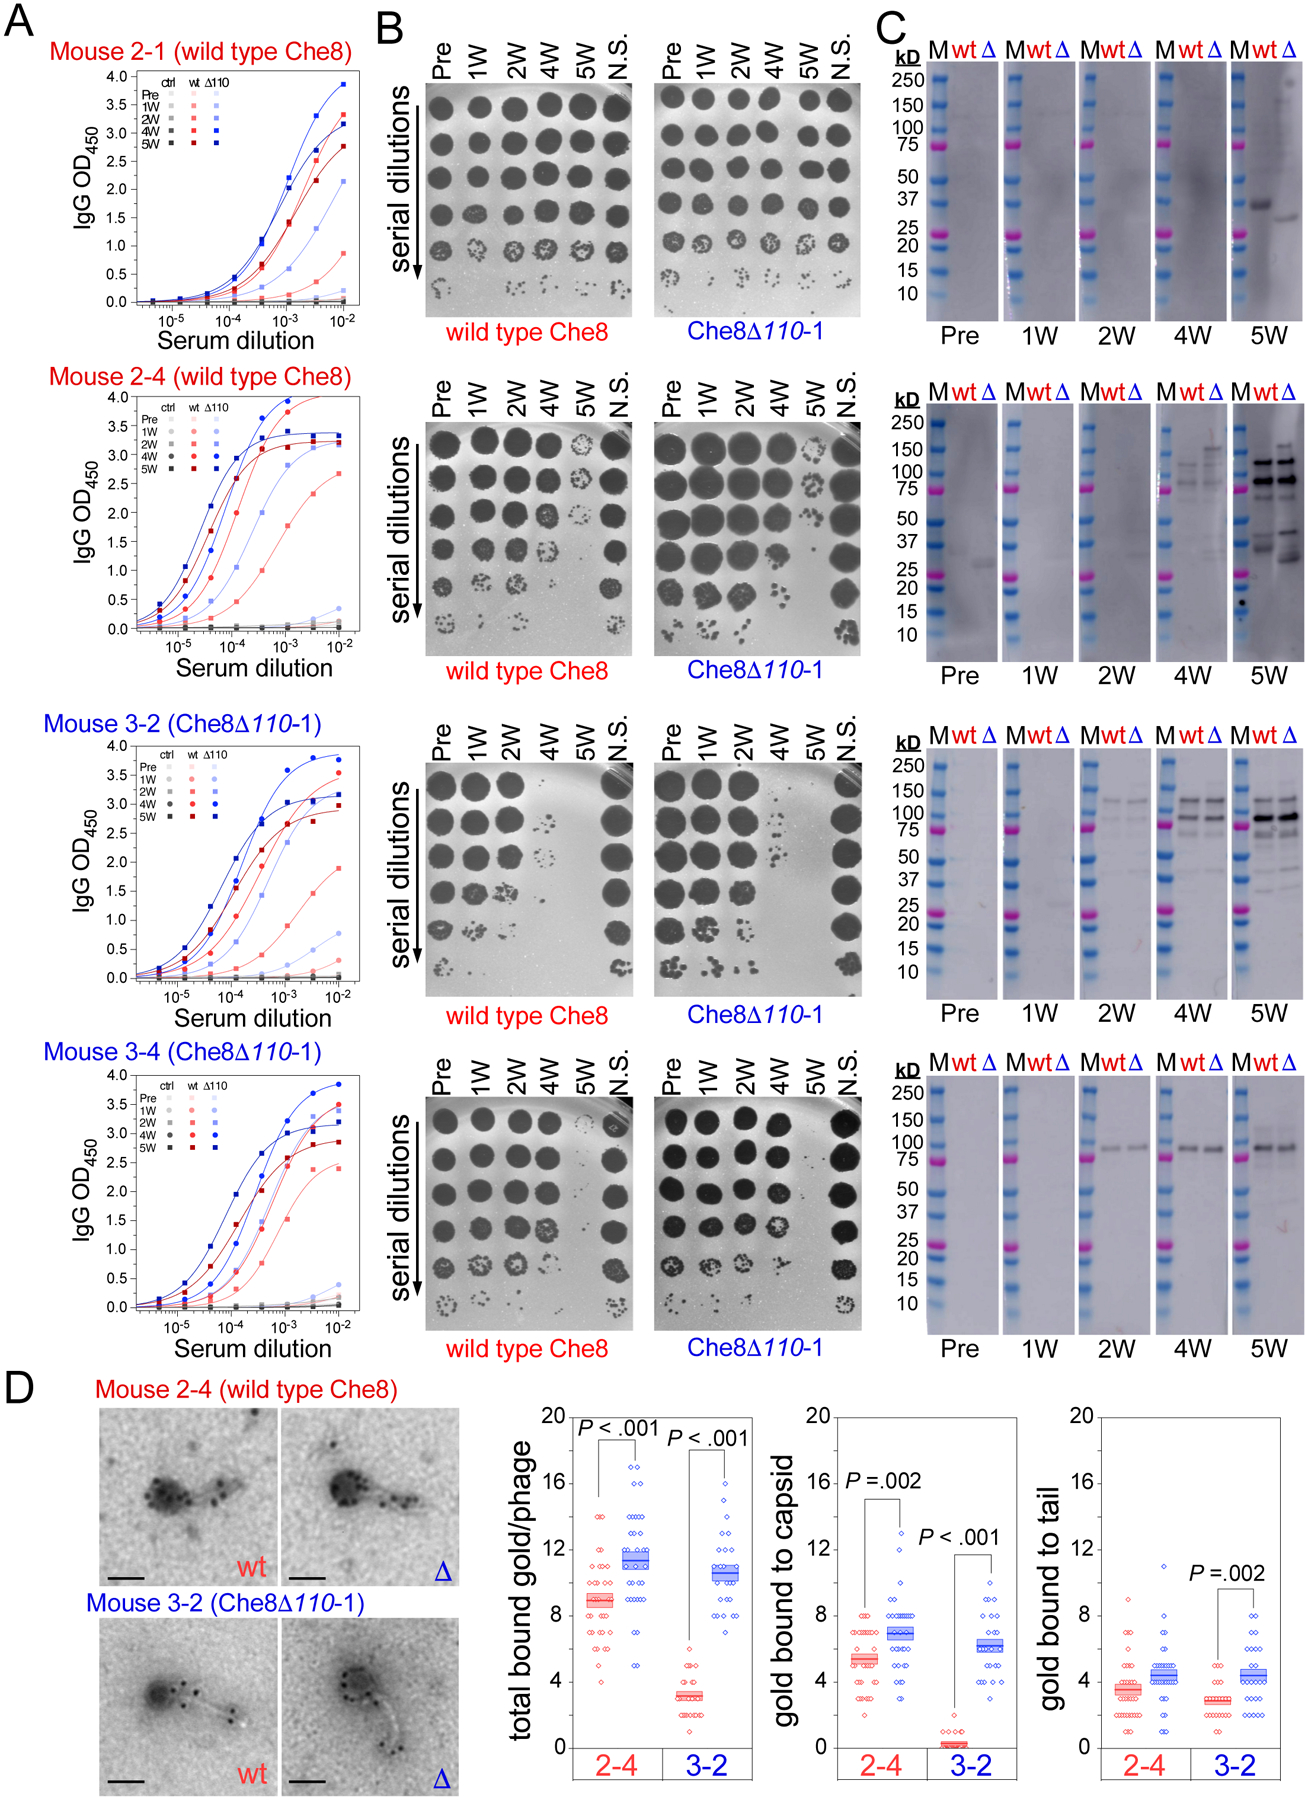
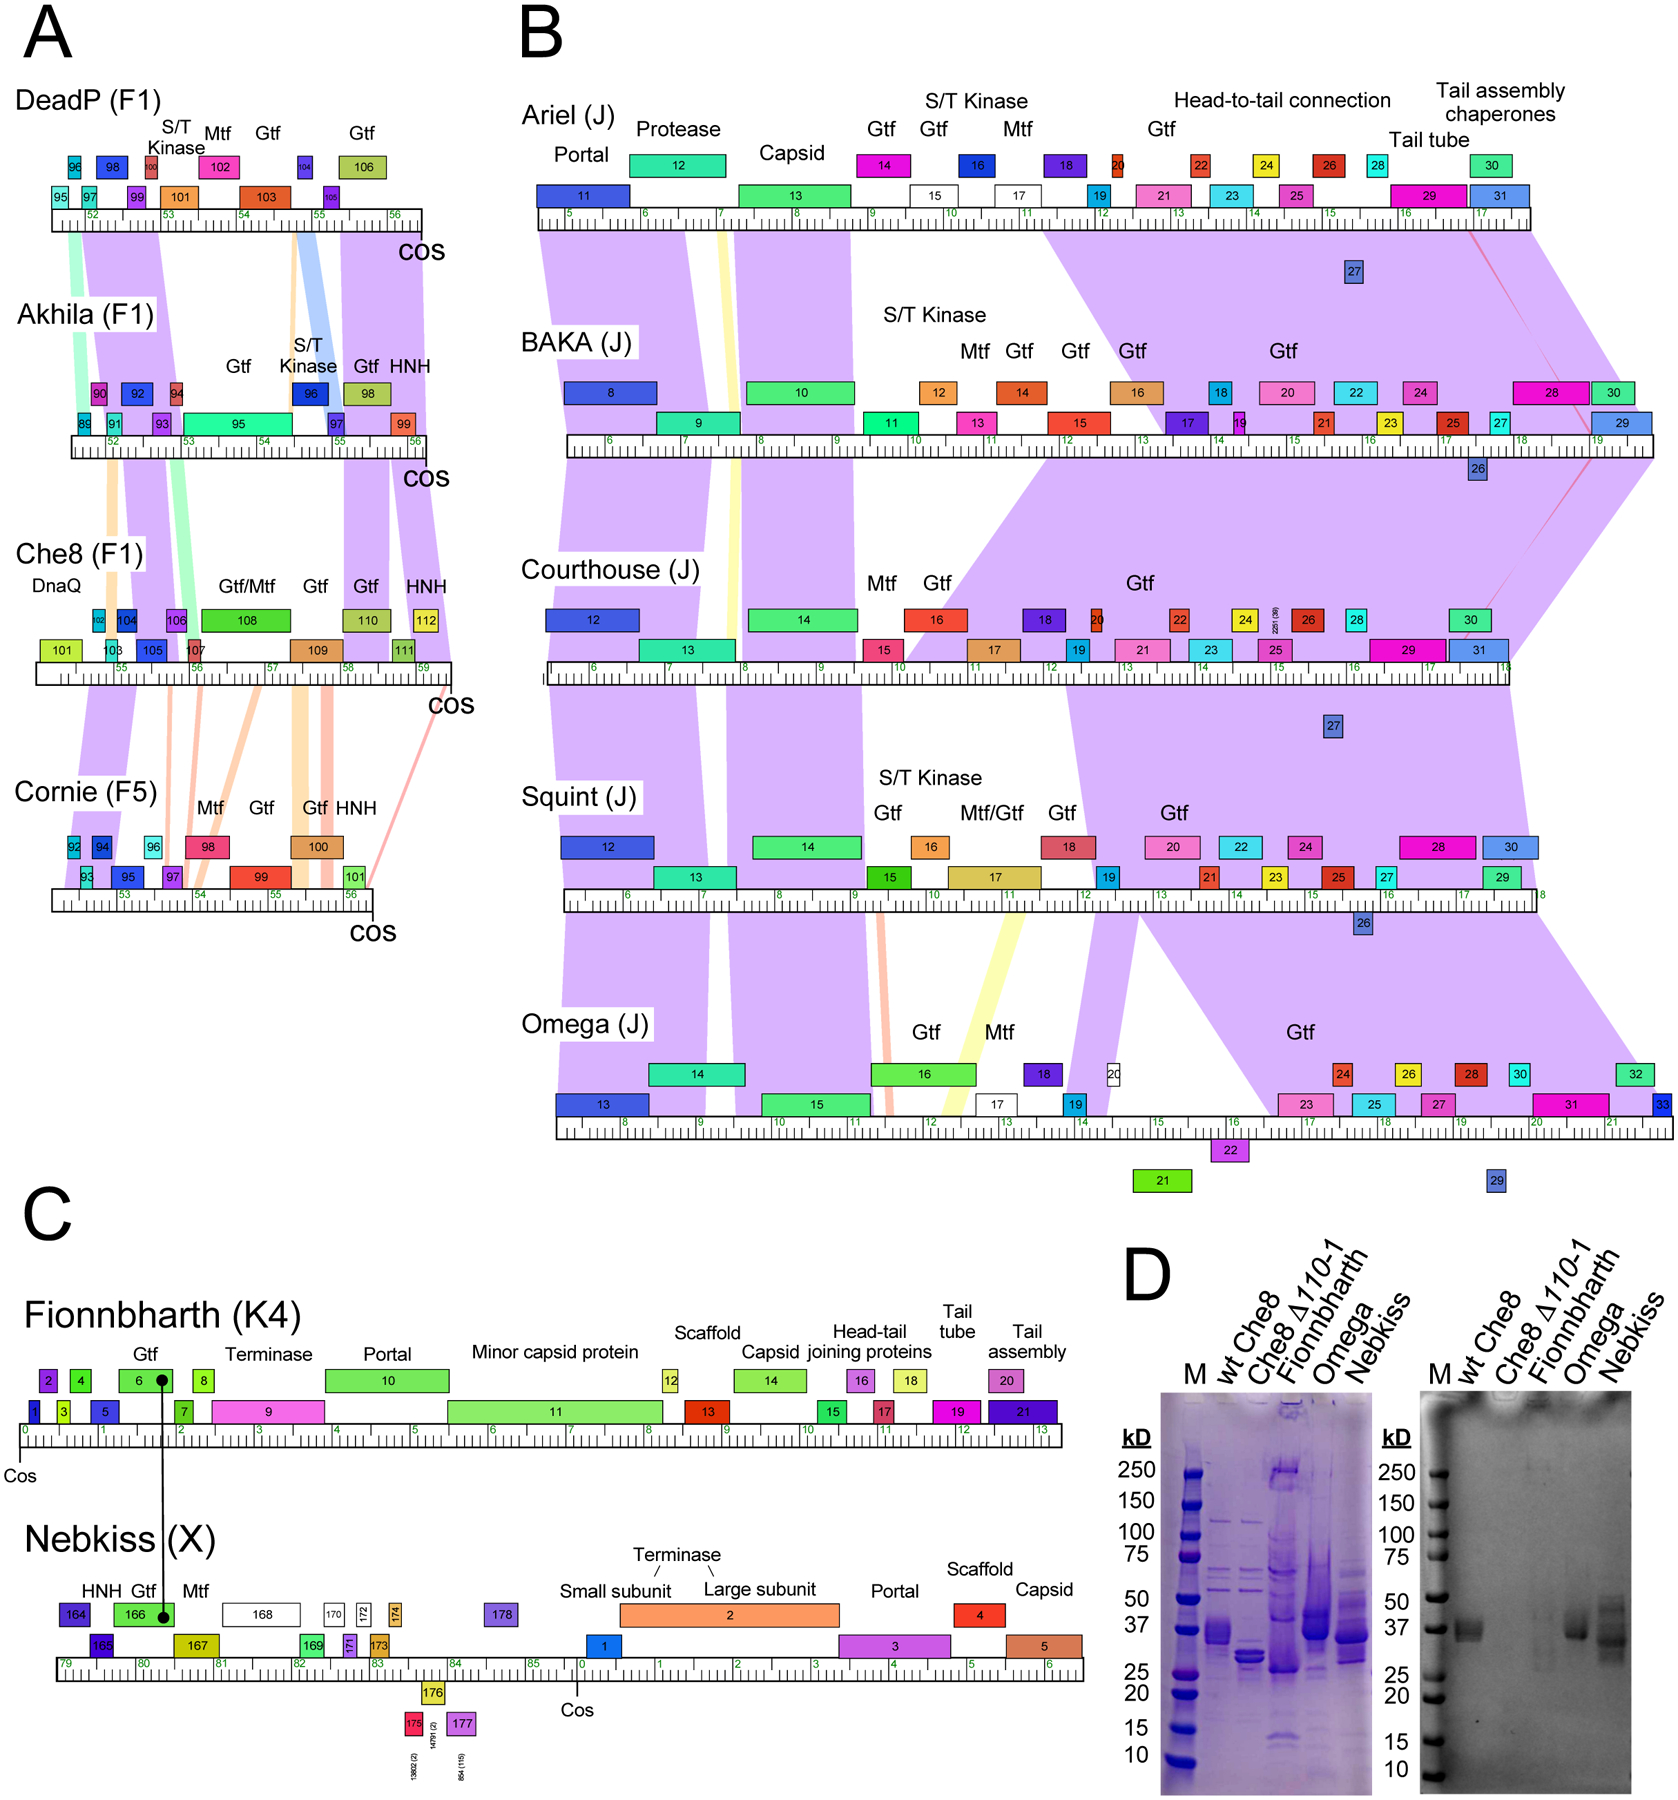
Glycosylation of eukaryotic virus particles is common and influences their uptake, trafficking, and immune recognition. In contrast, glycosylation of bacteriophage particles has not been reported; phage virions typically do not enter the cytoplasm upon infection, and they do not generally inhabit eukaryotic systems. We show here that several genomically distinct phages of Mycobacteria are modified with glycans attached to the C terminus of capsid and tail tube protein subunits. These O-linked glycans influence antibody production and recognition, shielding viral particles from antibody binding and reducing production of neutralizing antibodies. Glycosylation is mediated by phage-encoded glycosyltransferases, and genomic analysis suggests that they are relatively common among mycobacteriophages. Putative glycosyltransferases are also encoded by some Gordonia and Streptomyces phages, but there is little evidence of glycosylation among the broader phage population. The immune response to glycosylated phage virions in mice suggests that glycosylation may be an advantageous property for phage therapy of Mycobacterium infections.

Keywords: bacteriophages; phage therapy; viral glycosylation.


Conflict of interest statement

Declaration of interests G.F.H. received support from Janssen Inc. through a Collaborative Research Agreement, which did not fund work in this report. J.V.W. serves on the Scientific Advisory Board of Quidel and an Independent Data Monitoring Committee for GlaxoSmithKline, neither involved in the present work.

Figures

Figure 1.
Figure 1.. Mycobacteriophages with glycosylated virions.
A and B. SDS-PAGE analysis of mycobacteriophage virions. Replicate gels were stained with either Coomassie Blue (A) or glycostain (B). Molecular weight markers (M), a glycostain positive control (C), and phages as labeled are shown. The major glyco-stained bands in Che8 and Corndog and the three Myrna glyco-stained bands labeled 1, 2, and 3 were excised for analysis by MS/MS. C. Genome segments of phages Che8, Corndog, and Myrna encoding glycosyltransferase genes. Genes are shown as colored boxes above the genome ruler and putative functions are indicated. D. Glycopeptide CID-MS/MS spectra from the tail tube subunit of Corndog (gp49, top), the capsid subunit from Che8 (gp6, middle) and a minor capsid subunit of Myrna (gp98, bottom) from band 1; the precursor ions were m/z 1516.63+, m/z 1202.83+ and m/z 1351.45+, respectively (underlined in Fig. S1). Glycan oxonium ions (m/z 163.1, 204.1, 325.2, 366.1, etc.) are present in the lower half of the MS/MS spectra. Partial methylation of hexoses in Corndog and Che8 is evident by the presence of the oxonium ions at m/z 177.1, 339.2 and 380.2. Fragment ions corresponding to the peptide (Pep) and the peptide linked to HexNAc (Pep+HexNAc) are identified in all the MS/MS spectra. Ions marked with an asterisk in the Corndog spectrum are derived from a co-eluting peptide and are un-related to the glycopeptide under investigation. Details of the MS analyses are in Supplementary Data Set 1. HexNAc, N-Acetylhexosamine, Hex, unmodified hexose, Me, methyl.
Figure 2.
Figure 2.. Che8 110 is required for glycosylation.
A and B. A sgRNA-expressing plasmid was designed to target Che8 gene 110 encoding a putative N-acetyl-galactosyl transferase. When sgRNA and Cas9 expression is induced (+ATc) the efficiency of plaquing of Che8 is reduced approximately two orders of magnitude (panel B). Candidate CRISPR-escape mutants were isolated and one was shown to contain a seven base pair deletion (underlined) within the sequence targeted by the sgRNA (blue type). The reading frame shift produces a truncated variant of gp110 (amino acids in red type). C. SDS-PAGE of Che8 and Che8Δ110-1 virions, stained with either Coomassie Blue or Glycostain as indicated. Seven bands are resolved in the 37 kDa size range in wild type Che8, all of which are glycosylated. In Che8Δ110-1 these collapse to a single band containing both the major capsid (29.04 kDa) and tail tube subunits (29.78 kDa), both of which are unglycosylated. D. An expanded view of the glycosylated Che8 proteins, and a schematic of the arrangements of sugars in each band. HexNAc, N-Acetylhexosamine, Hex, unmodified hexose, Me, methyl. Further mass spectrometry analysis is shown in Figure S1 and in Supplementary Data Set 2. E. Viability of wild type and mutant Che8 particles with titers starting at either 1011 or 1012 pfu/mL after prolonged storage at room temperature or 4 °C. Averages of two or three technical replicates and standard error bars are shown. F. Adsorption of wild type and mutant Che8 to M. smegmatis. G. Fecundity of wild type and mutant Che8 as determined by the number of infectious particles in individual plaques. Six technical replicates are shown as individual datapoints on top of a box plot indicating the mean (central line) +/− one standard error (box boundaries).
Figure 3.
Figure 3.. Cryo-EM structures of Che8 and Che8 Δ110-1 capsids.
A. The non-glycosylated Che8 Δ110-1 capsid (gray) aligned with a difference map of the Che8 and Che8 Δ110-1 capsid densities (red). Excess red density at each capsomere is capsid glycosylation. B. The model of a single hexamer of the major capsid protein from the Che8 wild type (PDB:8E16) highlighting the C-terminal serine 273 in red. C. The wild type Che8 major capsid protein model (PDB:8E16) fitted into the cryo-EM map (EMD-27824) contoured at level 2. An O-glycosylated alpha-D-galactopyranose-(1–3)-2-acetamido-s-desoxy-beta-D-glucopyranose glycan has been modeled into the density on the right for illustration purposes. D. The wild type capsid compared to the Che8 Δ110-1 mutant at the putative glycosylation site. Both maps have been contoured at the same level.
Figure 4.
Figure 4.. Glycosylation shields wild-type Che8 from antibody recognition.
A. Timeline of the C57BL/6J mouse study. Mice were inoculated with PBS, wt Che8, or Che8 Δ110-1 (Table S3) and serum collected via submandibular bleed as indicated. A second dose was administered at four weeks, after serum collection, and at five weeks mice were sacrificed and terminal sera and spleens were harvested. B and C. ELISA were used to quantify IgM (B) and IgG (C) titers in sera from mice inoculated with wild type Che8 (left panels) and Che8Δ110-1 (right panels) at the indicated timepoints. Box plots show half-maximal titers for individual mice with a line showing mean values and the boxes representing the mean value +/− 1 standard error. Two sample t-tests were performed between relevant pairs and P values are shown where differences are significant. Antibody recognition of wild type Che8 and the Che8Δ110-1 mutant are shown in red and blue, respectively. D. Multicolor flow cytometry was gated as shown in Figure S4. Shown are proportions of CD19 B220 vs CD19+ B220+ B cells in the live, single lymphocyte population; of CD3+ vs CD3 cells in the CD19 B220 population; and of CD4+ and CD8+ T cell subtypes in the CD3+ population. E. Phage neutralization by serum was determined by incubating phages with sera and measuring reductions in phage titers from the starting input (109 pfu/ml). Each panel presents the average +/− standard error neutralization of Che8 (left) and Che8Δ110-1 (right) by sera from mock–, Che8– or Che8Δ110-1–inoculated mice shown in black, red, and blue, respectively. F. Western blots showing IgG reactivity to virion proteins of Che8 (wt) and Che8Δ110-1 (Δ) in sera collected from individual mice (as shown below each blot) five weeks after inoculation; molecular weight makers, M. Upper and lower panels use sera from Che8-inoculated and Che8Δ-inoculated mice, respectively. Serum from mock-inoculated mice were pooled. Panel at the upper right shows Coomassie stained proteins used in the Western blots. Putative protein identities are indicated. G. Western blot (left) using normal human serum showing some reactivity to virion proteins (left panel), but no phage neutralization (right panel).
Figure 5.
Figure 5.. Antibody production in individual mice.
The sera from four individual mice at each timepoint were used in A. ELISAs, B. neutralization assays, and C. Western blots. Mice 2–1 and 2–4 were immunized with wild type Che8, while mice 3–2 and 3–4 were immunized with Che8 Δ110-1, as indicated above each dataset (see also Table S3). Logistic fits of the ELISA curves yield half-maximal serum titers of antibodies that bind to both wild type Che8 (red) and Che8 Δ110-1 (blue), as well as uncoated wells (black). Neutralization assays were performed against both phages, as indicated above the plaque plate images. Western blots probe the reactivity of the mouse sera to both wild type Che8 (wt, red) and Che8 Δ110-1 (Δ blue) and were exposed for 2 minutes 59.4 seconds for sera from mice immunized with wild type Che8 while Western blots using sera from Mouse 3–2 and Mouse 3–4 (dosed with Che8 Δ110) were exposed for 18.4 seconds. D. Immunogold staining of wild type and mutant Che8 particles. Sera from mice 2–4 and 3–2 collected at week 2 were tested and the numbers of gold particles per virion (total) or binding to either capsid or tail are plotted (three rightmost panels). Datapoints are shown for at least 24 virions imaged for each and represented as box plots with lines showing mean values and boundaries of +/− one standard error. Representative micrographs are shown at the left; scale bar corresponds to 100 nm.
Figure 6.
Figure 6.. Glycosylation in other actinobacteriophages.
A. Cluster F phages coding for glycosyltransferases. Cluster F is a large group (216 individual phage members) of mycobacteriophages organized into five subclusters (F1 – F5). All of the phages code for glycosyltransferases, arranged into four different organizations, represented by phages DeadP, Akhila, Che8, and Cornie (subcluster designations are shown in parentheses). The organization represented by Akhila is the most common and is in 85% of Cluster F phages; the Che8, DeadP, and Cornie organizations are less common and are present in 20, 3 and 1 Cluster F phages, respectively. Segments from the extreme right ends of the genome are shown with genes shown as colored boxes; all genes shown are transcribed rightwards and are colored according to their phamily assignments (i.e. sequence-related genes are similarly colored). Shading between genomes reflects BLASTN pairwise similarity and is spectrum colored with violet being the most similar and red the least similar above a threshold E value of 10−4. Putative functions are noted above the genes: Mtf, methyltransferase; Gtf, glycosyltransferase; HNH, homing endonuclease; S/T kinase, serine-threonine kinase). B. Cluster J phages coding for glycosyltransferases. Genomes are represented as in panel A, with genes above and below each genome transcribed rightwards and leftwards, respectively. C. Organizations of phages Fionnbharth and Nebkiss from Clusters/Subclusters K4 and X, respectively. Maps are annotated as in panels A and B. For Nebkiss, the extreme left and right genome ends have been joined at cos, as they are in replicating genomes. Fionnbharth gp6 and Nebkiss gp166 are related Gtf’s containing Stealth CR2 domains. D. Evidence of glycosylation of Fionnbharth, Omega and Nebkiss virions. Phage proteins were separated by SDS-PAGE and stained by either Coomassie (left) or Glycostain (right), as in Figure 1.

References

    1. Feng T, Zhang J, Chen Z, Pan W, Chen Z, Yan Y, and Dai J (2022). Glycosylation of viral proteins: Implication in virus-host interaction and virulence. Virulence 13, 670–683. 10.1080/21505594.2022.2060464. - DOI - PMC - PubMed
    1. Zhao X, Chen H, and Wang H (2021). Glycans of SARS-CoV-2 Spike Protein in Virus Infection and Antibody Production. Front Mol Biosci 8, 629873. 10.3389/fmolb.2021.629873. - DOI - PMC - PubMed
    1. Vigerust DJ, and Shepherd VL (2007). Virus glycosylation: role in virulence and immune interactions. Trends Microbiol 15, 211–218. 10.1016/j.tim.2007.03.003. - DOI - PMC - PubMed
    1. Chamontin C, Bossis G, Nisole S, Arhel NJ, and Maarifi G (2021). Regulation of Viral Restriction by Post-Translational Modifications. Viruses 13. 10.3390/v13112197. - DOI - PMC - PubMed
    1. Wagh K, Hahn BH, and Korber B (2020). Hitting the sweet spot: exploiting HIV-1 glycan shield for induction of broadly neutralizing antibodies. Curr Opin HIV AIDS 15, 267–274. 10.1097/COH.0000000000000639. - DOI - PMC - PubMed

LinkOut - more resources