. 2023 Aug 8;35(8):1457-1473.e13.
doi: 10.1016/j.cmet.2023.05.009. Epub 2023 Jun 16.

Molecular mechanisms of snoRNA-IL-15 crosstalk in adipocyte lipolysis and NK cell rejuvenation

Affiliations

Molecular mechanisms of snoRNA-IL-15 crosstalk in adipocyte lipolysis and NK cell rejuvenation

Yaohua Zhang et al. Cell Metab. .

Abstract

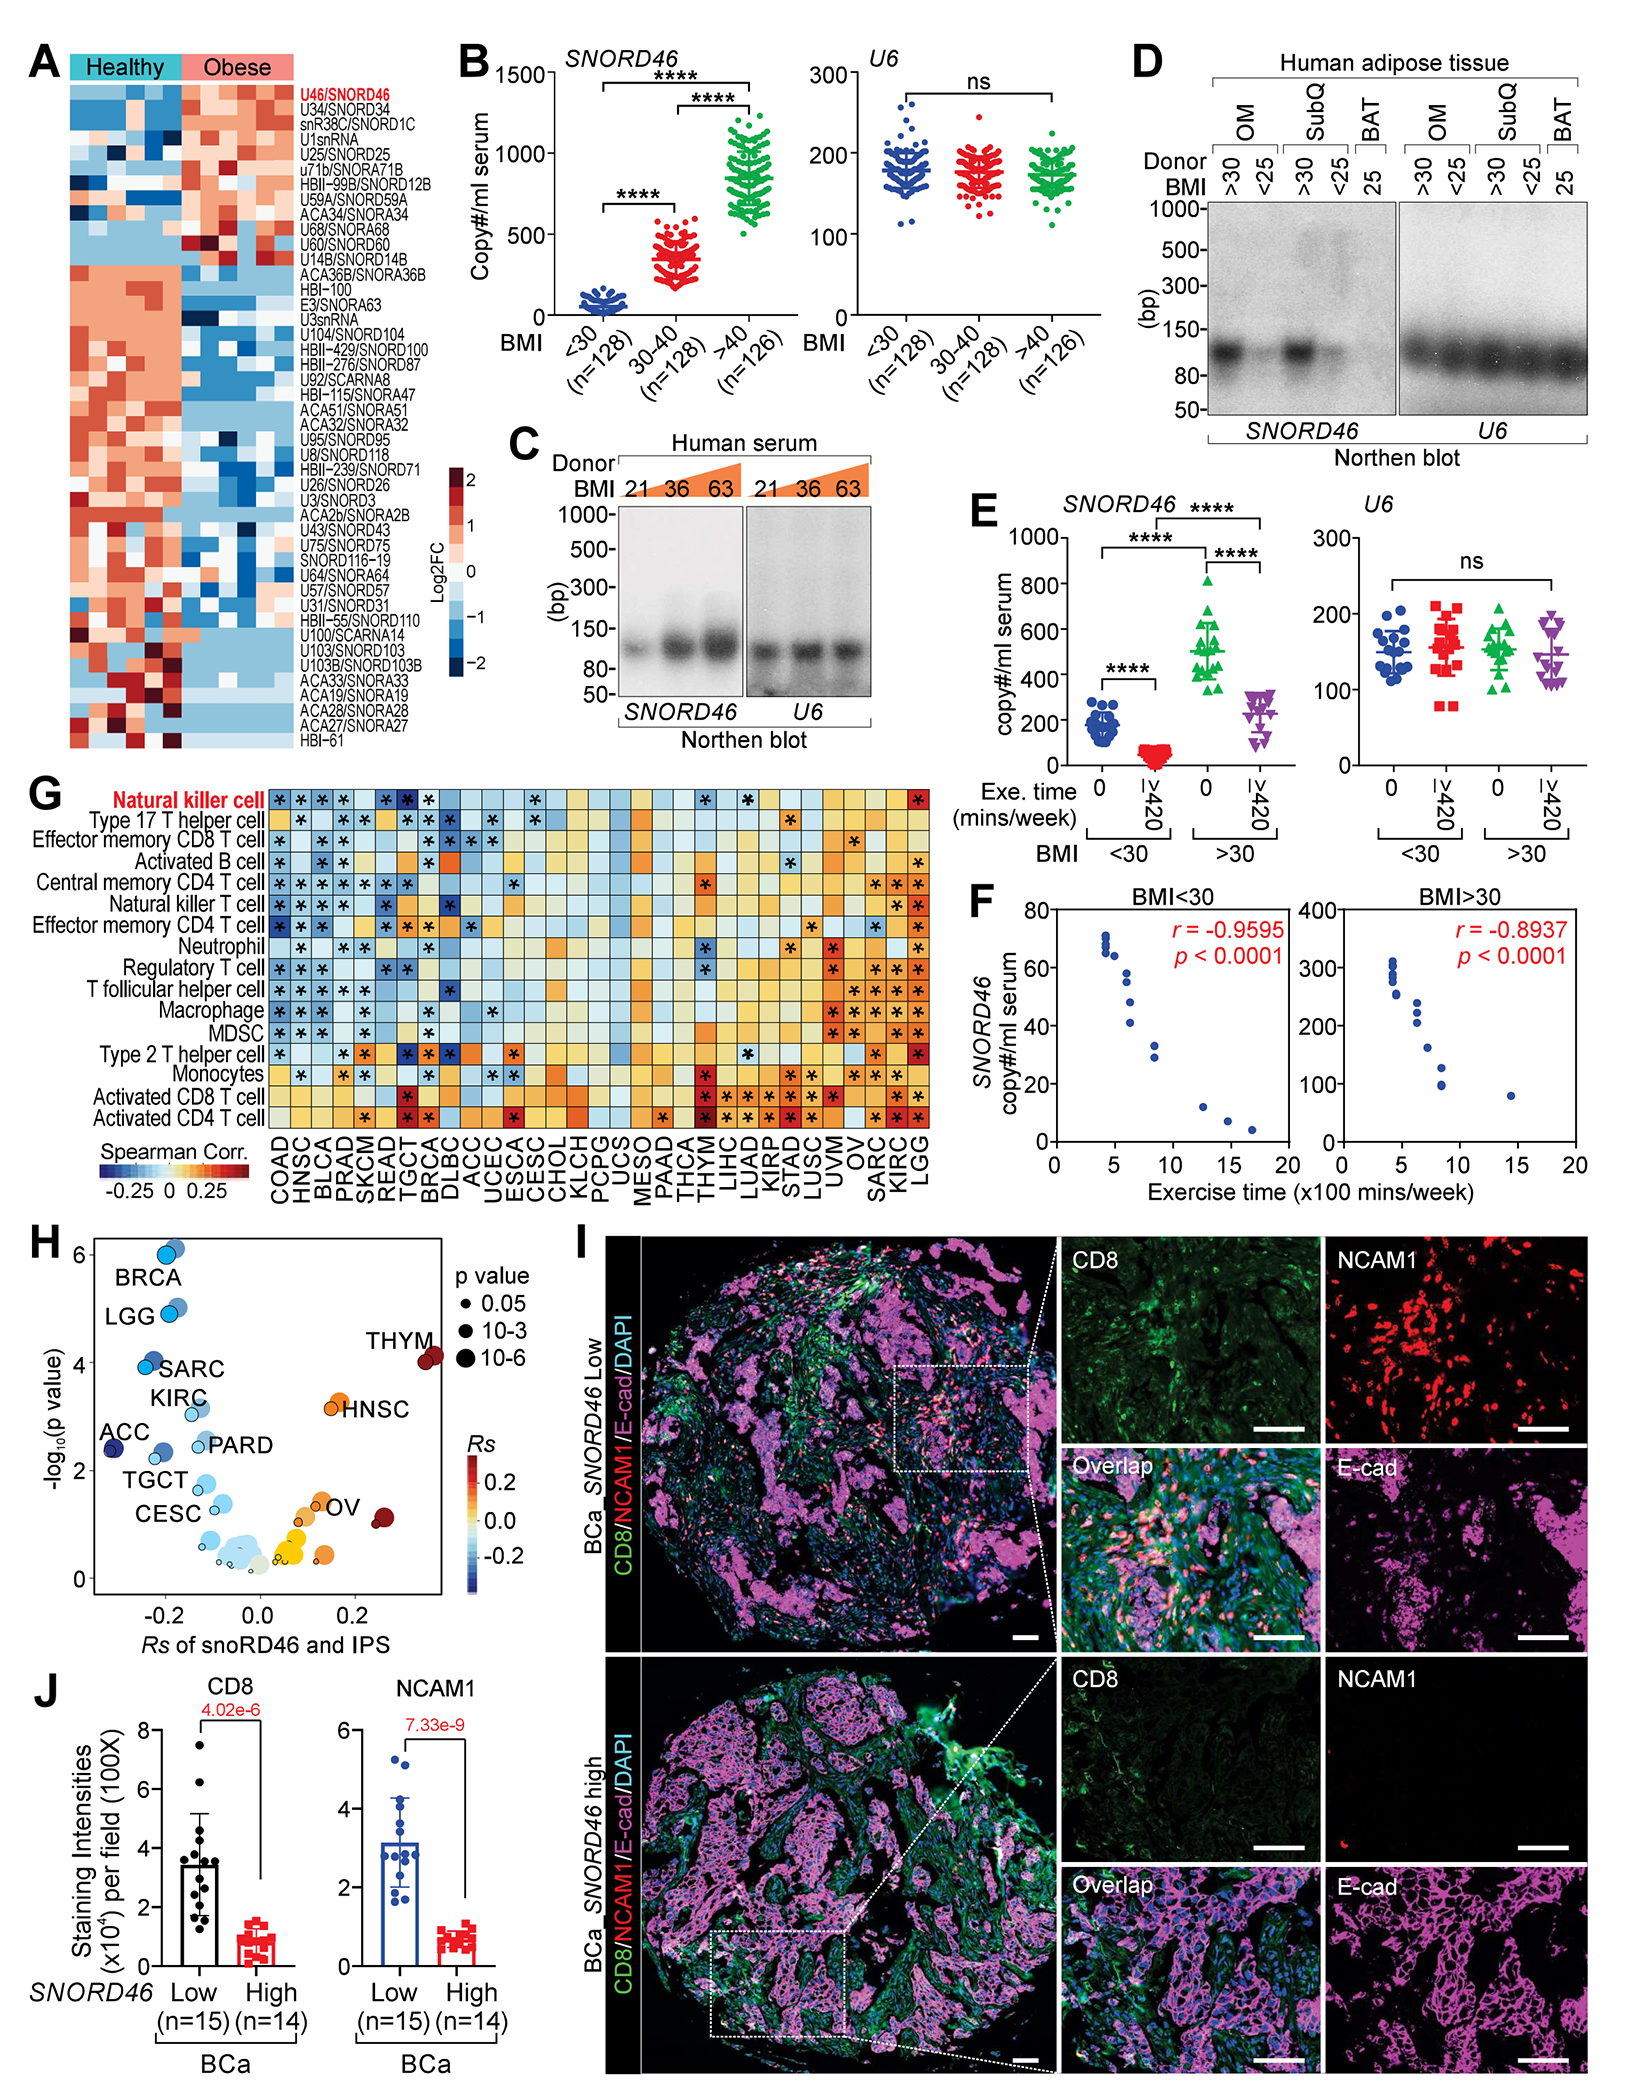
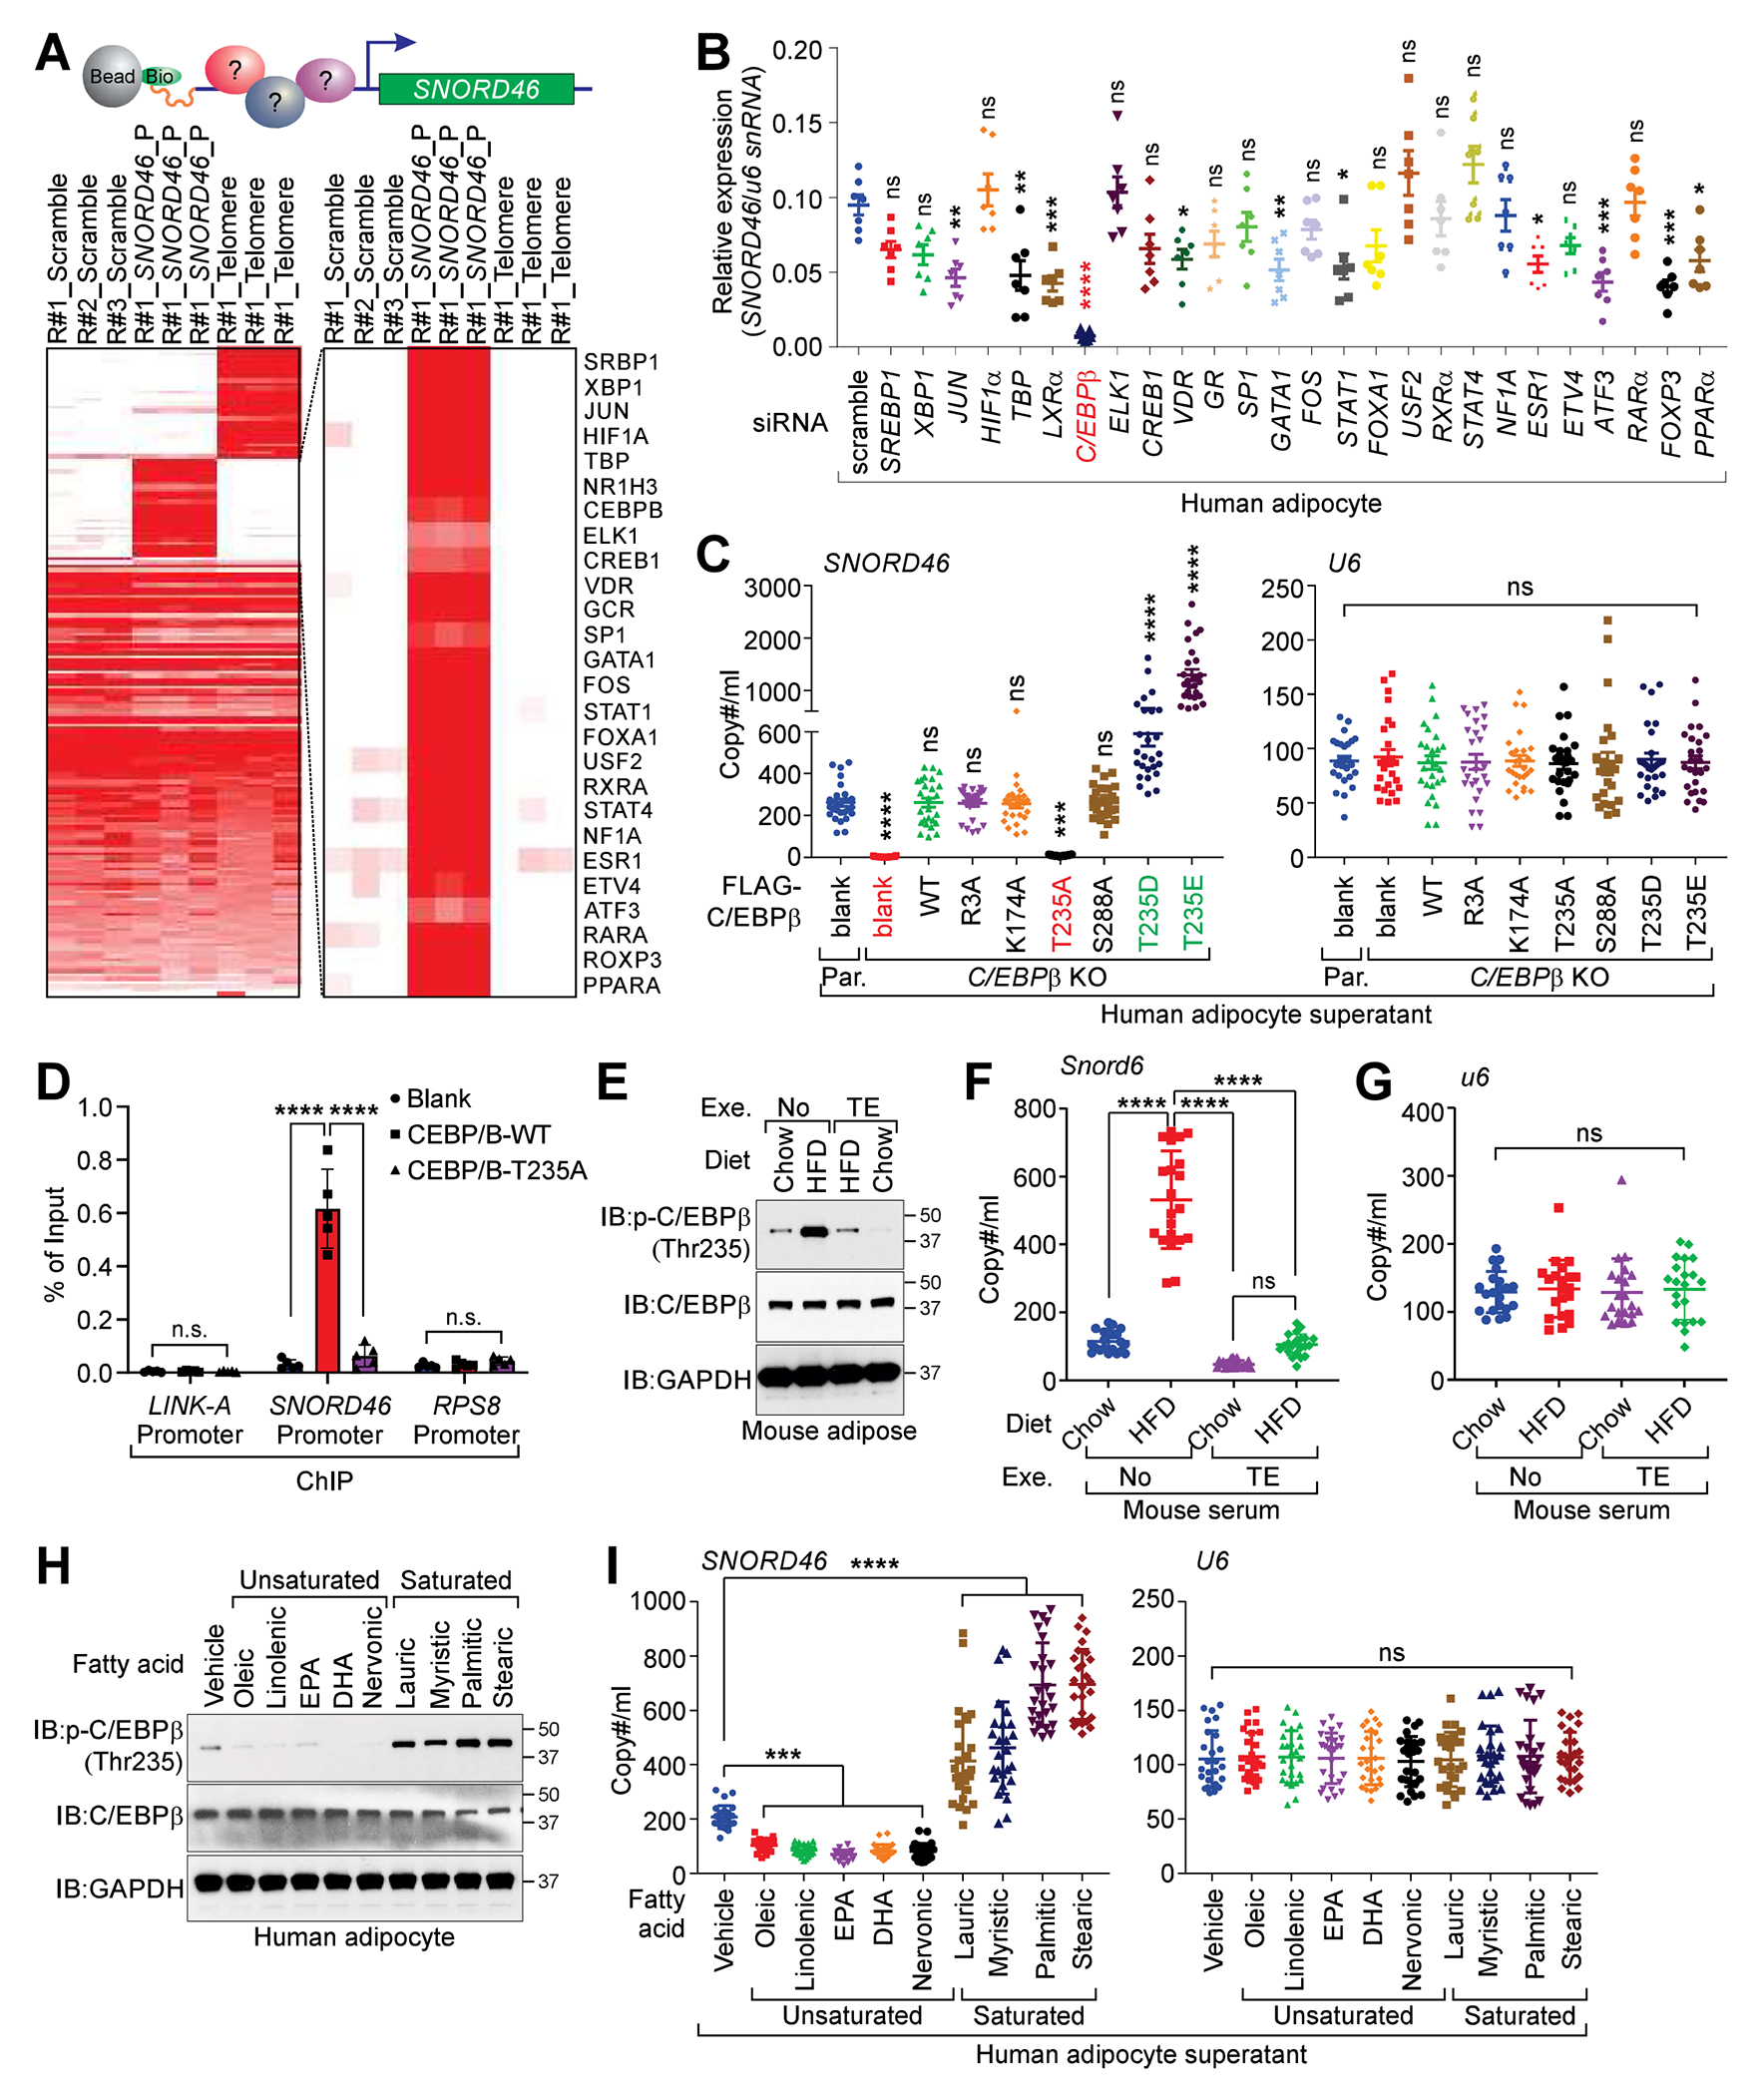
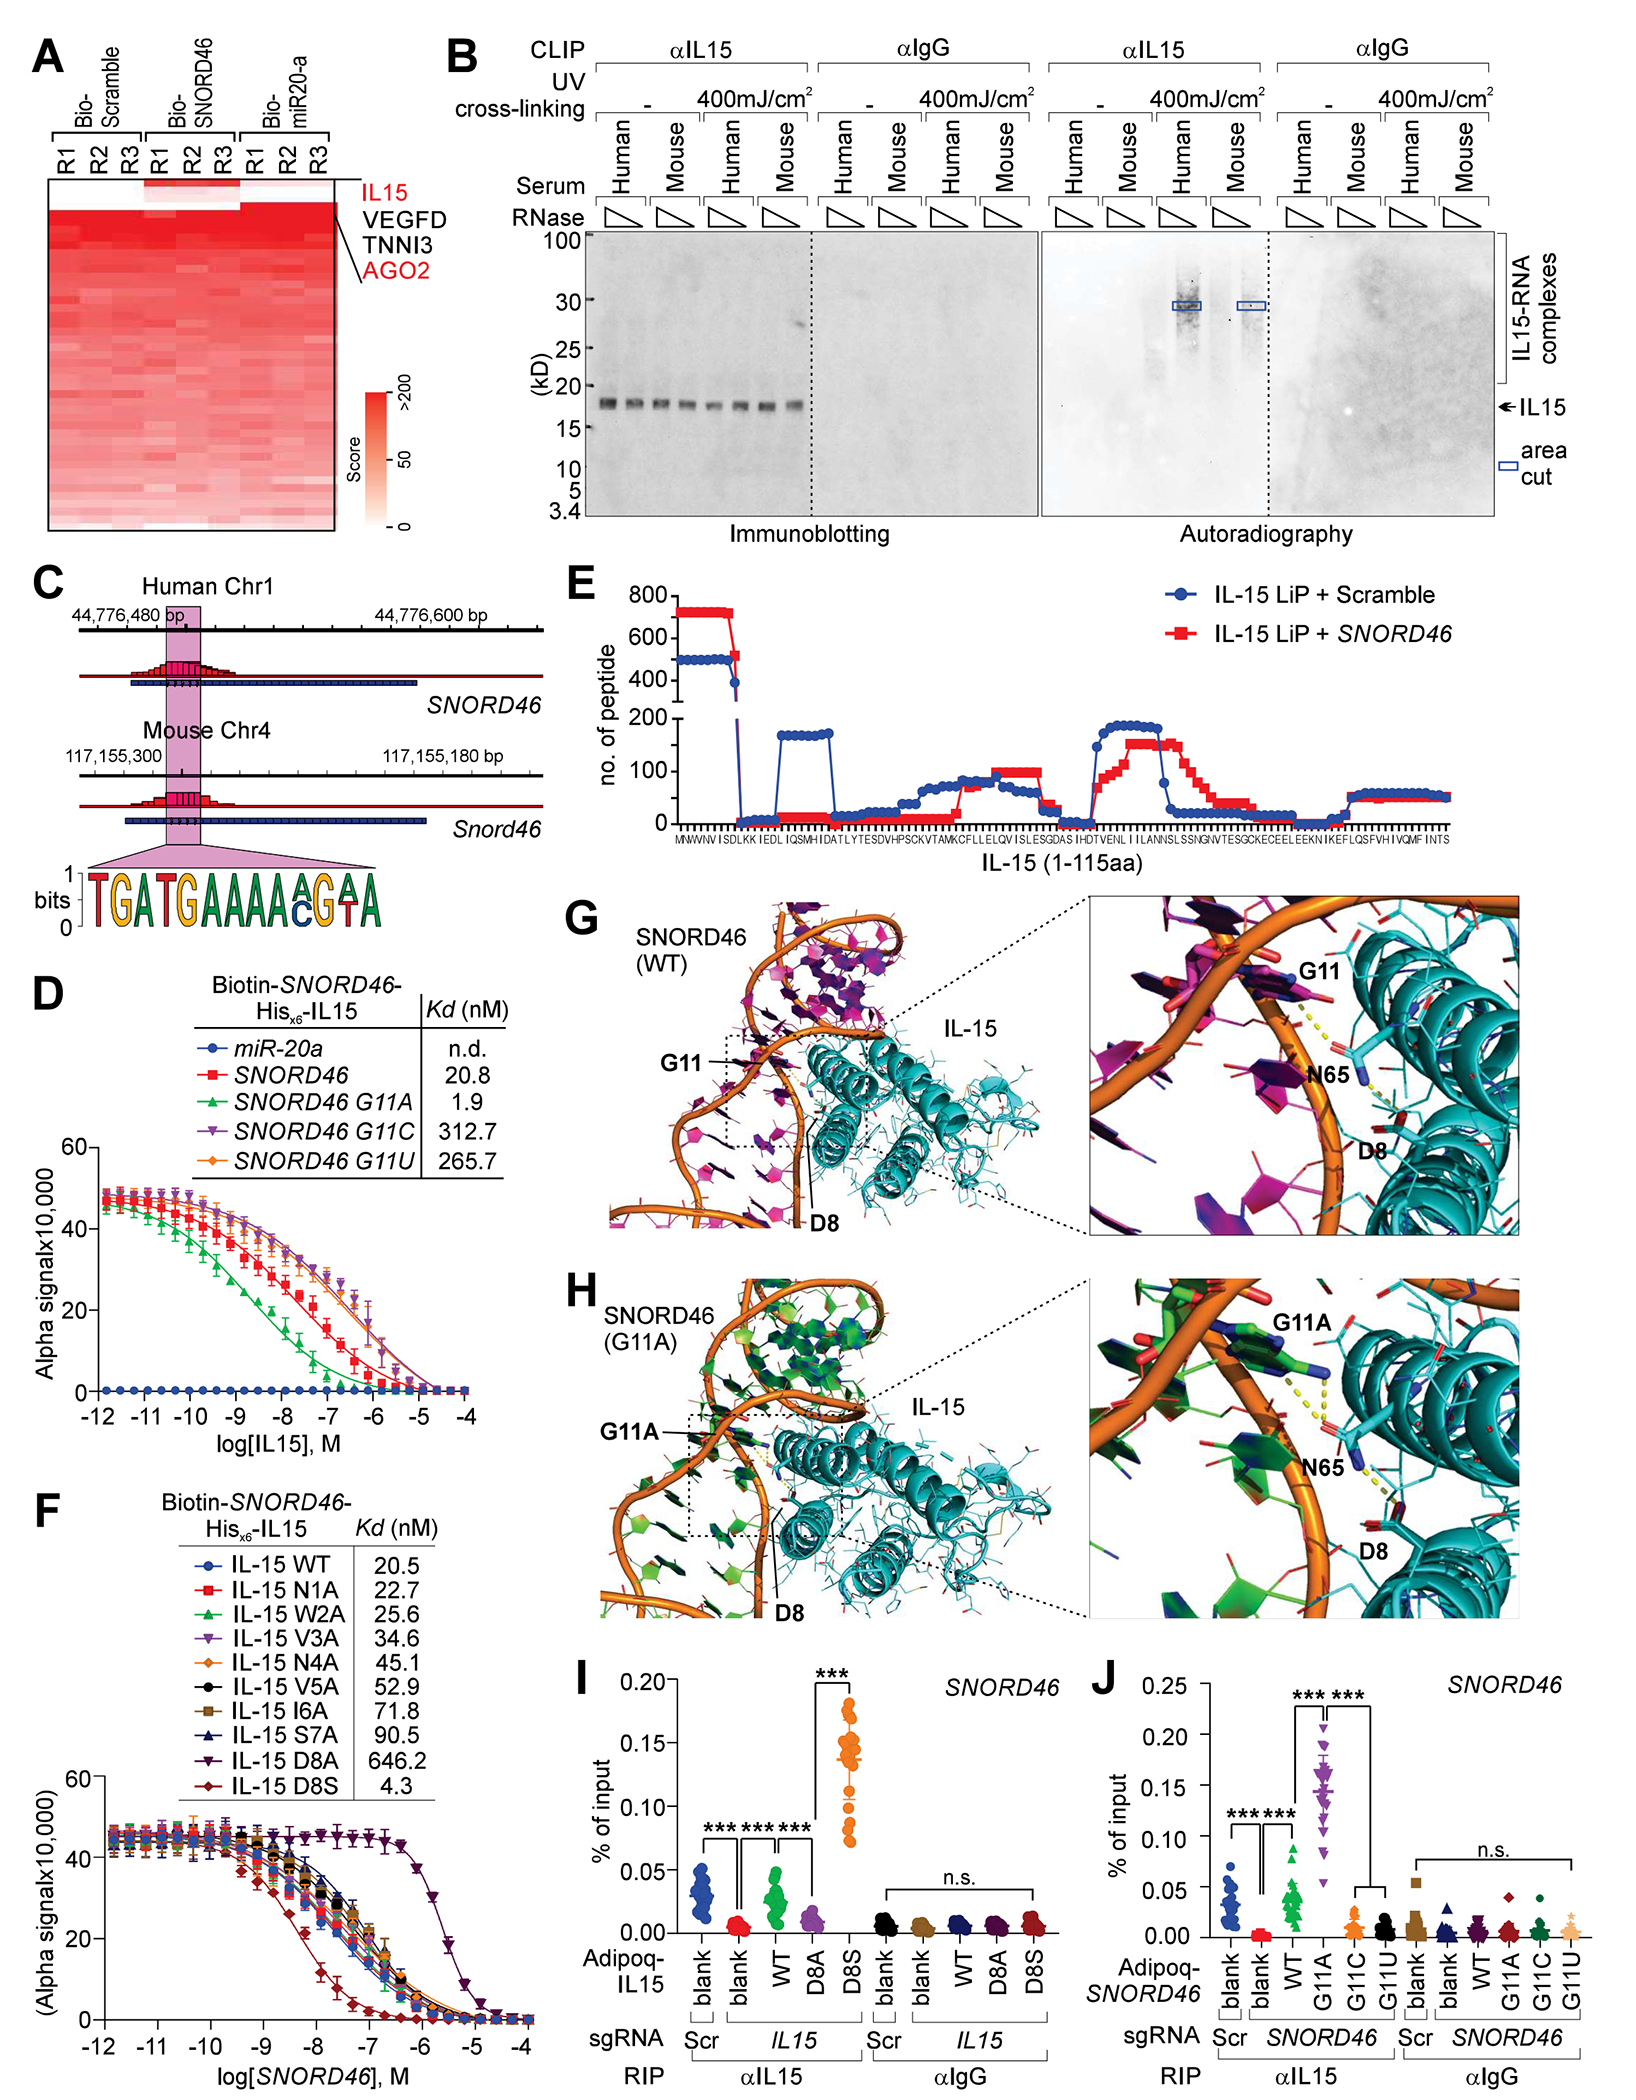
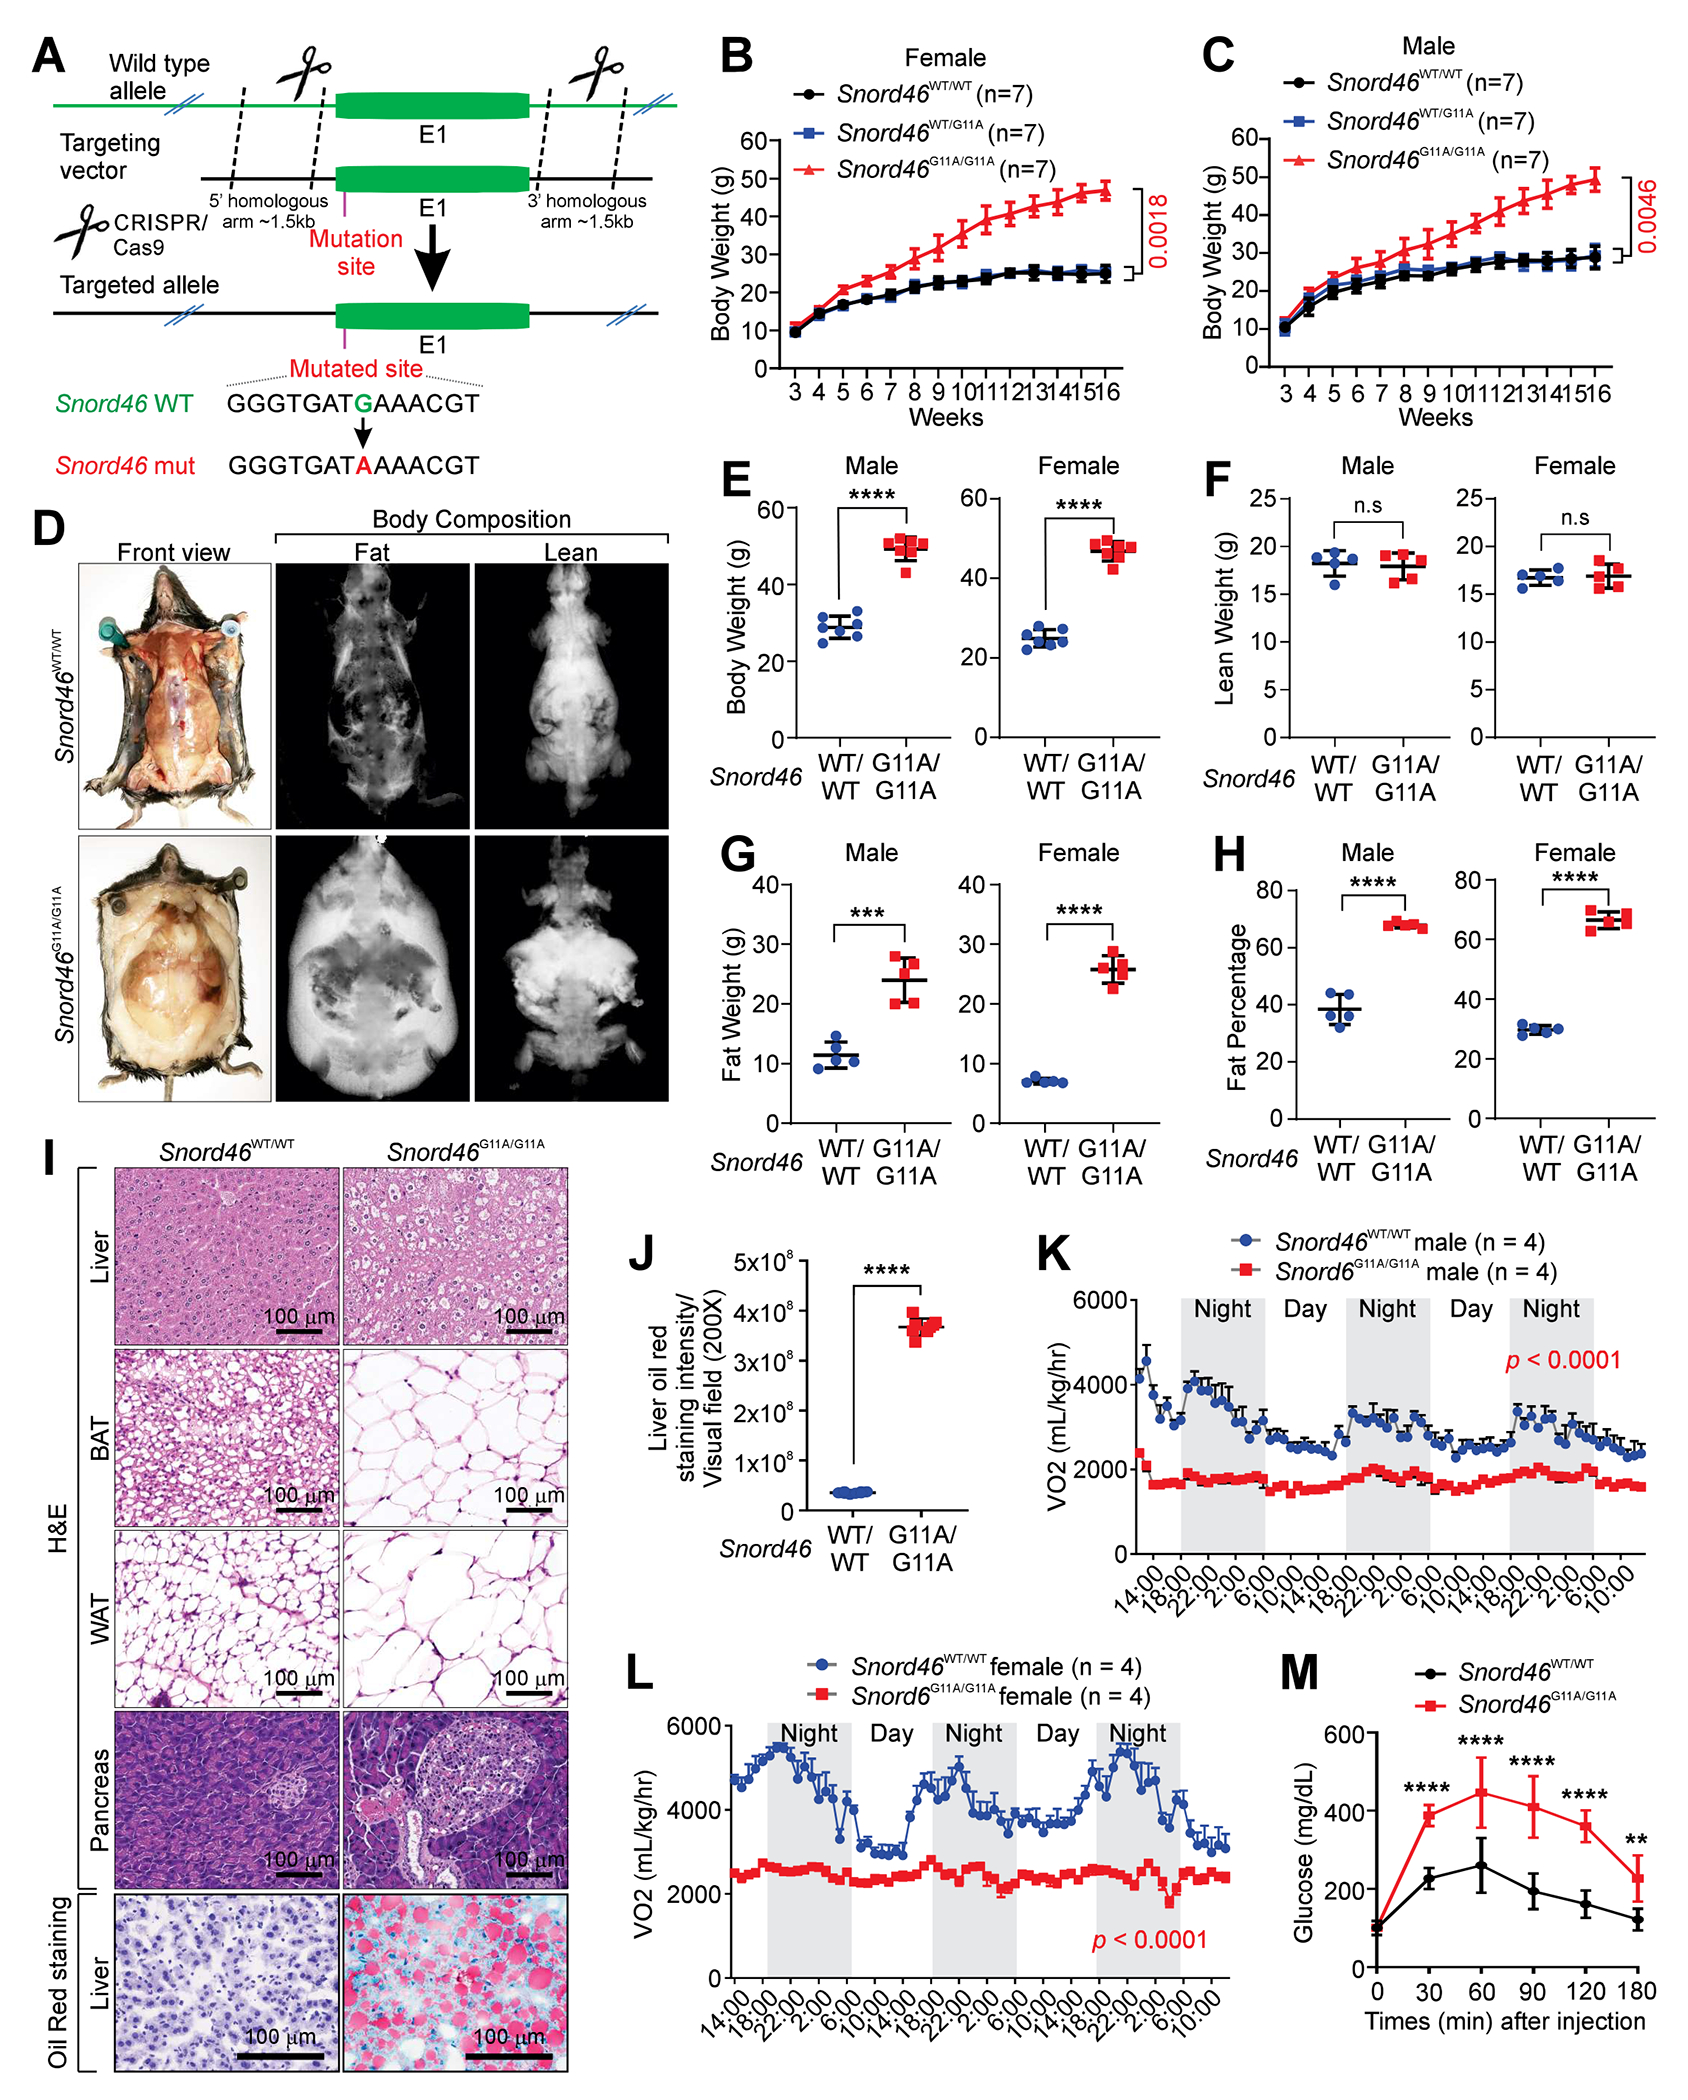
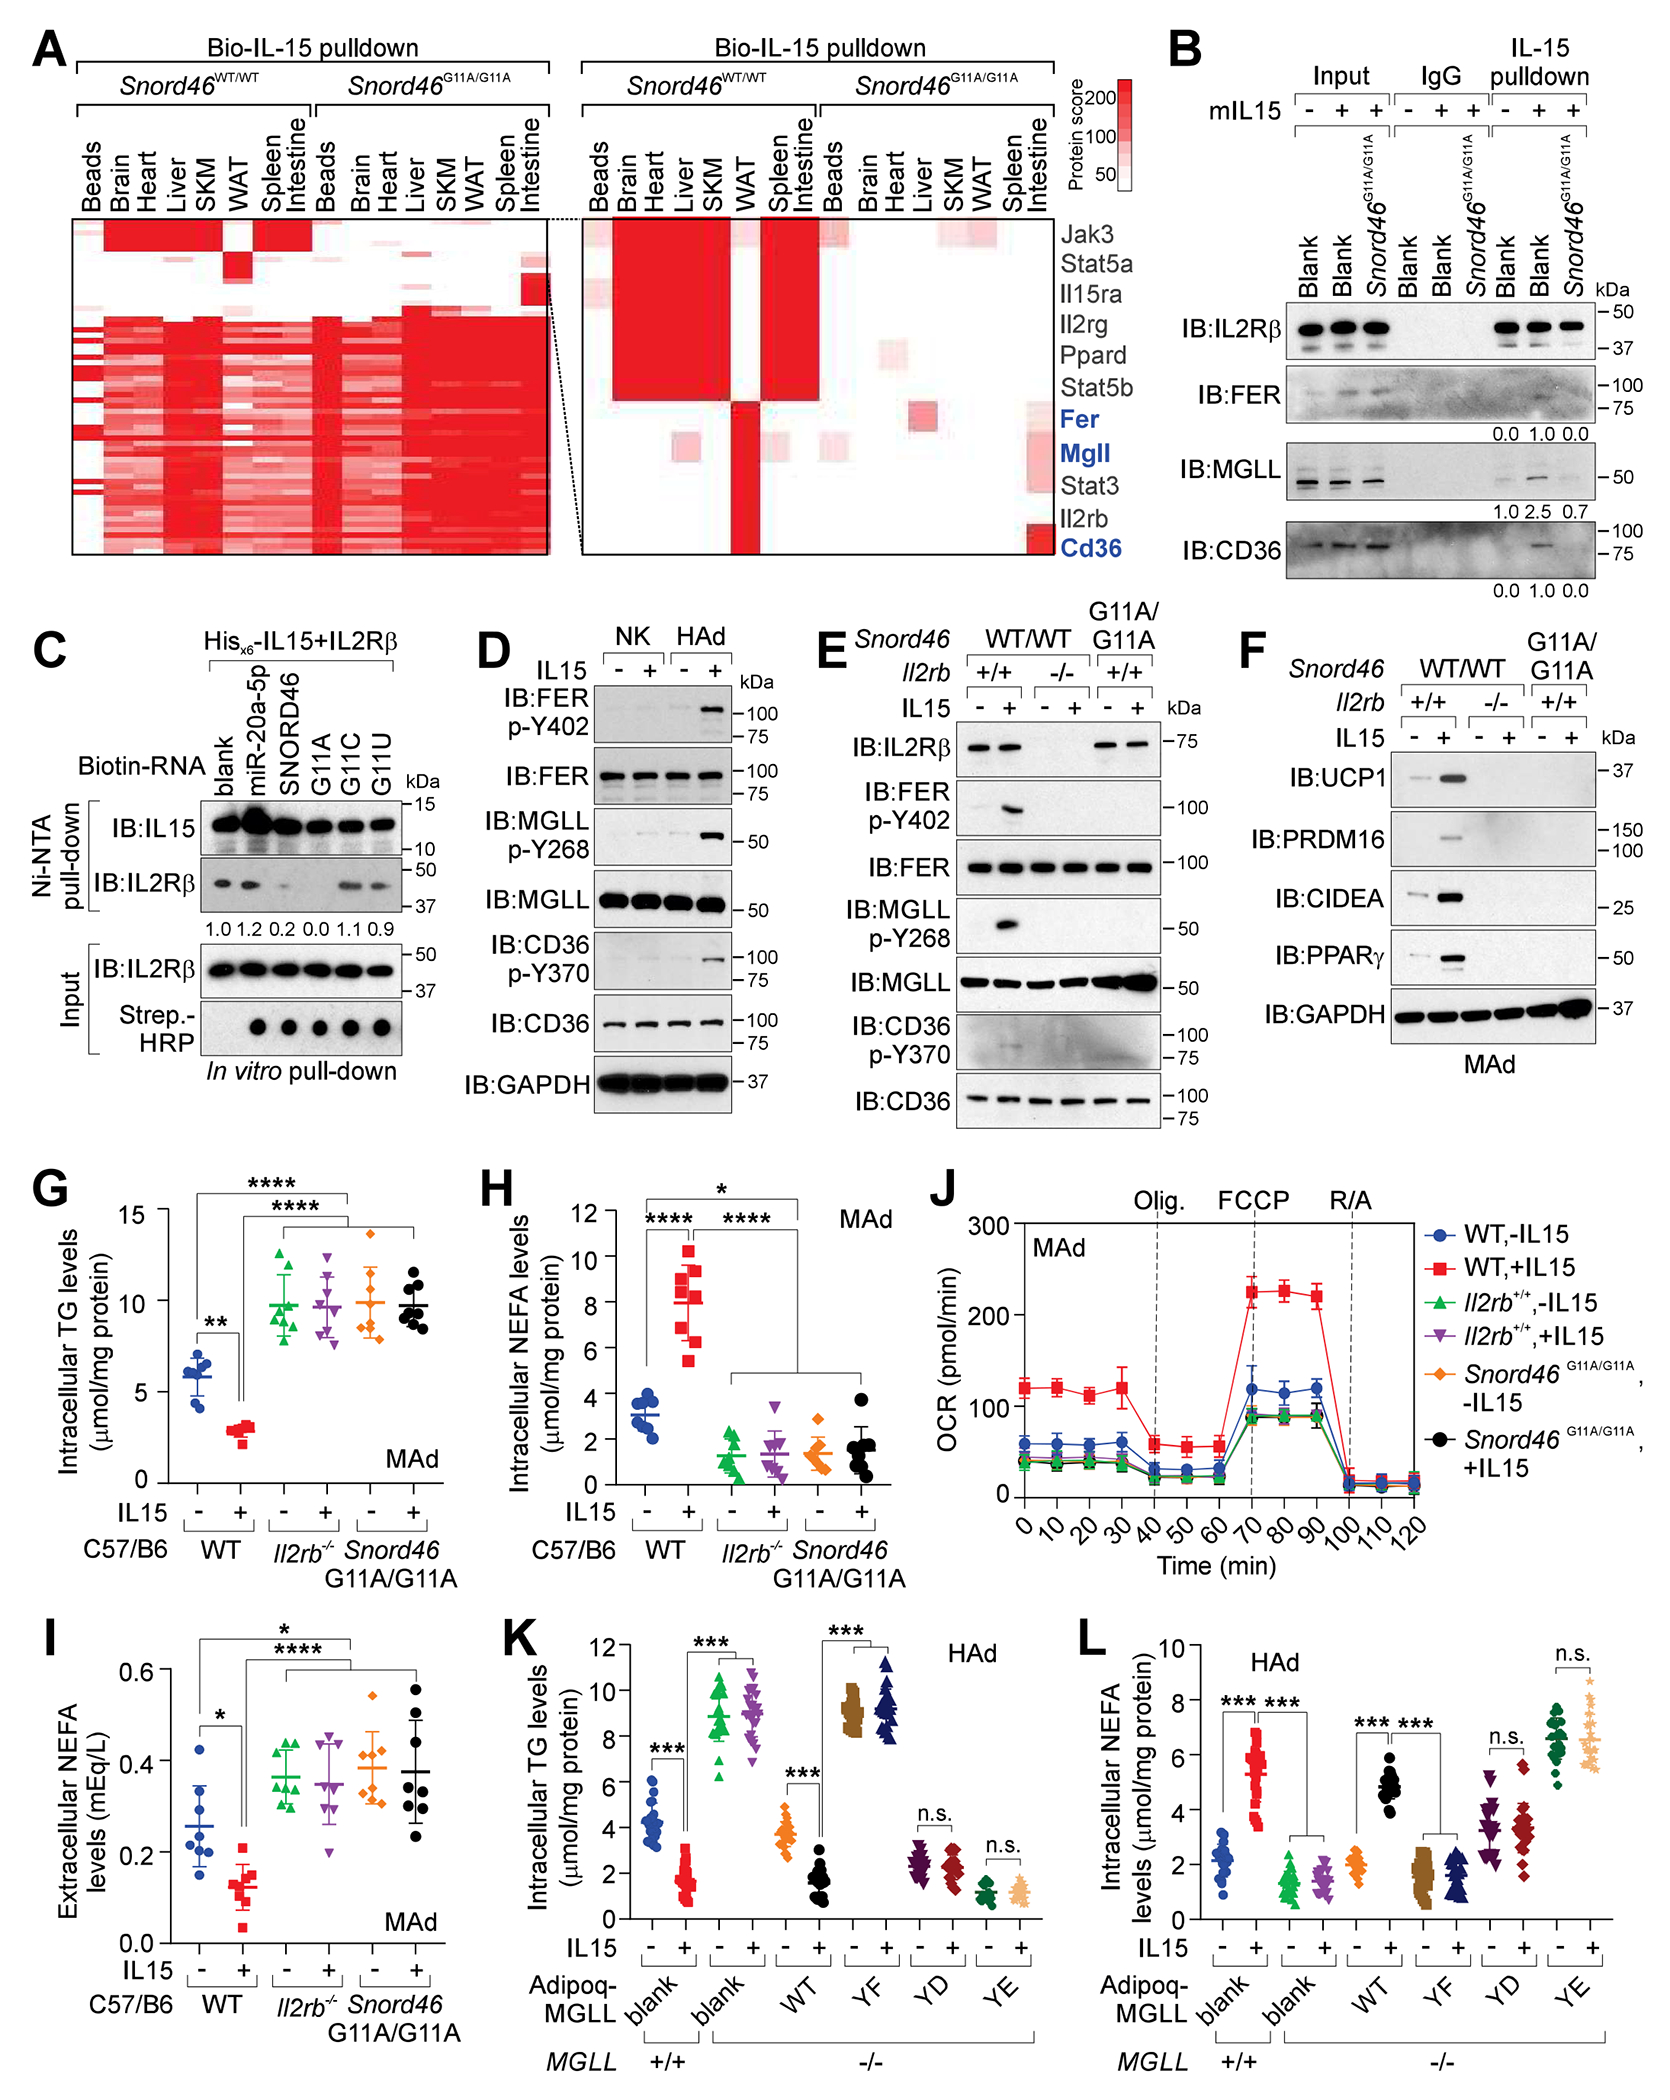
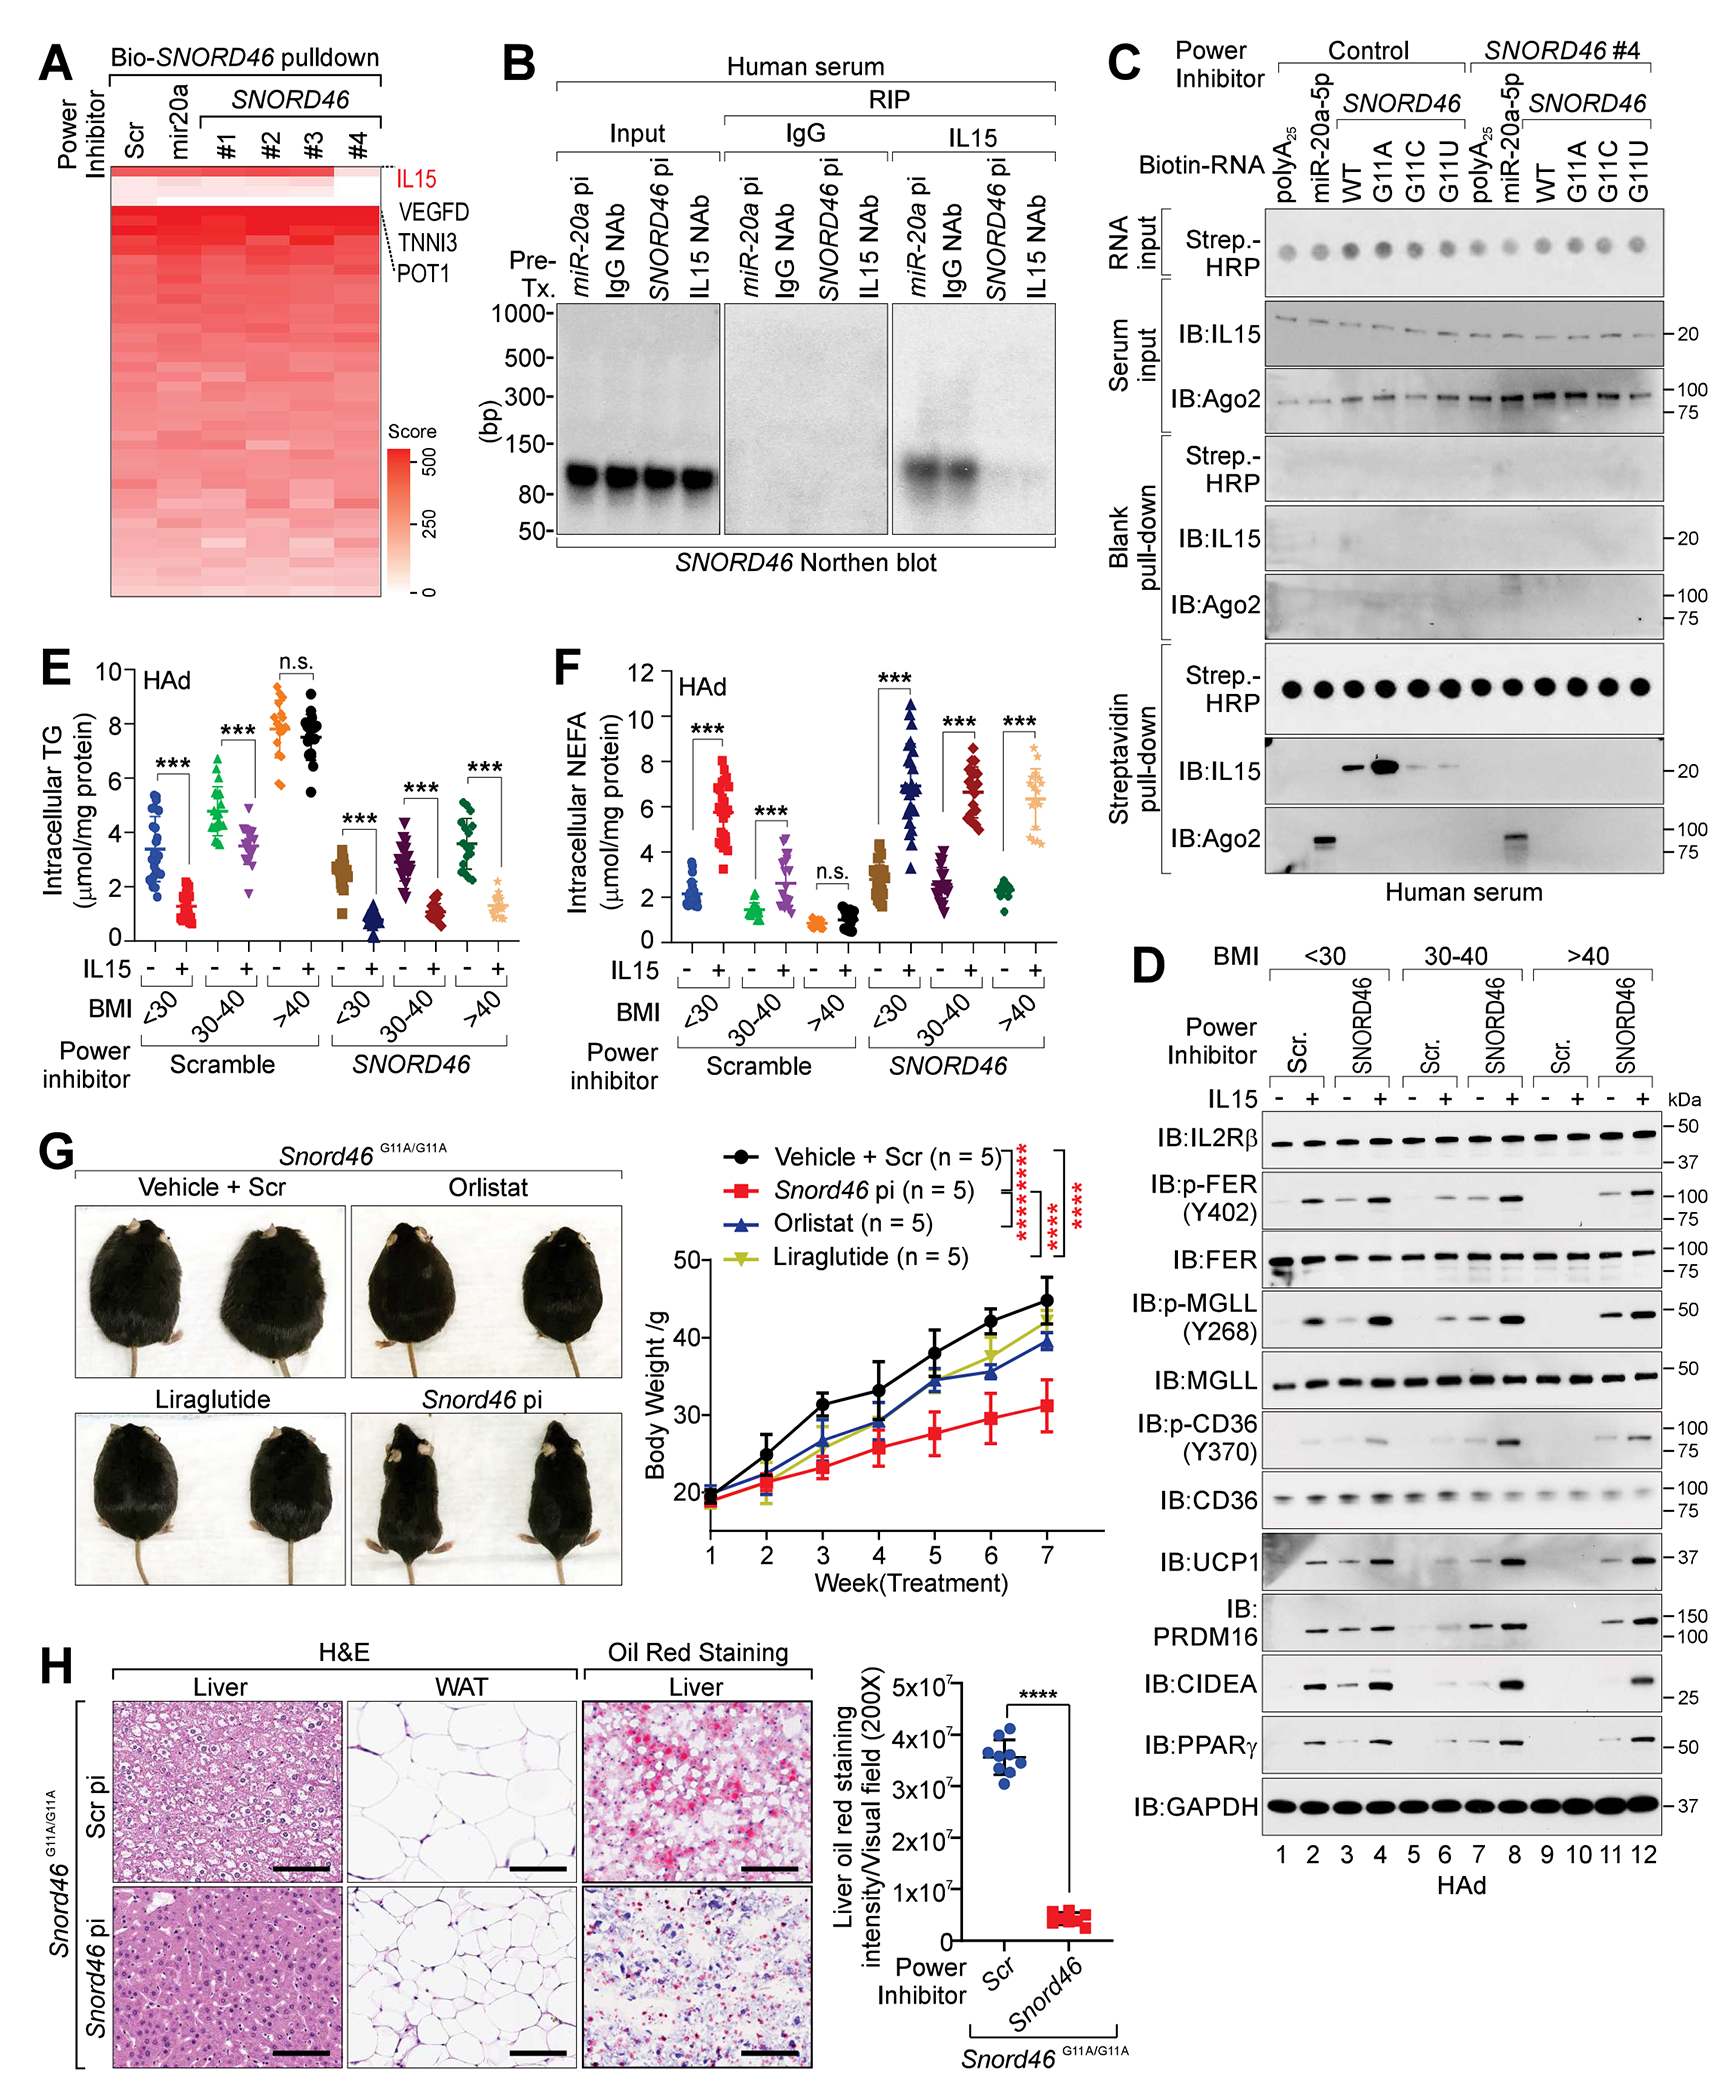
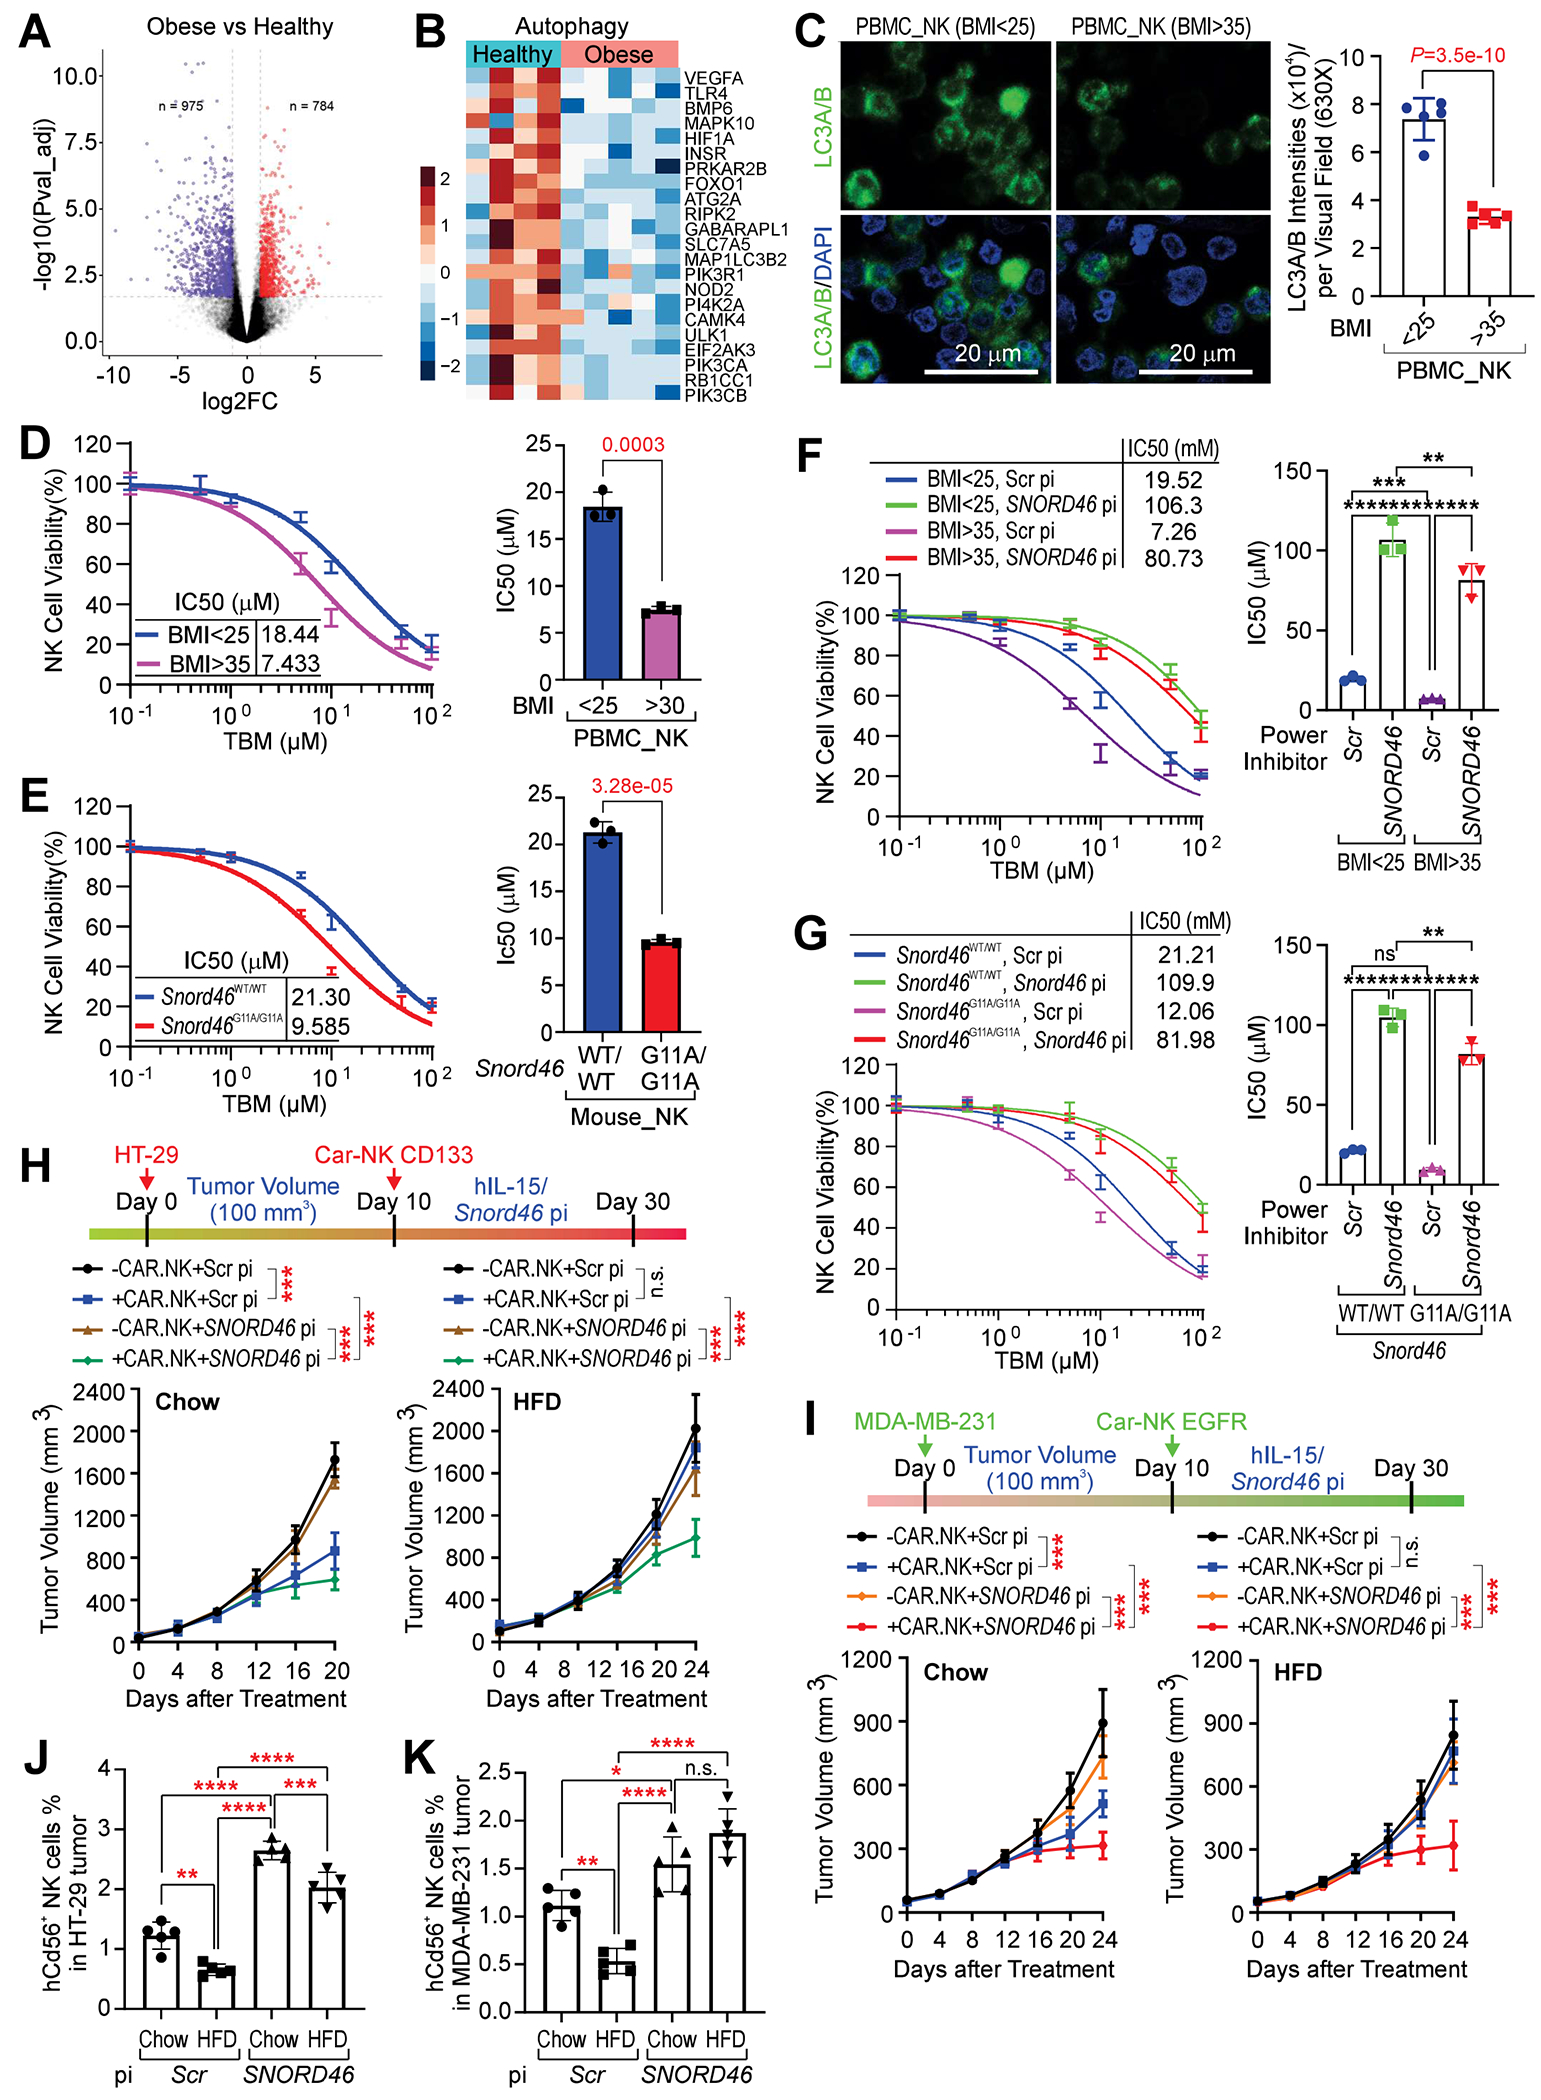
Obesity, in which the functional importance of small nucleolar RNAs (snoRNAs) remains elusive, correlates with risk for many cancer types. Here, we identify that the serum copies of adipocyte-expressed SNORD46 correlate with body mass index (BMI), and serum SNORD46 antagonizes interleukin-15 (IL-15) signaling. Mechanically, SNORD46 binds IL-15 via G11, and G11A (a mutation that significantly enhances binding affinity) knockin drives obesity in mice. Functionally, SNORD46 blocks IL-15-induced, FER kinase-dependent phosphorylation of platelet glycoprotein 4 (CD36) and monoglyceride lipase (MGLL) in adipocytes, leading to inhibited lipolysis and browning. In natural killer (NK) cells, SNORD46 suppresses the IL-15-dependent autophagy, leading to reduced viability of obese NK. SNORD46 power inhibitors exhibit anti-obesity effects, concurring with improved viability of obese NK and anti-tumor immunity of CAR-NK cell therapy. Hence, our findings demonstrate the functional importance of snoRNAs in obesity and the utility of snoRNA power inhibitors for antagonizing obesity-associated immune resistance.

Keywords: adipocyte; autophagy; interleukin-15; lipase; natural killer cells; obesity; small nucleolar RNA.


Conflict of interest statement

Declaration of interests M.A.C. reports grants and personal fees from ImmunoGenesis, Inc. and personal fees from Alligator Bioscience, Inc.; ImmunOS, Inc.; Oncoresponse, Inc.; Nurix, Inc.; Aptevo, Inc.; Kineta, Inc.; Xencor, Inc.; Agenus, Inc.; Adagene, Inc.; and Astrazeneca, Inc. outside the submitted work. K.R. and the University of Texas MD Anderson Cancer Center have an institutional financial conflict of interest with Takeda Pharmaceutical and Affimed GmbH. K.R. participates on the Scientific Advisory Board for GemoAb, AvengeBio, Virogin Biotech, GSK, Caribou Biosciences, Navan Technologies, and Bayer. B.G. is an inventor on patent applications involving targeting ferroptosis in cancer therapy and reports personal fees from Guidepoint Global, Cambridge Solutions, and NGM Bio.

Figures

Figure 1.
Figure 1.. SNORD46 correlates with BMI and immune resistance
(A) Heatmap of snoRNA expression of indicated human serum samples. (B) Copy number of SNORD46 (left) or U6 (right) in serum of human donors with BMI < 25, 30-40, or > 40 (n = 128, 128, 126 donors). (C and D) Northern blotting using indicated probes of indicated human serum (C), or human adipose tissues as indicated (D). (E) Copy number of SNORD46 (left) or U6 (right) in serum with indicated BMI, without or with exercise (0, ≥ 420 min/week), n = 18 donor per group, one-way ANOVA. (F) Pearson correlation between SNORD46 copy number and exercise time of donors with BMI < 30 (left) or BMI > 30 (right), n = 18 (BMI < 30), 18 (BMI > 30) donor, Fisher’s exact test. (G and H) The spearman’s correlation of SNORD46 expression and immune cell type enrichment (G) and immunophenoscore (IPS) (H) in 28 cancer types. (I and J) Representative multi-IHC images (I) and statistical analysis of CD8 and NCAM1 (J) of breast cancer tissues from serum SNORD46-high or SNORD46-low breast cancer patients. Scale bars, 100 μm. Error bars, SD, n = 15, 14 tissues, unpaired Student’s t-test.
Figure 2.
Figure 2.. C/EBPβ regulates the transcriptional expression of SNORD46
(A) Top: graphic illustration of PICh-MS determination using SNORD46 promoter region. Bottom: heatmap of the PICh-MS protein identification using scramble, SNORD46 promoter or telomere sequence as indicated. R: biological repeat. (B) Relative expression of SNORD46, normalized by U6 snRNA of differentiated human adipocyte harboring indicated siRNAs. Error bars, SD, n = 7 independent experiments, one-way ANOVA. (C) Copy number of SNORD46 (left) or U6 (right) in supernatant of C/EBPβ parental (Par.) or knockout (KO) adipocytes expressing indicated expression vectors. Error bars, SD, n = 26 donors, one-way ANOVA. (D) ChIP-qPCR detection of the C/EBPβ occupancy on LINK-A, SNORD46 or RPS8 promoter regions of differentiated human adipocytes expressing indicated expression constructs. Error bars, SD, n = 5 independent experiments, two-way ANOVA. (E) Immunoblotting (IB) detection of indicated proteins in adipose tissues from chow or HFD-fed mice with or without treadmill exercise (TE). (F and G) Serum Snord46 (F) or U6 (G) copy number in wild-type mice challenged with chow or HFD followed with or without treadmill exercise. Error bars, SD, n = 21 mice per group, one-way ANOVA. (H) IB detection of indicated proteins in differentiated human adipocytes supernatant upon indicated stimuli. (I) Copy number of SNORD46 (left) or U6 (right) in differentiated human adipocytes supernatant upon indicated stimuli. Error bars, SD, n = 26 donors, one-way ANOVA.
Figure 3.
Figure 3.. SNORD46 physically interact with IL15
(A) Heatmap of the protein identification score for biotinylated Scramble, SNORD46 or miR-20a pull-down. R: biological replicate. (B) IB detection (left) and autoradiography (right) of IL15 CLIP assay using human (H) or mice (M) serum. Blue box: RNA-protein complex extracted for the following sanger sequencing. (C) Summary of SNORD46 sequence responsible for IL15 binding. The chromatin sequences corresponding to RNA (negative-stranded) and RNA motif bound by IL15 are shown. (D) Competition binding assay to determine Kd of the interaction between His-tagged IL15 and biotinylated-SNORD46 wild-type or mutants. Unlabeled IL15 serve as the competitor. Error bars, SD, n = 3 independent experiments. miR-20a was included as a negative control. (E) Number of peptides recovered from LiP-MS of IL15 incubated with scramble or SNORD46 RNA. x-axis: amino acid position of full-length IL15. (F) Competition binding assay to determine Kd of the interaction between His-tagged IL15 wild-type or mutants and biotinylated-SNORD46. Unlabeled SNORD46 serve as competitor. Error bars, SD, n = 3 independent experiments. (G) Computational modeling of SNORD46–IL15 interaction. Magenta cartoon: SNORD46; Cyan cartoon: IL15; Magenta stick: G11; Cyan stick: D8 and N65. (H) G11A mutation of SNORD46 strengthens the interaction with IL15. Green cartoon: SNORD46; Cyan cartoon: IL15; Green stick: A11; Cyan stick: D8 and N65. (I and J) RIP assay using differentiated human adipocytes harboring IL15 sgRNAs (I), or SNORD46 sgRNAs (J) and Adipoq-driven expression of indicated mutants. Error bars, SD, n = 26 donors, one-way ANOVA.
Figure 4.
Figure 4.. SNORD46 G11A drives obesity
(A) Schematic of CRISPR-Cas9 method used to generate SNORD46G11A/G11A mice. (B and C) Body weight measurement of female (B) or male (C) Snord46WT/WT, Snord46WT/G11A or Snord46G11A/G11A mice. Error bars, SD, n = 7 mice, one-way ANOVA. (D-H) Representative images of lean and fat tissues (D), quantification of male (left) or female (right) body weight (E), lean weight (F), fat weight (G), and fat percentage (H) by the dual energy x-ray absorptiometry imaging system from Snord46WT/WT or Snord46G11A/G11A mice. Error bars, SD, n = 5 mice, Student’s t-test. (I) Representative H&E and Oil Red O staining of indicated tissues from Snord46WT/WT or Snord46G11A/G11A mice. Scale bars, 100 μm. (J) Statistical analysis of Oil Red O staining intensity of liver sections from Snord46WT/WT or Snord46G11A/G11A mice. Error bars, SD, n = 8 mice, Student’s t-test. (K and L) CLAMS measurement of oxygen consumption (VO2) in male (K) or female (L) Snord46WT/WT or Snord46G11A/G11A mice. Error bars, SD, n = 4, 4 mice, two-way ANOVA. (M) Glucose tolerance tests (GTTs) of male Snord46WT/WT or Snord46G11A/G11A mice at the indicated time points. Error bars, SD, n = 8, 5 mice, Student’s t-test for each time point.
Figure 5.
Figure 5.. IL15 triggers FER-medicated signaling cascades in adipocytes to regulates the enzymatic activities of CD36 and MGLL
(A) Identification of biotinylated IL15-associated proteins in Snord46WT/WT or Snord46G11A/G11A tissues as indicated. Protein scores are shown. (B) IL15 pull-down followed by IB detection of indicated proteins in mouse adipocytes with or without IL15 stimulation. (C) Ni-NTA pull-down using indicated recombinant proteins and biotinylated RNA oligonucleotides, followed by IB detection using indicated antibodies. (D) IB detection of indicated proteins in NK cells or differentiated human adipocytes (HAd) with or without IL15 stimulation. (E and F) IB detection of indicated proteins in WT, Il2rb-deficient or Snord46G11A/G11A adipocytes with or without IL15 stimulation. (G-I) Measurement of intracellular TG (G), intracellular NEFA (H), or extracellular NEFA (I) concentration of differentiated WT, Il2rb−/−or Snord46 G11A/G11A adipocytes with or without IL15 stimulation. Error bars, SD, n = 8 animals per experimental group, one-way ANOVA. (J) Oxygen consumption rate (OCR) across time for WT, Il2rb−/− and Snord46G11A/G11A mouse adipocytes with or without IL15 stimulation. Dot lines indicate the addition of mitochondrial inhibitors (oligomycin; FCCP; antimycin A/rotenone) (n = 8 wells of adipocytes, error bars: SD). (K and L) Measurement of intracellular TG (K) and intracellular NEFA (L) levels in MGLL-proficient or -deficient differentiated human adipocytes expressing indicated expression constructs with or without IL15 stimulation. Error bars, SD, n = 24 donors, two-way ANOVA.
Figure 6.
Figure 6.. SNORD46 power inhibitors antagonize obesity
(A) Heatmap of the protein identification score for biotinylated Scramble, SNORD46 or miR-20a pull-down in the presence of indicated power inhibitors. R: biological replicate. (B) Northernblot of SNORD46 in human serum treated with indicated power inhibitors or antibodies. (C) IB detection of proteins associated with biotinylated RNA (wild-type and indicated mutants) in human serum treated with indicated power inhibitors. (D) IB detection of indicated proteins in differentiated human adipocytes collected from donors with BMI < 25, 30-40, or > 40 and treated with IL15 and/or indicated power inhibitors. (E and F) Measurement of intracellular TG (E) or intracellular NEFA (F) levels in differentiated human adipocytes collected from donors with BMI < 25 (n = 24), 30-40 (n= 19), or > 40 (n = 17) and treated with indicated power inhibitors with or without IL15 stimulation. Error bars, SD, two-way ANOVA. (G) Left, representative images; right, body weight measurement of Snord46G11A/G11A mice treated with scramble (Scr), Snord46 power inhibitor (pi), Orlistat or Liraglutide as indicated. Error bars, SD, n = 5 mice per group, one-way ANOVA. (H) Representative H&E and Oil Red O staining of liver or WAT (left) and statistical analysis of staining intensities of liver sections (right) from Snord46G11A/G11A mice treated with scramble or Snord46 power inhibitor. Scale bars, 100 μm. Error bars, SD, n= 9, 8 mice, Student’s t-test.
Figure 7.
Figure 7.. SNORD46 power inhibitors restore the anti-tumor immunity of CAR-NK cells under obesity
(A) Volcano presentation of the transcription profiling of NK cells isolated from donors with obesity (n = 5) or healthy donors (n = 4). (B) Heatmap of the expression of Autophagy gene signature of NK cells isolated from donors with obesity (n = 5) or healthy donors (n = 4). (C) Immunofluorescent labeling using indicated antibodies in NK cells isolated from PBMC of healthy donors (BMI < 25) or donors with obesity (BMI > 35). Scale bars, 20 μm. Error bars, SD, n = 5, 5 donors, Student’s t-test. (D) Percentage of NK cells viability (left) and IC50 determination of NK cells viability (right) of BMI < 25, or BMI > 35 donors. Error bars, SD, n = 3 independent experiment, Student’s t-test. (E) Percentage of NK cells viability (left) and IC50 determination of NK cells viability (right) of Snord46 WT/WT or Snord46 G11A/G11A mice. Error bars, SD, n = 3 independent experiment, Student’s t-test. (F) Percentage of NK cells viability (left) and IC50 determination of NK cells viability (right) of BMI < 25, or BMI > 35 donors treated with scramble or SNORD46 power inhibitor. Error bars, SD, n = 3 independent experiment, one-way ANOVA. (G) Percentage of NK cells viability (left) and IC50 determination of NK cells viability (right) of Snord46 WT/WT or Snord46 G11A/G11A mice treated with scramble or Snord46 power inhibitor. Error bars, SD, n = 3 independent experiment, one-way ANOVA. (H) Top: schematic illustration of CAR-NK cells in HT-29 xenograft tumors. Bottom: tumor volume measurement of HT-29 tumor of chow (left) or HFD-fed animals (right) upon CAR-NK and indicated powder inhibitor treatment. Error bars, SD, n = 5 mice per group, one-way ANOVA. (I) Top: schematic illustration of CAR-NK cells in MDA-MB-231 xenograft tumors. Bottom: tumor volume measurement of MDA-MB-231 tumor of chow (left) or HFD-fed animals (right) upon CAR-NK and indicated power inhibitor treatment. Error bars, SD, n = 5 mice per group, one-way ANOVA. (J and K) Percentage of CD56+ NK cells isolated from HT-29 tumor (J) or MDA-MB-231 tumor (K) of chow or HFD-fed animals upon indicated treatment. Error bars, SD, n = 5 mice per group, one-way ANOVA.

References

    1. Hales CM, Carroll MD, Fryar CD, and Ogden CL (2017). Prevalence of Obesity Among Adults and Youth: United States, 2015-2016. NCHS Data Brief, 1–8. - PubMed
    1. Berrington de Gonzalez A, Hartge P, Cerhan JR, Flint AJ, Hannan L, MacInnis RJ, Moore SC, Tobias GS, Anton-Culver H, Freeman LB, et al. (2010). Body-mass index and mortality among 1.46 million white adults. N Engl J Med 363, 2211–2219. 10.1056/NEJMoa1000367. - DOI - PMC - PubMed
    1. Ringel AE, Drijvers JM, Baker GJ, Catozzi A, Garcia-Canaveras JC, Gassaway BM, Miller BC, Juneja VR, Nguyen TH, Joshi S, et al. (2020). Obesity Shapes Metabolism in the Tumor Microenvironment to Suppress Anti-Tumor Immunity. Cell 183, 1848–1866 e1826. 10.1016/j.cell.2020.11.009. - DOI - PMC - PubMed
    1. Ma A, Koka R, and Burkett P (2006). Diverse functions of IL-2, IL-15, and IL-7 in lymphoid homeostasis. Annu Rev Immunol 24, 657–679. 10.1146/annurev.immunol.24.021605.090727. - DOI - PubMed
    1. Barra NG, Reid S, MacKenzie R, Werstuck G, Trigatti BL, Richards C, Holloway AC, and Ashkar AA (2010). Interleukin-15 contributes to the regulation of murine adipose tissue and human adipocytes. Obesity (Silver Spring) 18, 1601–1607. 10.1038/oby.2009.445. - DOI - PubMed

Publication types