. 2023 Nov;193(11):1694-1705.
doi: 10.1016/j.ajpath.2023.05.017. Epub 2023 Jun 16.

Role of HIF1α and HIF2α in Cre Recombinase-Induced Retinal Pigment Epithelium Pathology and Its Secondary Effect on Choroidal Neovascularization

Affiliations

Role of HIF1α and HIF2α in Cre Recombinase-Induced Retinal Pigment Epithelium Pathology and Its Secondary Effect on Choroidal Neovascularization

Enrico Cristante et al. Am J Pathol. 2023 Nov.

Abstract

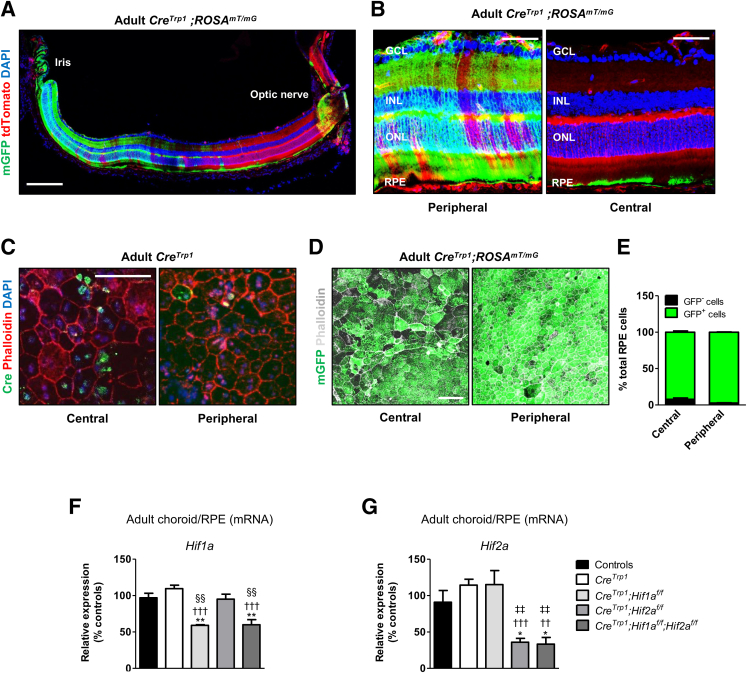
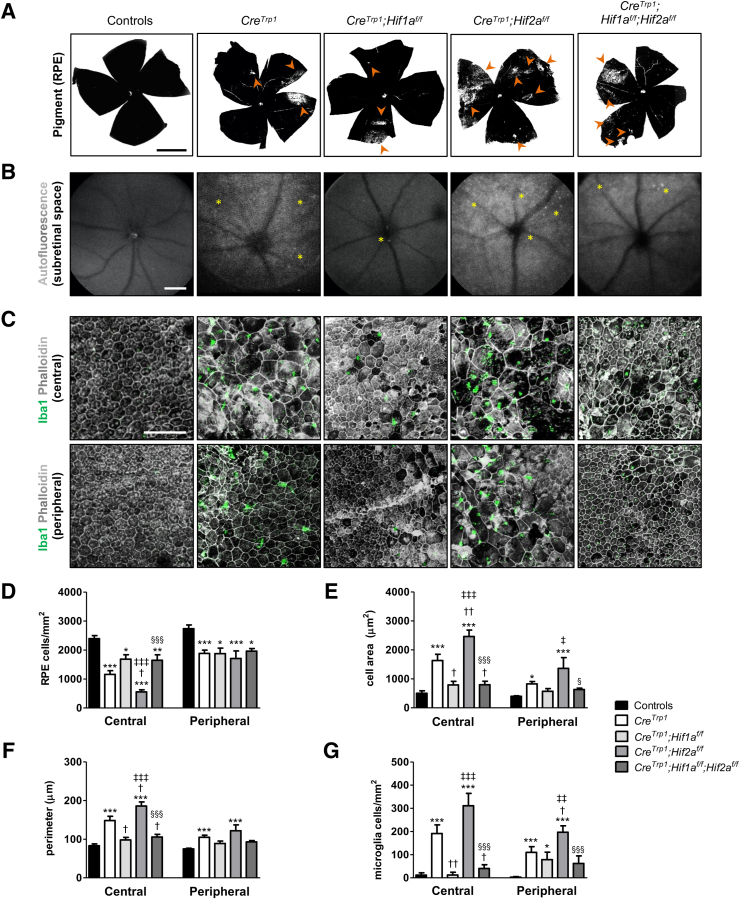
CreTrp1 mice are widely used for conditional retinal pigment epithelium (RPE) gene function studies. Like other Cre/LoxP models, phenotypes in CreTrp1 mice can be affected by Cre-mediated cellular toxicity, leading to RPE dysfunction, altered morphology and atrophy, activation of innate immunity, and consequent impairment of photoreceptor function. These effects are common among the age-related alterations of RPE that feature in early/intermediate forms of age-related macular degeneration. This article characterizes Cre-mediated pathology in the CreTrp1 line to elucidate the impact of RPE degeneration on both developmental and pathologic choroidal neovascularization. Nonredundant roles of the two major components of the hypoxia-inducible factor (HIF) family of transcription regulators, HIF1α and HIF2α, were identified. Genetic ablation of Hif1a protected against Cre-induced degeneration of RPE and choroid, whereas ablation of Hif2a exacerbated this degeneration. Furthermore, HIF1α deficiency protected CreTrp1 mice against laser-induced choroidal neovascularization, whereas HIF2α deficiency exacerbated the phenotype. Cre-mediated degeneration of the RPE in CreTrp1 mice offers an opportunity to investigate the impact of hypoxia signaling in the context of RPE degeneration. These findings indicate that HIF1α promotes Cre recombinase-mediated RPE degeneration and laser-induced choroidal neovascularization, whereas HIF2α is protective.


Figures

Figure 1
Figure 1
Characterization of Cre-mediated recombination and HIF expression in RPE cells of the CreTrp1;Hifxf/f lines. A: Representative eye section from an adult CreTrp1;ROSAmT/mG mouse, showing membrane-targeted Green fluorescent protein (mGFP) distribution in the different cellular layers. Cre-mediated excision in the neuroretina of CreTrp1 mice has been reported previously.B: Central and peripheral confocal magnified images show mGFP expression (and Cre-mediated DNA excision) to be confined to the RPE monolayer in the RPE/choroid/sclera ocular compartment. C: Representative confocal images of central and peripheral RPE/choroid flat mount from an adult CreTrp1 mouse indicate persistent Cre expression in adulthood. D: Representative images of central and peripheral portions of RPE/choroid flat mounts from adult CreTrp1;ROSAmT/mG. tdTomato fluorescence not shown. E: Quantification of central and peripheral RPE cells stained positive for mGFP (ie, derived from cells that underwent Cre-mediated recombination). F and G: RT-qPCR analysis of whole adult RPE/choroid samples from the reported genotypes; targets analyzed are Hif1a (F) and Hif2a (G). Data are expressed as means ± SEM. n = 4 to 5 animals per genotype (F and G); n = 5 to 6 animals per genotype (E). ∗P < 0.05, ∗∗P < 0.01 versus controls in the same experiment (analysis of variance and Tukey test for multiple comparisons); ††P < 0.01, †††P < 0.001 versus CreTrp1; ‡‡P < 0.01 versus CreTrp1;Hif1af/f; §§P < 0.01 versus CreTrp1;Hif2af/f (all, versus group in the same experiment). Scale bars: 200 μm (A); 50 μm (B and C); 100 μm (D). GCL, ganglion cell layer; INL, inner nuclear layer; ONL, outer nuclear layer.
Figure 2
Figure 2
Morphologic abnormalities of RPE monolayer in CreTrp1;Hifxf/f lines. A: Bright-field images of adult choroid/RPE flat mounts; examples of depigmented areas are highlighted by arrowheads. B: Representative live autofluorescence scanning laser ophthalmoscopy images in adult animals, focusing on the subretinal space/RPE region and highlighting qualitative differences in diffused hyper-reflective regions and hyper-reflective foci (asterisks) among the CreTrp1 lines. C: Immunohistochemistry staining of phalloidin and ionized calcium-binding adaptor molecule 1 (Iba1) (both central and peripheral regions) show a particularly severe morphologic phenotype in adult RPE cells and ameboid-shaped inflammatory cells migrated in the subretinal space in correspondence to damaged RPE regions in CreTrp1 and CreTrp1;Hif2af/f mice. D–G: Quantification of cell density (D), cell area (E), cell perimeter (F), and Iba1+ cell density (G) in both the peripheral and central RPE portions. Data are expressed as means ± SEM. n = 5 to 30 animals per genotype. ∗P < 0.05, ∗∗P < 0.01, and ∗∗∗P < 0.001 versus controls; P < 0.05, ††P < 0.01 versus CreTrp1; P < 0.05, ‡‡P < 0.01, and ‡‡‡P < 0.001 versus CreTrp1;Hif1af/f; §P < 0.05, §§§P < 0.001 versus CreTrp1;Hif2af/f (all, versus groups in the same RPE region, by analysis of variance and Tukey test for multiple comparisons). Scale bars: 1 mm (A and B); 100 μm (C).
Figure 3
Figure 3
Choroidal vascular phenotype in CreTrp1;Hifxf/f lines. A: Confocal images of isolectin B4–fluorescein isothiocyanate (iB4-FITC)-perfused adult choriocapillaris in the phenotypes under analysis. Representative examples in central and peripheral portions are reported. B and C: Quantification of vascularized area (B) and vessel thickness (C). D: Between-genotype comparisons of mean RPE cell area and choroidal vascularized area, showing negative linear correlation. Linear interpolation equations: central, y = –0.0101x + 86.001; peripheral, y = –0.0214x + 90.148. Dashed lines represent the calculated data interpolation lines. Coefficients of determination (R2) are shown (the closer to 1.0, the more reliable the fit of the model). E: RT-qPCR analysis of Vegfa expression in whole P0–P1 and adult RPE/choroid samples. Genotypes in E are applicable to B, C, and G. F:In vitro choroidal sprouting assay experiment and representative examples of choroidal endothelium growth at 3 and 6 days in vitro. P18-P21 eyes were dissected in 1 × 1-mm explants, embedded in Matrigel, and placed in culture for 6 days under deep hypoxic conditions. Sprouting was assessed microscopically on a daily basis from day 3. G: Quantification of sprouting area over time. For simplicity, data from days 0 to 2 (no detectable sprouting) are not shown. Data are expressed as means ± SEM. n = 3 to 5 explants per animal (G); n = 4 to 7 animals per genotype (G); n = 4 to 14 animals per genotype (E); n = 5 to 18 animals per genotype (D). ∗P < 0.05, ∗∗P < 0.01, ∗∗∗P < 0.001, and ∗∗∗∗P < 0.0001 versus controls; P < 0.05, †††P < 0.001 versus CreTrp1; P < 0.05, ‡‡P < 0.01, and ‡‡‡P < 0.001 versus CreTrp1;Hif1af/f; §P < 0.05, §§§P < 0.001 versus CreTrp1;Hif2af/f (C, versus groups in the same choroidal region, by analysis of variance and Tukey test for multiple comparisons; E, versus groups of the same age, by analysis of variance and Tukey test for multiple comparisons; G, versus groups cultured for the same number of days in vitro, by analysis of variance and Bonferroni test for multiple comparisons). Scale bars: 25 μm (A); 1 mm (F).
Figure 4
Figure 4
Differences in laser choroidal neovascularization (CNV) lesions in CreTrp1;Hifxf/f lines at days 7 and 14 after laser-induced injury. A: Representative images of laser vascular injuries visualized using fundus fluorescein angiography. B: Quantification of CNV lesion area. C: Representative confocal images of laser vascular injuries stained with isolectin B4 at day 14 after laser injury and three-dimensional (3D) reconstruction. D: Quantification of CNV lesion volumes at day 14 using Imaris software version 8. Data are expressed as means ± SEM. n = 14 to 45 laser burns per genotype. ∗P < 0.05, ∗∗P < 0.01, and ∗∗∗P < 0.001 versus controls; P < 0.05, †††P < 0.001 versus CreTrp1; P < 0.05, ‡‡‡P < 0.001 versus CreTrp1;Hif1af/f; §§§P < 0.001 versus CreTrp1;Hif2af/f (all, versus groups analyzed at the same number of days after laser injury, by analysis of variance and Tukey test for multiple comparisons). Scale bars: 2 mm (A); 100 μm (C). iB4-FITC isolectin B4–fluorescein isothiocyanate.

Similar articles

Cited by

References

    1. Strauss O. The retinal pigment epithelium in visual function. Physiol Rev. 2005;85:845–881. - PubMed
    1. Sparrow J.R., Dicks D., Hamel C.P. The retinal pigment epithelium in health and disease. Curr Mol Med. 2010;10:802–823. - PMC - PubMed
    1. Zhao S., Overbeek P. Regulation of choroid development by the retinal pigment epithelium. Mol Vis. 2001;7:277–282. - PubMed
    1. Marneros A.G., Fan J., Yokoyama Y., Gerber H.P., Ferrara N., Crouch R.K., Olsen B.R. Vascular endothelial growth factor expression in the retinal pigment epithelium is essential for choriocapillaris development and visual function. Am J Pathol. 2005;167:1451–1459. - PMC - PubMed
    1. Marmorstein A.D., Finnemann S.C., Bonilha V.L., Rodriguez-Boulan E. Morphogenesis of the retinal pigment epithelium: toward understanding retinal degenerative diseases. Ann N Y Acad Sci. 1998;857:1–12. - PubMed

LinkOut - more resources