. 2023 Sep;34(9):813-825.
doi: 10.1016/j.annonc.2023.06.001. Epub 2023 Jun 16.

Fragmentomic analysis of circulating tumor DNA-targeted cancer panels

Affiliations

Fragmentomic analysis of circulating tumor DNA-targeted cancer panels

K T Helzer et al. Ann Oncol. 2023 Sep.

Abstract

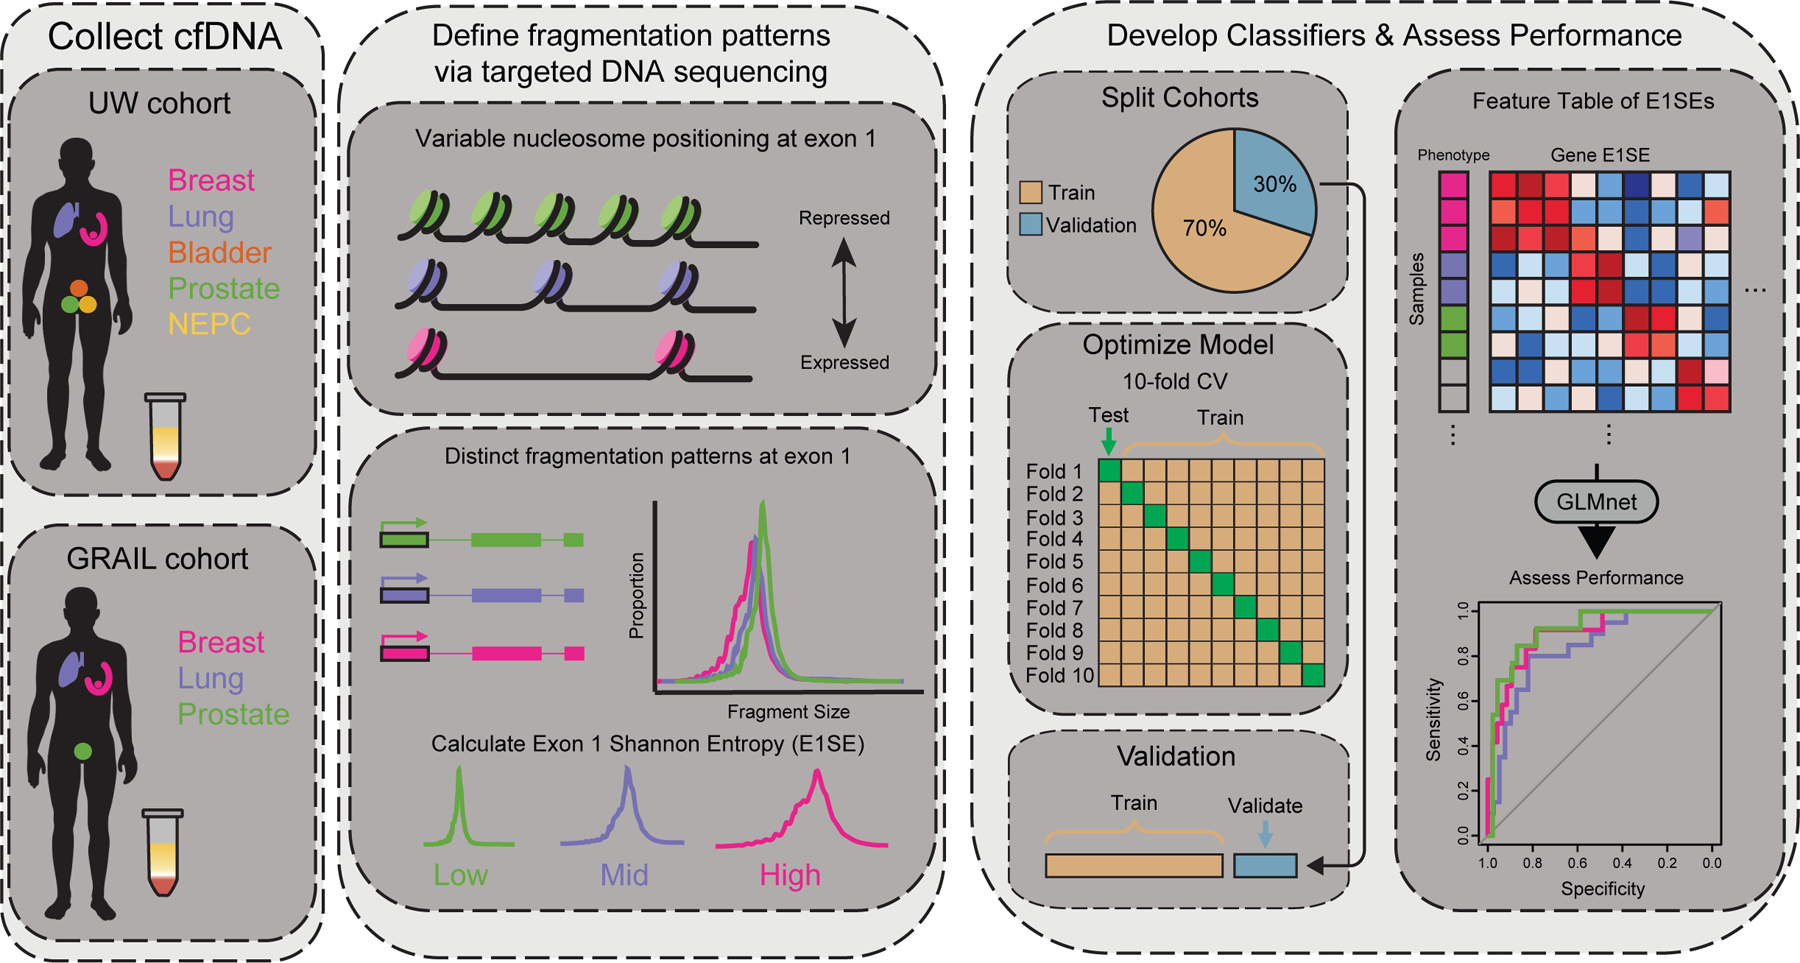
Background: The isolation of cell-free DNA (cfDNA) from the bloodstream can be used to detect and analyze somatic alterations in circulating tumor DNA (ctDNA), and multiple cfDNA-targeted sequencing panels are now commercially available for Food and Drug Administration (FDA)-approved biomarker indications to guide treatment. More recently, cfDNA fragmentation patterns have emerged as a tool to infer epigenomic and transcriptomic information. However, most of these analyses used whole-genome sequencing, which is insufficient to identify FDA-approved biomarker indications in a cost-effective manner.

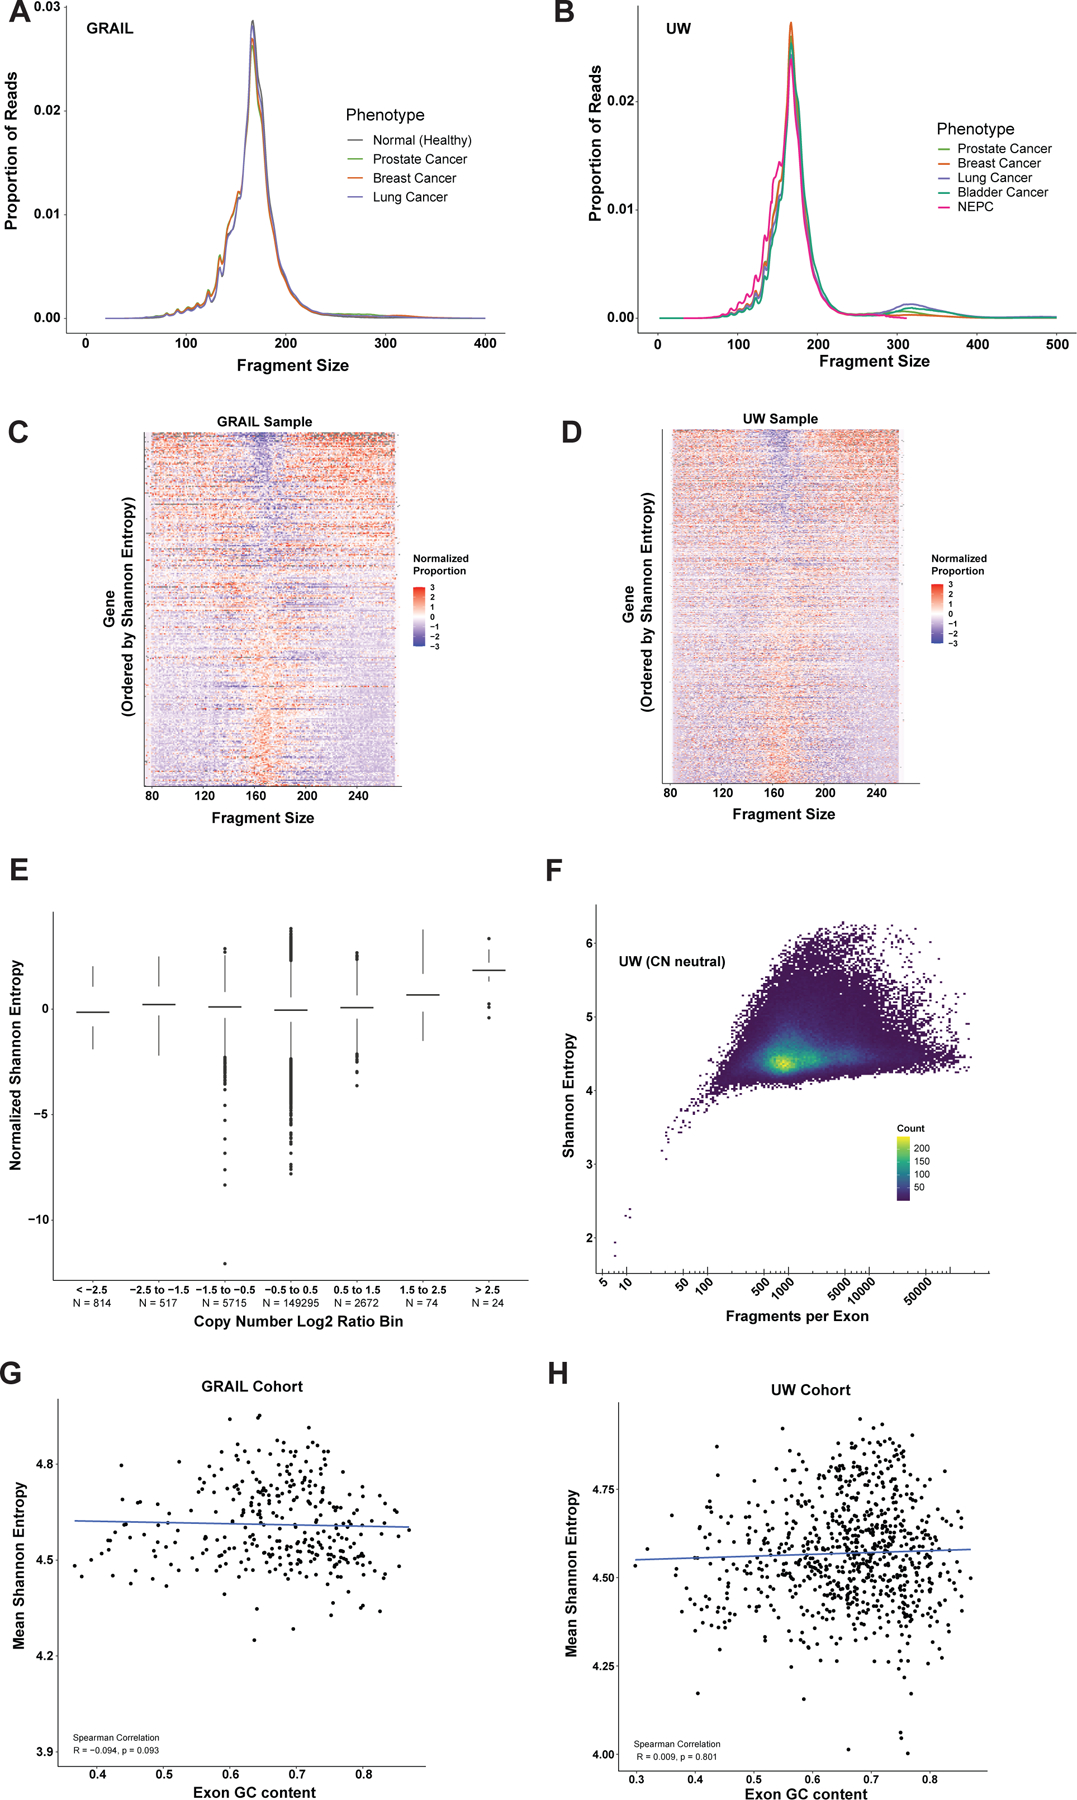
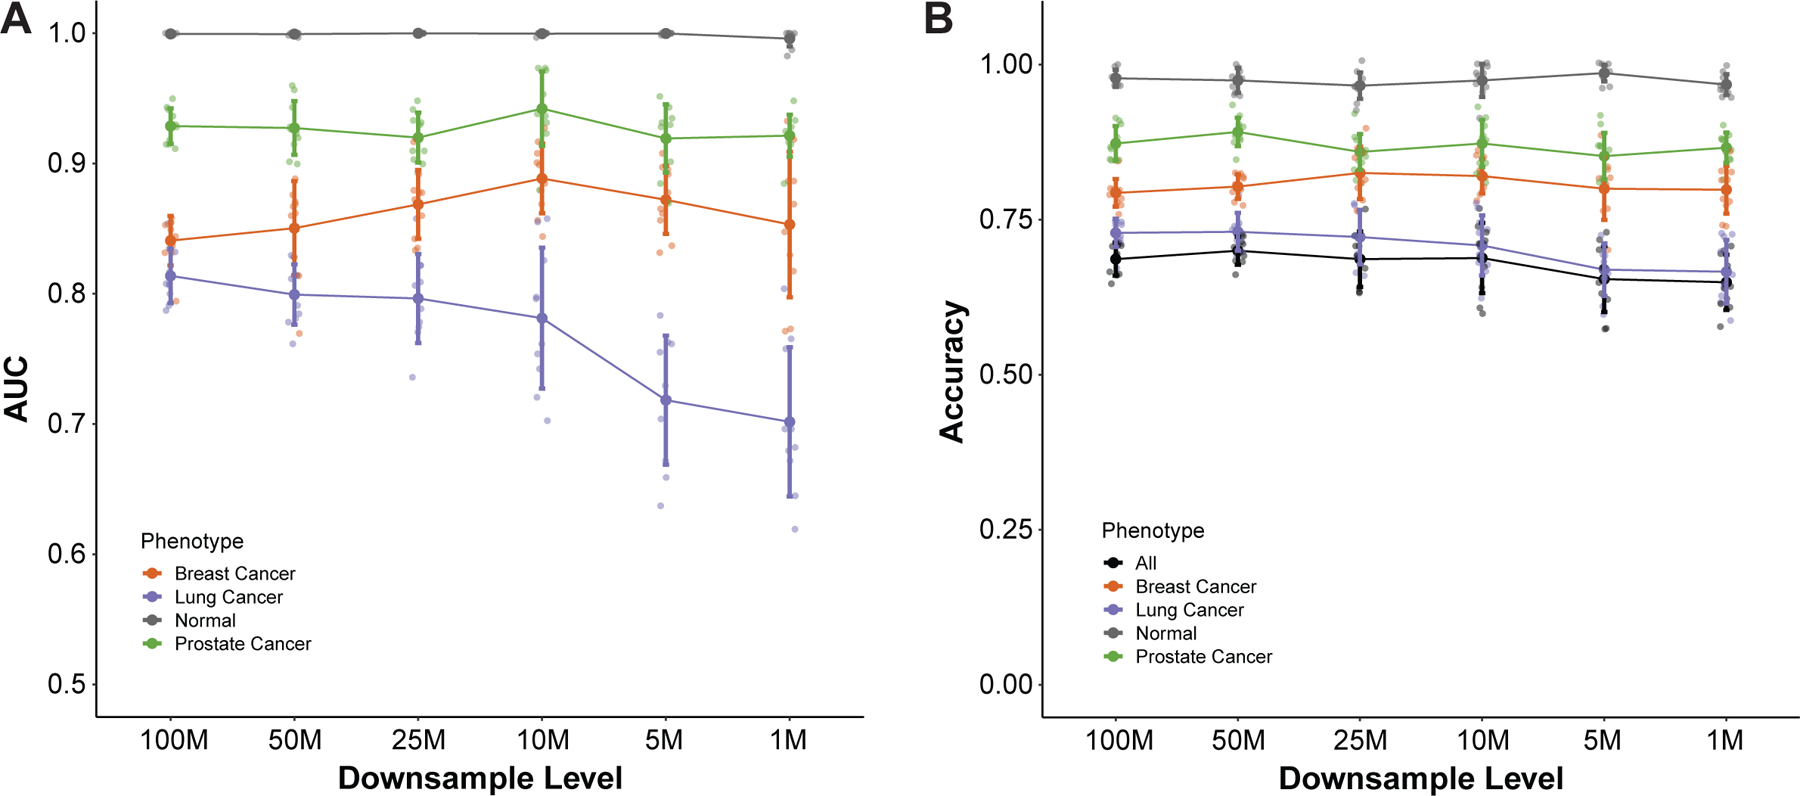
Patients and methods: We used machine learning models of fragmentation patterns at the first coding exon in standard targeted cancer gene cfDNA sequencing panels to distinguish between cancer and non-cancer patients, as well as the specific tumor type and subtype. We assessed this approach in two independent cohorts: a published cohort from GRAIL (breast, lung, and prostate cancers, non-cancer, n = 198) and an institutional cohort from the University of Wisconsin (UW; breast, lung, prostate, bladder cancers, n = 320). Each cohort was split 70%/30% into training and validation sets.

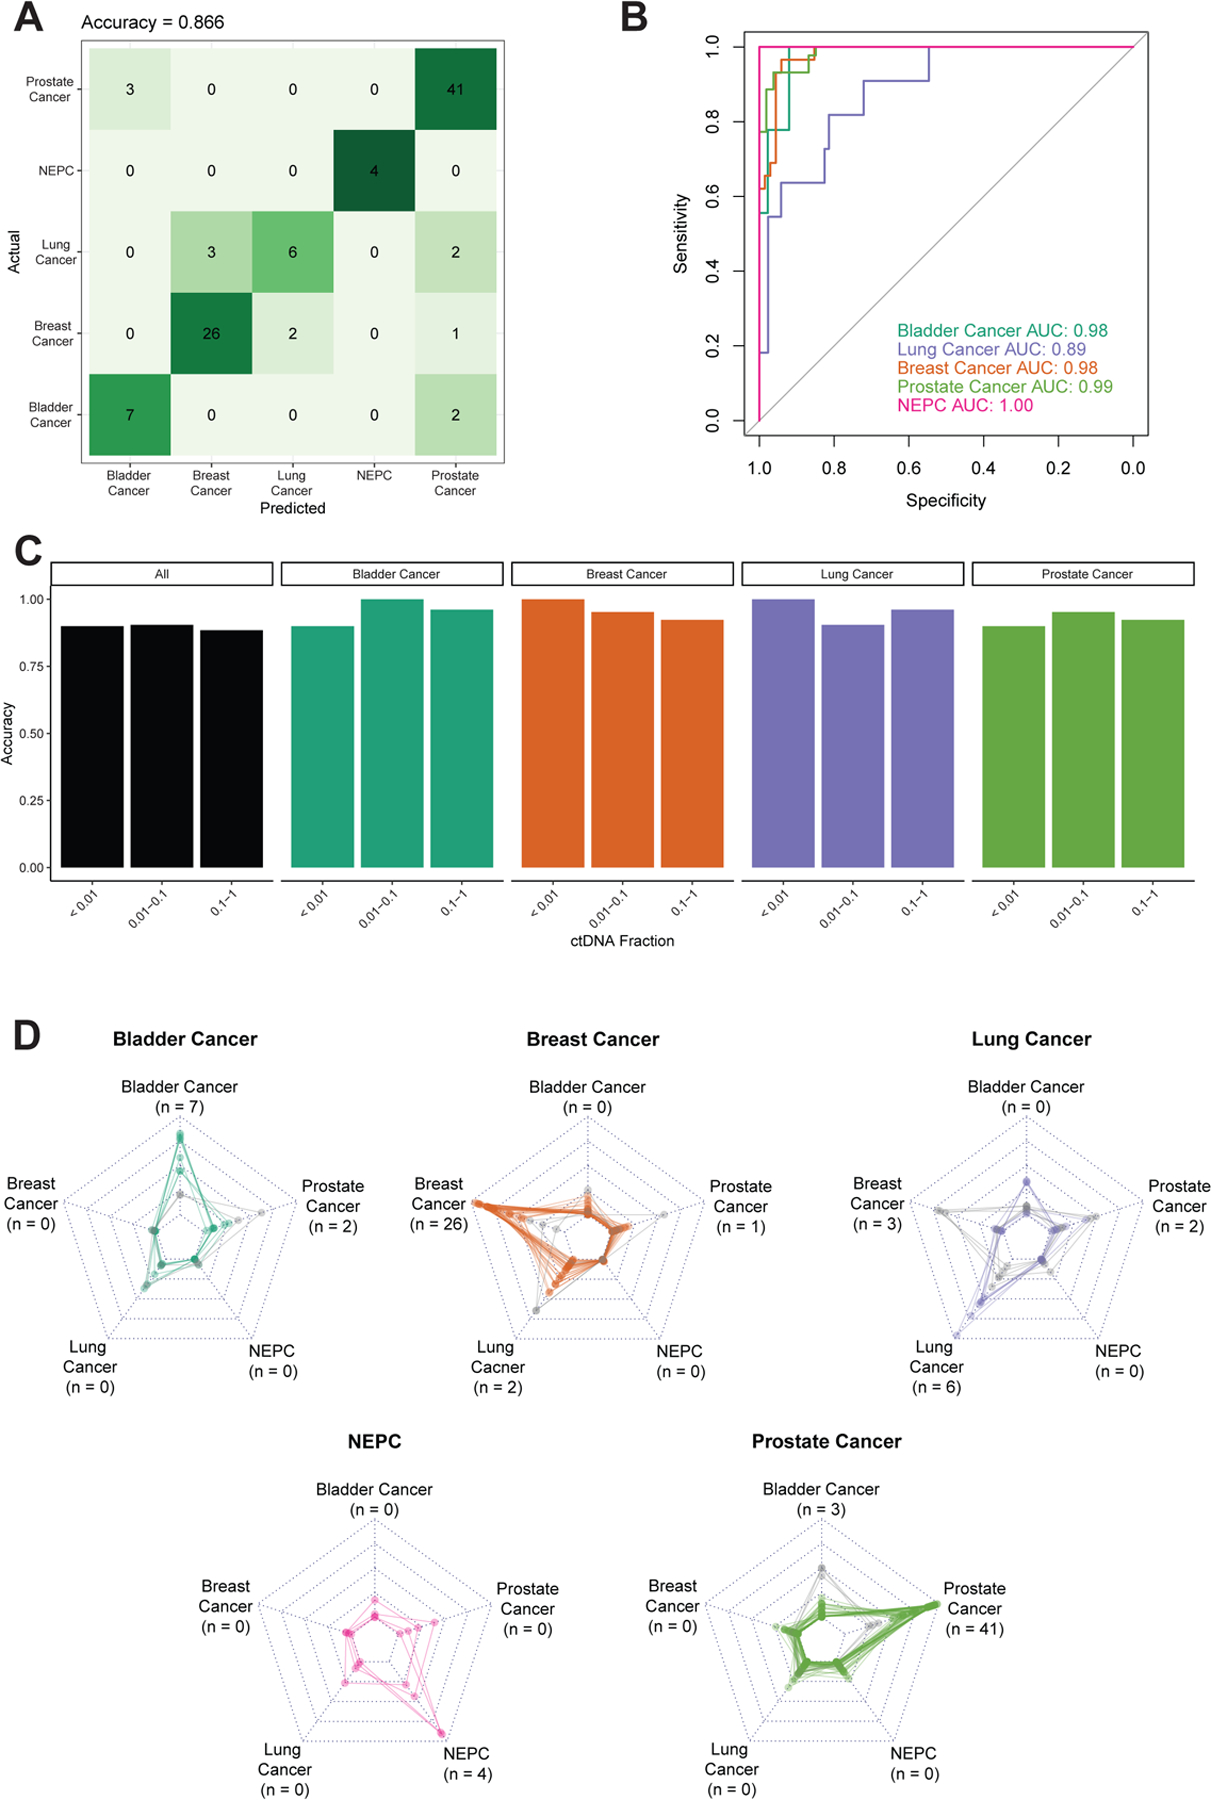
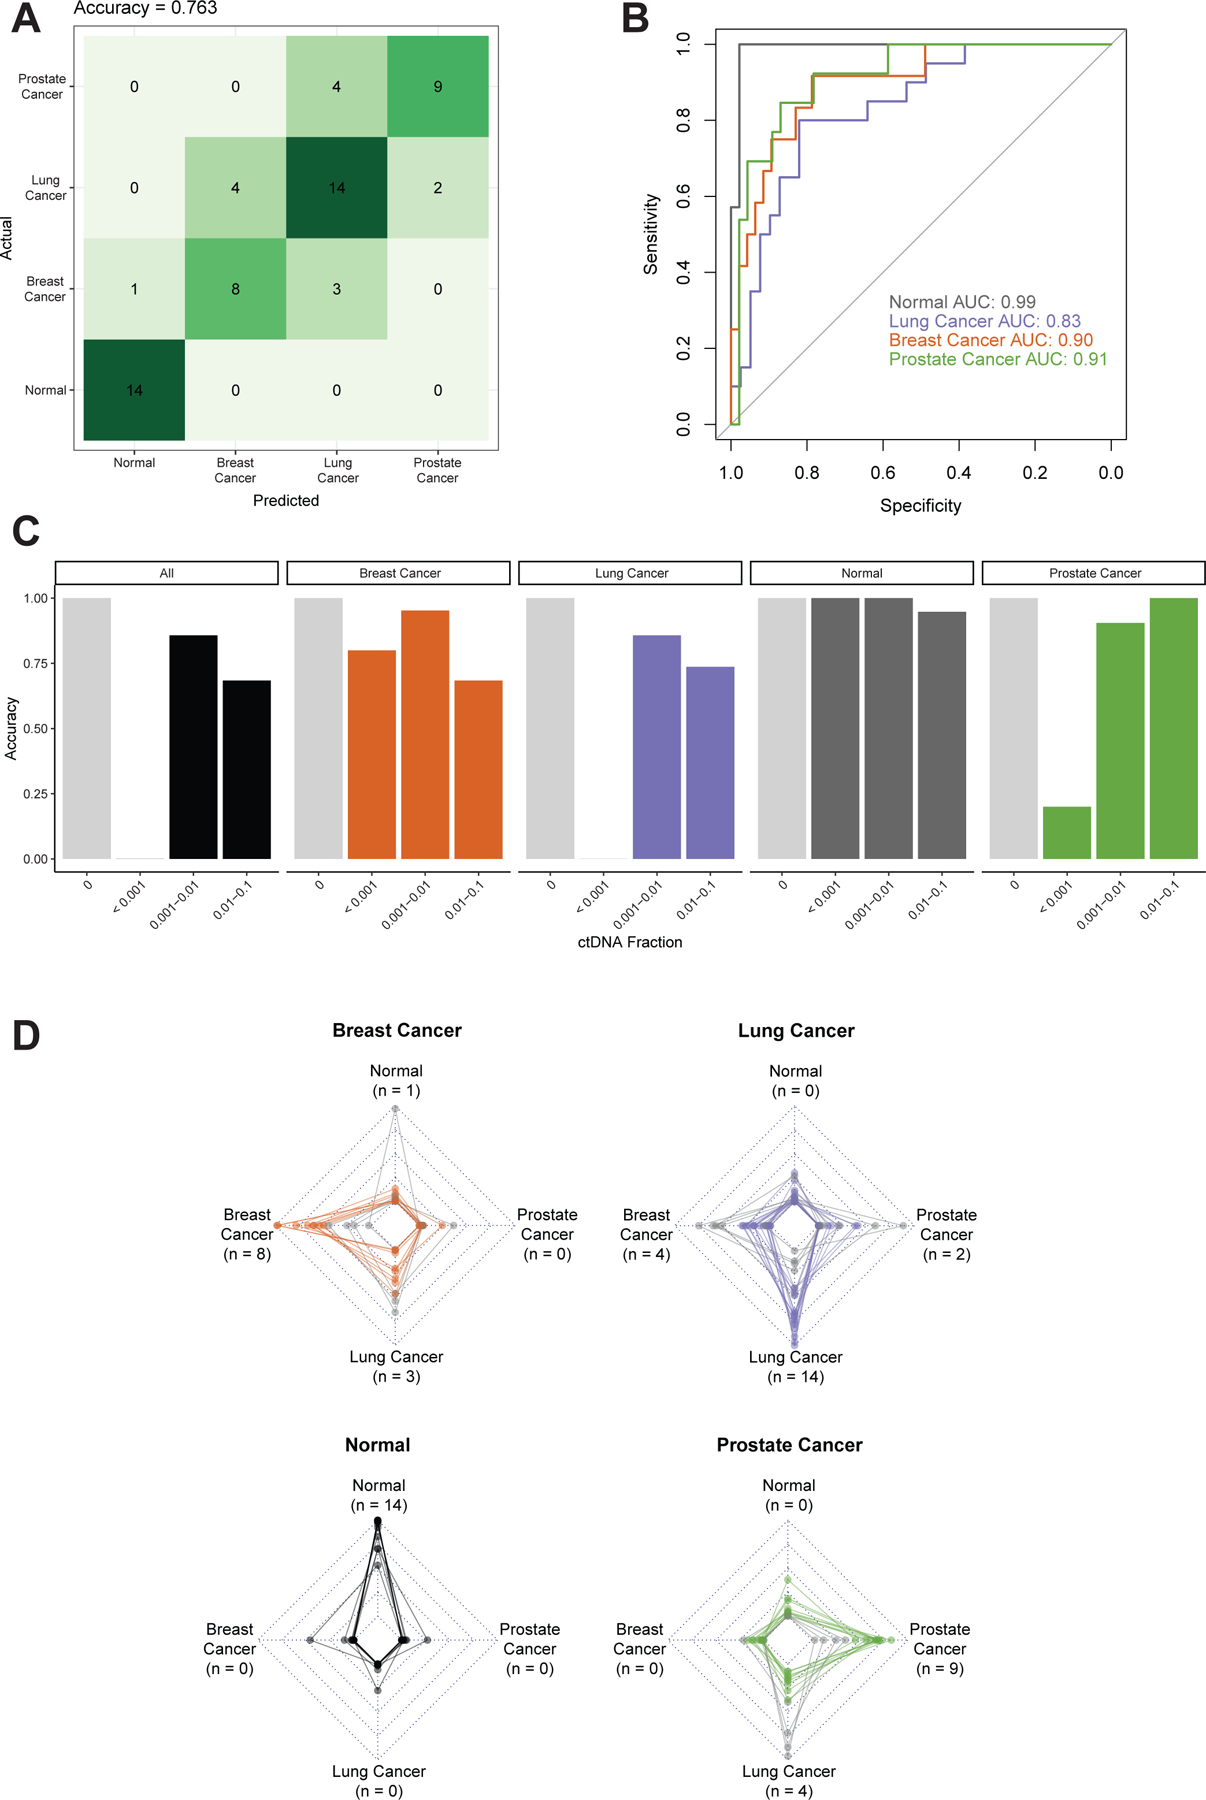
Results: In the UW cohort, training cross-validated accuracy was 82.1%, and accuracy in the independent validation cohort was 86.6% despite a median ctDNA fraction of only 0.06. In the GRAIL cohort, to assess how this approach performs in very low ctDNA fractions, training and independent validation were split based on ctDNA fraction. Training cross-validated accuracy was 80.6%, and accuracy in the independent validation cohort was 76.3%. In the validation cohort where the ctDNA fractions were all <0.05 and as low as 0.0003, the cancer versus non-cancer area under the curve was 0.99.

Conclusions: To our knowledge, this is the first study to demonstrate that sequencing from targeted cfDNA panels can be utilized to analyze fragmentation patterns to classify cancer types, dramatically expanding the potential capabilities of existing clinically used panels at minimal additional cost.

Keywords: cancer; cell-free DNA; fragmentomics.


Conflict of interest statement

Disclosure KTH has a family member who is an employee of Epic Systems. MLB has a family member who is an employee of Luminex. SGZ reports unrelated patents licensed to Veracyte, and that a family member is an employee of Artera and holds stock in Exact Sciences. KTH, SGZ, and the University of Wisconsin have filed a provisional patent on the work herein. SMD reports consulting relationships with BMS, Oncternal therapeutics, Janssen R&D/J&J and a grant from Pfizer/Astellas/Medivation (the grant was submitted to Medivation, ultimately funded by Astellas and then moved to Pfizer). FYF reports personal fees from Janssen Oncology, Bayer, PFS Genomics, Myovant Sciences, Roivant Sciences, Astellas Pharma, Foundation Medicine, Varian, Bristol Myers Squibb (BMS), Exact Sciences, BlueStar Genomics, Novartis, and Tempus; other support from Serimmune and Artera outside the submitted work. Integrated DNA Technologies (IDT, Coralville, IA) assisted in a pilot project to assess the performance characteristics of the UW panel before purchase, but played no role in this study. All other authors have declared no conflicts of interest. Data Sharing Raw sequencing data from the GRAIL dataset are available at the European Genome Archive (Dataset ID EGAD00001005302). Our institutional protocol does not allow unrestricted public access to the raw sequencing data. Therefore, data sharing requests must be submitted to the University of Wisconsin-Madison for approval. For samples from the two clinical trials (NCT03090165, NCT03725761), these trials are still ongoing, and data sharing requests must be submitted to the trial organizers.

Figures

Figure 1:
Figure 1:. Schematic of fragmentomics experimental setup.
Liquid biopsies from patients from two independent cohorts with various cancer types are collected and cfDNA is isolated using targeted exon panels. Unique histone distributions across cancer types lead to variable fragmentation patterns at targeted exons. Exon 1 shows particular variability due to its proximity to promoter regions and is correlated with gene expression. The diversity of fragmentation distributions at each coding exon 1 are measured via Shannon entropy for each sample. Machine learning models are built to predict tumor type for each cohort, with training performed on 70% of the data and 30% withheld for validation. Ten-fold cross validation performed on the training data. In the UW cohort, samples are randomly selected for training and validation, while the GRAIL cohort is trained on high ctDNA samples and validated on low ctDNA samples.
Figure 2:
Figure 2:. cfDNA fragmentation patterns from targeted panels
Average total fragment distribution across tumor types in the (A) GRAIL and (B) UW datasets respectively. Heatmap of the fragment size distributions at exon 1 across all genes from the GRAIL targeted panel (C) and UW targeted panel (D) in a single representative sample from each cohort. Genes are ordered by exon 1 Shannon entropy (E1SE) with high E1SE genes at the top and low E1SE genes at the bottom. Fragment size proportions are normalized within each fragment size across all genes analyzed. Plot demonstrates that genes with high E1SE are depleted for fragments near the mono-nucleosome peak (167bp) and enriched for fragments at lower (<120 bp) and higher (> 200 bp) sizes, while genes with low E1SE display the opposite pattern. (E) Copy number calls from the UW cohort compared to Shannon entropy. Copy number was calculated for each gene for each patient. Each point represents a single gene-patient pair. Copy number data was binned as shown, and Shannon entropy distributions are shown for each bin. E1SE was normalized by centering and scaling on a per-gene basis before plotting. This transforms the E1SE distribution for each gene such that the mean is zero and the standard deviation is one, eliminating inter-gene variability. Data from all genes and patients are plotted. Only the UW cohort was used because the exact panel design was required to accurately determine CN, but this was not available for the GRAIL cohort (F) Shannon entropy as a function of fragments per exon in the UW cohort at copy number neutral regions (Log2 ratio between -0.5 and 0.5). Correlation between GC content and mean Shannon entropy at each exon analyzed in the (G) GRAIL cohort and (H) UW cohort.
Figure 3:
Figure 3:. Predicting tumor type in the UW panel and cohort
The UW data was split into 70% training and 30% independent validation, the latter of which is shown. Performance was assessed by (A) confusion matrix of classifier accuracy in CV data comparing predicted vs. actual phenotypes and (B) ROC curves of classifier AUCs in CV data. (C) Accuracy as a function of ctDNA fraction in CV data. ctDNA fractions ranged from 0.003–0.771. NEPC samples are not shown due to the lack of germline sequencing for this cohort which are required for ctDNA fraction estimation. Only samples with available germline sequencing, and thus ctDNA fraction estimation, are shown. The number of samples in each ctDNA fraction bin are: <0.01: n = 10; 0.01–0.1: n = 21; 0.1–1.0: n = 26. (D) Radar plots depicting the prediction score, where each plot represents one pathologic diagnosis (noted in bold above the plot), and each line in the plot represents model prediction for a single patient. The vertices of each graph represent the continuous prediction scores from the E1SE models for each of the predicted phenotypes, with the outer ring denoting a prediction score of 1 and the inner ring a prediction score of 0. For each patient, the final model prediction is the highest-scoring predicted phenotype which is correct in the majority of cases. The number of predictions for each tumor type are noted next to the label of each vertex (matching panel A). Correctly predicted patients are represented by colored lines, whereas incorrectly predicted patients are represented by light gray lines.
Figure 4:
Figure 4:. Predicting tumor type in the GRAIL panel and cohort
The GRAIL data was split into 70% training and 30% independent validation, the latter of which is shown. The validation data contained the lowest ctDNA fraction samples, all <0.05. Performance was assessed by (A) confusion matrix of classifier accuracy in validation data and (B) ROC curves of classifier AUCs in validation data. (C) Accuracy as a function of ctDNA fraction in validation data. ctDNA fractions ranged from 0.0003–0.925 for cancer samples. Light grey bars represent normal samples with a ctDNA fraction of 0. The number of samples in each ctDNA fraction bin are: 0 (Normal): n = 33; <0.25: n = 28; 0.25–1.0: n = 32. (D) Radar plots depicting the prediction score, where each plot represents one specific pathologic diagnosis (noted in bold above the plot), and each line in the plot represents the model prediction for a single patient. The vertices of each graph represent the continuous prediction scores from the E1SE models for each of the predicted phenotypes, with the outer ring denoting a prediction score of 1 and the inner ring a prediction score of 0. For each patient, the final model prediction is the highest-scoring predicted phenotype which is correct in the majority of cases. The number of predictions for each tumor type are noted next to the label of each vertex (matching panel A). Correctly predicted patients are represented by colored lines, whereas incorrectly predicted patients are represented by light gray lines.
Figure 5:
Figure 5:. Effect of downsampling on model performance in the GRAIL cohort
Downsampling of the GRAIL cohort was performed to levels ranging from 100M to 1M reads 10 times for each downsampling level. For each replicate and downsampling level, Shannon entropies were calculated for the fragment distributions at the first exon of each gene in the panel as described previously. Training and validation using the new downsampled feature tables was performed and results for (A) ROC AUC and (B) accuracy are shown for each phenotype in the cohort. Small points represent individual values, large solid points represent mean values, and error bars represent +/- 1 standard deviation.

References

    1. Diaz LA Jr., Bardelli A. Liquid biopsies: genotyping circulating tumor DNA. J Clin Oncol 2014; 32 (6): 579–586. - PMC - PubMed
    1. Chen M, Zhao H. Next-generation sequencing in liquid biopsy: cancer screening and early detection. Hum Genomics 2019; 13 (1): 34. - PMC - PubMed
    1. Yao W, Mei C, Nan X et al. Evaluation and comparison of in vitro degradation kinetics of DNA in serum, urine and saliva: A qualitative study. Gene 2016; 590 (1): 142–148. - PubMed
    1. Watanabe T, Takada S, Mizuta R. Cell-free DNA in blood circulation is generated by DNase1L3 and caspase-activated DNase. Biochem Biophys Res Commun 2019; 516 (3): 790–795. - PubMed
    1. Fan HC, Blumenfeld YJ, Chitkara U et al. Noninvasive diagnosis of fetal aneuploidy by shotgun sequencing DNA from maternal blood. Proc Natl Acad Sci U S A 2008; 105 (42): 16266–16271. - PMC - PubMed

Publication types