. 2023 Jun 17;14(1):3603.
doi: 10.1038/s41467-023-39269-9.

A pharmacoproteomic landscape of organotypic intervention responses in Gram-negative sepsis

Affiliations

A pharmacoproteomic landscape of organotypic intervention responses in Gram-negative sepsis

Tirthankar Mohanty et al. Nat Commun. .

Abstract

Sepsis is the major cause of mortality across intensive care units globally, yet details of accompanying pathological molecular events remain unclear. This knowledge gap has resulted in ineffective biomarker development and suboptimal treatment regimens to prevent and manage organ dysfunction/damage. Here, we used pharmacoproteomics to score time-dependent treatment impact in a murine Escherichia coli sepsis model after administering beta-lactam antibiotic meropenem (Mem) and/or the immunomodulatory glucocorticoid methylprednisolone (Gcc). Three distinct proteome response patterns were identified, which depended on the underlying proteotype for each organ. Gcc enhanced some positive proteome responses of Mem, including superior reduction of the inflammatory response in kidneys and partial restoration of sepsis-induced metabolic dysfunction. Mem introduced sepsis-independent perturbations in the mitochondrial proteome that Gcc counteracted. We provide a strategy for the quantitative and organotypic assessment of treatment effects of candidate therapies in relationship to dosing, timing, and potential synergistic intervention combinations during sepsis.


Conflict of interest statement

The authors declare no competing interests.

Figures
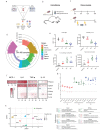
Fig. 1
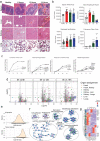
Fig. 1. Proteomic landscape of murine sepsis.
a Model of sepsis and interventions. C57BL/6J were infected with Escherichia coli O18:K1 strain. (Created with bioRender, bioRender.com). b Time course of infection and intervention. C57BL/6J were infected with 104 E. coli and (c) organs were harvested at 0-, 6-, 12- and 18 h.p.i. (n = 23 total; 6 for all time points, except time point 0 where n = 5) and analyzed with DIA-SWATH maps, organ histology and conventional markers like bacterial load in organs, cytokine profile, organ damage markers and circulating immune cell profile. For the intervention study, infected animals were treated with 30 mg/kg methylprednisolone and 10 mg/kg meropenem (n = 4/treatment). d Total split of the samples and detected proteins using DIA-SWATH MS. e Leukocyte pool during sepsis time course. Total white blood cell count (109/L), blood platelet count (109/L), percentage of circulating neutrophils (% of total WBC), and median fluorescence intensity (MFI) of activation marker CD11b on neutrophils as determined by flow cytometry. Data are presented as mean and error bars indicate SEM of mean. All groups were compared to 0 h by two-tailed Mann–Whitney, *** p < 0.0005, ** p < 0.005, * p < 0.05 and ns = non-significant. f Cytokine levels in plasma and organ homogenates depicted as log2 fold change. All groups were compared to 0 h by two-tailed Mann–Whitney, All groups were compared to 0 h by two-tailed Mann–Whitney, *** p < 0.0005, ** p < 0.005, * p < 0.05 and ns=non-significant. g Viable bacterial load in organs. Viability was assessed in spleen, kidney, lung, liver, heart, and spleen. Colony forming units (CFU) expressed as CFU/g of tissue (See Fig. S2 for all combined physiological data). Data are presented as mean and error bars indicate SEM of mean. All groups were compared to 6 h by two-tailed Mann–Whitney, *** p < 0.0005, ** p < 0.005, * p < 0.05 and ns = non-significant. h UMAP projection of organs over time. UMAP projection depicting organs segregation over disease progression. The table indicates the functional hallmark groups associated with each organ.
Fig. 2
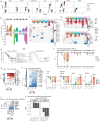
Fig. 2. Organ damage during sepsis.
a Histology of organ damage. Representative hematoxylin and eosin (H&E) staining of spleen, liver, kidney, and lung. The images depict focal necrosis in the white pulp of spleen (black arrowhead), appearance of clots in the liver (asterisk), tubular necrosis in the proximal tubules in kidney (black arrow), and appearance of clots in the alveoli in lungs (white arrow). b Semi-automatic quantification of H&E staining. Images were quantified with FIJI. Bars represent mean, dots represent individual values from 3 animals per time point (n = 3) and error bars represent SEM of the mean. All conditions were compared with healthy (0 h) using Kruskal–Wallis with *** p < 0.0005, ** p < 0.005, * p < 0.05 and ns = non-significant (see Fig. S2 for a combined panel of all physiological data). Scale bar = 100 µm. c Average increase of inflammatory components like formation of fibrin clot, neutrophil degranulation, response to interferon-beta, and platelet degranulation across organs and plasma. d Appearance of tissue leakage proteins in plasma. Volcano plots depict the contributions of various organs to the tissue leakage protein pool. Cut-off for log2 fold change = +/1.5, −logp = ±4. Colors indicate predicted organ assignments. The proteins were assigned to an organ if they were at least >20-fold more abundant in one organ with a corrected p value > 0.05. e Density plot of log organ protein intensities of all proteins and for the tissue-specific proteins identified in plasma. f Functional enrichment of leaked proteins. g Heatmap showing normalized intensity of the tissue leakage proteins in the organs under uninfected state and after 18 h.p.i. The colors in the first column indicate the functional groups shown in (f).
Fig. 3
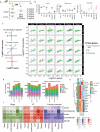
Fig. 3. Temporal profile of organotypic proteome responses in E. coli sepsis.
a UMAP projections of segregated organs over time. b The number of differentially abundant proteins (DAP) across organs and the blood compartment over time. c Heatmap showing average normalized intensity of protein clusters that were significantly more abundant on one organ. d Upper heatmap in the panel shows protein cluster with significantly increased protein abundances in plasma in at least one organ. The lower heatmap in the panel shows protein clusters with significant increased protein abundances in at least one organ but not in plasma. e Organotypic responses in liver depicting significantly lower levels of proteins associated with functional groups involved in fatty acid and steroid metabolism. f Time-dependent changes in abundance level of the glucocorticoid receptor (Nr3c1) in liver, lungs, and spleen. Differential abundance against the non-infected controls was calculated using limma (1.11.1) and Benjamini-Hochberg adjusted p values are indicated above as *** p < 0.0005, ** p < 0.005, * p < 0.05 and ns = non-significant. g Heatmap showing the increased levels of type-1 interferon (IFN-1) response proteins over time in liver. h Heatmap showing reduced levels of fatty acid metabolism proteins over time in liver. ik Time-dependent changes in abundance level regulating apolipoproteins in plasma and liver (i) (differential abundance against the non-infected controls was calculated using limma (1.11.1) and Benjamini-Hochberg adjusted p values are indicated above), insulin-like growth factor (IGF-1) signaling in plasma over time (j), and the mitochondrial oxidative phosphorylation (OXPHOS) components in heart and liver over time (k).
Fig. 4
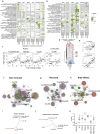
Fig. 4. Scoring intervention effects in organs and the blood compartment.
a Scheme of infection of C57BL/6J and treatment intervention administration. b Physiological markers. Bacterial load in heart (CFU/g of tissue), weight loss (% weight loss prior to infection) and total white blood cell count expressed as 109/L. All animals were harvested at 18 h.p.i. (n = 6 per group). Data are presented as mean and error bars indicate SEM of mean. All groups were compared to 6 h by two-tailed Mann–Whitney, *** p < 0.0005, ** p < 0.005, * p < 0.05 and ns = non-significant. c Scheme and scatter plots depicting the three categories of proteome regulation by treatments: reverted, non-reverted, and side effects across organs and the blood compartment. The colors indicate three protein categories referred to as the reverted (blue), non-reverted (green) and sepsis-independent effects (SIE)(red). d Stacked bar plots showing the number of regulated proteins for interventions in different organs in the reverted, non-reverted and SIE categories. e Heatmap of hallmark proteins showcasing the effect of combined glucocorticoids and meropenem administered at 8 h.p.i. (GccMem8h) comparing infected and healthy animals. The first column in the heatmap shows the scoring categories by color. f Heatmaps showing the slope, R2, and fraction of reverted proteins (of total) for the different interventions across different organs.
Fig. 5
Fig. 5. Organotypic intervention response networks in sepsis.
The members of the three protein categories shown in Fig. 4 were subjected to functional enrichment using Metascape. A 1-slope value was calculated for each protein category, where protein categories close to 0 are colored indicating the intervention effect per treatment group shown as a heatmap for functional groups associated with increased protein abundance (a) and functional groups with decreased protein abundance (b). c Example scatter plots of fold-change sepsis vs. fold-change intervention used to calculate the values in (a,b) for protein members in the functional group ‘regulation of cytokine production. Solid line shows the linear regression line, and the dotted line shows a slope of 1, which indicates the theoretical complete reversion all the protein members back to uninfected state. d Heatmap showing the normalized protein intensities after intervention for the proteins associated with ‘regulation of cytokine production in leukocytes. e Scatter plot of fold-change sepsis vs. fold-change intervention for the protein members in the liver for the functional category ‘lipid transport’ in animals treated with Gcc2hMem8h or Gcc8hMem8h. The solid line indicates the linear regression line, and the dotted line shows a slope of 1 for comparative reasons. fh The member of the three protein categories related to their respective intervention using the p value as edge (cut-off was corrected p value of >0.05) and visualized using cytoscape for non-reverted (f), and box with dashed lines represents shared proteins for all interventions, (g) reverted (dashed box contains the reverted proteins with Gcc2hMem8h), and (h) sepsis-independent effect (SIE) by interventions across different tissues. i Total tissue-leakage proteins into plasma by different interventions. Colors indicate organ associations. j Treatment trees for known inflammatory proteins and the 275 tissue-leakage proteins in plasma for different interventions. k Plasma levels of alanine aminotransferase for different interventions expressed as mU/ml. Bars represent mean and error bars represent SEM of the mean. All groups were compared to control by two-tailed Mann–Whitney, *** p < 0.0005, ** p < 0.005, * p < 0.05 and ns = non-significant.
Fig. 6
Fig. 6. Sepsis-independent effect proteins, enrichment and dysfunction of cardiac mitochondria.
a The number of sepsis-independent effect (SIE) proteins from Fig. 4 per organ and blood compartment separated into reduced or increased abundance levels. b Functionally enriched protein categories of the SIE proteins in the heart. Color gradient indicates −log10(P). c MitoCarta enriched terms of SIE proteins in organs and the blood compartment. d Heatmap showing normalized proteins intensities for the proteins part of oxidative phosphorylation (OXPHOS) proteins in different organs. The color column indicates OxPhos complex I–V. e Fold change of the average MS intensities for the OXPHOS complexes in organs. f Box plots of the average MS intensities for the protein members in the mitochondrial terms associated with ‘cristae formation’, ‘membrane transport’, ‘calcium ion homeostasis’, and ‘mitophagy’. Colors indicate the type of intervention. Box boundaries represent first and third quartiles, center line indicates median values. The upper whisker extends from the hinge to the largest value no further than 1.5 * IQR from the hinge (where IQR is the inter-quartile range, or distance between the first and third quartiles). The lower whisker extends from the hinge to the smallest value, at most 1.5 * IQR of the hinge. Data beyond the end of the whiskers are called “outlying” points and are plotted individually.

Similar articles

Cited by

References

    1. Reinhart K, et al. Recognizing Sepsis as a Global Health Priority - A WHO Resolution. N. Engl. J. Med. 2017;377:414–417. doi: 10.1056/NEJMp1707170. - DOI - PubMed
    1. Sakr Y, et al. Sepsis in Intensive Care Unit Patients: Worldwide Data From the Intensive Care over Nations Audit. Open Forum. Infect. Dis. 2018;5:ofy313. doi: 10.1093/ofid/ofy313. - DOI - PMC - PubMed
    1. Rudd KE, et al. Global, regional, and national sepsis incidence and mortality, 1990-2017: analysis for the Global Burden of Disease Study. Lancet. 2020;395:200–211. doi: 10.1016/S0140-6736(19)32989-7. - DOI - PMC - PubMed
    1. Singer, M. et al. The Third International Consensus Definitions for Sepsis and Septic Shock (Sepsis-3. JAMA 315, 801–810 (2016). - PMC - PubMed
    1. Cavaillon JM, Singer M, Skirecki T. Sepsis therapies: learning from 30 years of failure of translational research to propose new leads. EMBO Mol. Med. 2020;12:e10128. doi: 10.15252/emmm.201810128. - DOI - PMC - PubMed

Publication types