. 2023 Jun 17;13(1):9823.
doi: 10.1038/s41598-023-35692-6.

Increased red blood cell deformation in children and adolescents after SARS-CoV-2 infection

Affiliations

Increased red blood cell deformation in children and adolescents after SARS-CoV-2 infection

Julian Eder et al. Sci Rep. .

Abstract

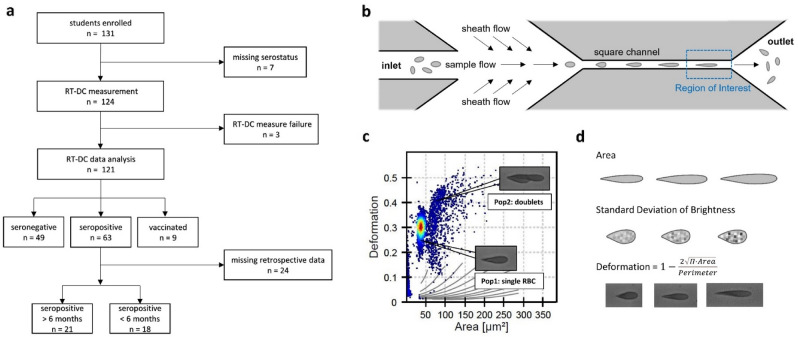
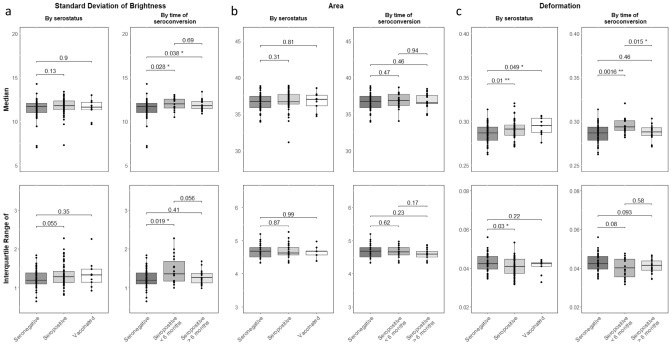
Severe coronavirus disease 2019 (COVID-19) is associated with hyperinflammation, hypercoagulability and hypoxia. Red blood cells (RBCs) play a key role in microcirculation and hypoxemia and are therefore of special interest in COVID-19 pathophysiology. While this novel disease has claimed the lives of many older patients, it often goes unnoticed or with mild symptoms in children. This study aimed to investigate morphological and mechanical characteristics of RBCs after SARS-CoV-2 infection in children and adolescents by real-time deformability-cytometry (RT-DC), to investigate the relationship between alterations of RBCs and clinical course of COVID-19. Full blood of 121 students from secondary schools in Saxony, Germany, was analyzed. SARS-CoV-2-serostatus was acquired at the same time. Median RBC deformation was significantly increased in SARS-CoV-2-seropositive compared to seronegative children and adolescents, but no difference could be detected when the infection dated back more than 6 months. Median RBC area was the same in seropositive and seronegative adolescents. Our findings of increased median RBC deformation in SARS-CoV-2 seropositive children and adolescents until 6 months post COVID-19 could potentially serve as a progression parameter in the clinical course of the disease with an increased RBC deformation pointing towards a mild course of COVID-19.


Conflict of interest statement

The authors declare no competing interests.

Figures

Figure 1
Figure 1
Depiction of the sample flow, real time deformability cytometry measurement and cell classification. Study design and paradigm. (a) Upon informed consent 131 students between 11 and 18 years old have been enrolled into the ImmunCOVID19-study. Due to missing information of the serostatus, seven students were excluded. RT-DC of peripheral blood was performed in 124 participants of which three had to be excluded due to measure failure. Results of 121 students were analyzed of which 49 were seronegative and 63 seropositive for SARS-CoV-2-IgG and 9 students had complete status of vaccination. In a subanalysis, seropositive participants were classified according to time of infection. Participants with a positive serostatus (from previous SchoolCoviDD19 study visits) or positive PCR test more than 6 months ago were categorized as “seropositive > 6 months “ (n = 21). Participants with negative serostatus in the SchoolCoviDD19 study visits more than 6 months ago or with positive PCR test within the past 6 months were classified “seropositive < 6 months “ (n = 18). Due to incomplete retrospective data, 24 subjects had to be excluded from the subgroup analysis (b) The illustration shows the operating principle of the RT-DC measurement. Diluted peripheral blood was introduced to the microfluid chip over an inlet. An additional lateral sheath flow created a constant flow of blood cells through the square channel which induced cell deformation through capillary shear stress. Images of the cells were taken with a highspeed microscope at 3000 fps in the last third of the channel (Region of Interest) before the suspension was discharged over an outlet. (c) All cells of one RT-DC measurement are plotted according to their deformation and cell size. Population 1 represents intact, single red blood cells (RBCs). Population 2 represents groups of two or more erythrocytes attached to each other. All other populations represent damaged erythrocytes and other cell types such as thrombocytes. Only population 1 was used for further analysis. (d) Erythrocytes were analyzed according to area of the cell, standard deviation of brightness and deformation as shown exemplarily for the three parameters. Information on area and standard deviation of brightness were extracted from the cell images in ShapeOut. Deformation was calculated as a ratio of area and perimeter.
Figure 2
Figure 2
Mean comparison tests of RBC parameters between groups by serostatus and by time of seroconversion. Morphological and mechanical characteristics of RBCs in SARS-CoV-2 seronegative, seropositive and vaccinated participants. (A) Brightness of RBCs did not differ between seronegative, seropositive or vaccinated subjects, while in the subanalysis seropositive participants of both subgroups showed brighter RBCs than seronegative participants. SARS-CoV-2 seropositive participants with a seroconversion within the past 6 months had a higher IQR of brightness of the RBCs compared to seronegative subjects. (B) RBCs did not differ in size between the analyzed groups. Area was the same for seropositive, seronegative and vaccinated participants, as well as between the subgroups. (C) Median deformation of RBCs was higher in seropositive and vaccinated participants compared to seronegative participants. When the time of seroconversion was within the past 6 months, median deformation was significantly higher than in seronegative participants whereas RBC deformation was the same than in seronegative participants when seroconversion was more than 6 months ago. RBC deformation was significantly different between participants with seroconversion within the last 6 months and participants with a seroconversion more than 6 months ago. (Welch’s t-test; two-tailed. *p < .05; **p < .01).

References

    1. Tay MZ, Poh CM, Renia L, MacAry PA, Ng LFP. The trinity of COVID-19: immunity, inflammation and intervention. Nat. Rev. Immunol. 2020;20:363–374. doi: 10.1038/s41577-020-0311-8. - DOI - PMC - PubMed
    1. Jose RJ, Manuel A. COVID-19 cytokine storm: The interplay between inflammation and coagulation. Lancet Respir. Med. 2020;8:e46–e47. doi: 10.1016/S2213-2600(20)30216-2. - DOI - PMC - PubMed
    1. Ostergaard L. SARS CoV-2 related microvascular damage and symptoms during and after COVID-19: Consequences of capillary transit-time changes, tissue hypoxia and inflammation. Physiol. Rep. 2021;9:e14726. doi: 10.14814/phy2.14726. - DOI - PMC - PubMed
    1. Liao SC, Shao SC, Chen YT, Chen YC, Hung MJ. Incidence and mortality of pulmonary embolism in COVID-19: A systematic review and meta-analysis. Crit. Care. 2020;24:464. doi: 10.1186/s13054-020-03175-z. - DOI - PMC - PubMed
    1. Favaron E, et al. Capillary leukocytes, microaggregates, and the response to hypoxemia in the microcirculation of coronavirus disease 2019 patients. Crit. Care Med. 2021;49:661–670. doi: 10.1097/CCM.0000000000004862. - DOI - PMC - PubMed

Publication types