. 2023 Jun 17;14(1):3616.
doi: 10.1038/s41467-023-39392-7.

The NAD salvage pathway in mesenchymal cells is indispensable for skeletal development in mice

Affiliations

The NAD salvage pathway in mesenchymal cells is indispensable for skeletal development in mice

Aaron Warren et al. Nat Commun. .

Abstract

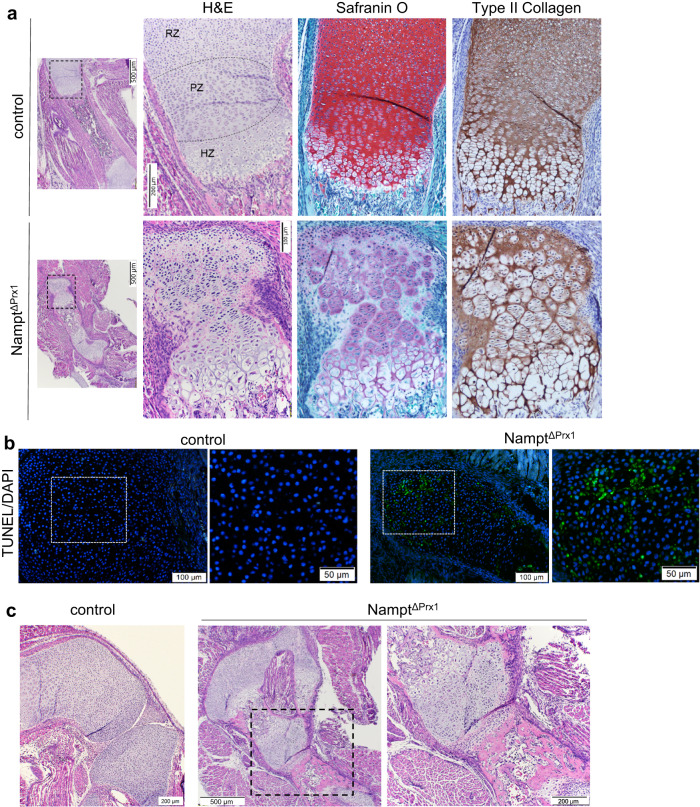
NAD is an essential co-factor for cellular energy metabolism and multiple other processes. Systemic NAD+ deficiency has been implicated in skeletal deformities during development in both humans and mice. NAD levels are maintained by multiple synthetic pathways but which ones are important in bone forming cells is unknown. Here, we generate mice with deletion of Nicotinamide Phosphoribosyltransferase (Nampt), a critical enzyme in the NAD salvage pathway, in all mesenchymal lineage cells of the limbs. At birth, NamptΔPrx1 exhibit dramatic limb shortening due to death of growth plate chondrocytes. Administration of the NAD precursor nicotinamide riboside during pregnancy prevents the majority of in utero defects. Depletion of NAD post-birth also promotes chondrocyte death, preventing further endochondral ossification and joint development. In contrast, osteoblast formation still occurs in knockout mice, in line with distinctly different microenvironments and reliance on redox reactions between chondrocytes and osteoblasts. These findings define a critical role for cell-autonomous NAD homeostasis during endochondral bone formation.


Conflict of interest statement

The authors declare no competing interests.

Figures

Fig. 1
Fig. 1. Nampt deletion in mesenchymal lineage cells severely compromises skeletal development.
a P2 Namptf/+ (control) and Namptf/f;Prx1-Cre (NamptΔPrx1) mice. b Whole-mount alcian blue-alizarin red S staining of newborn skeletons, and (c) hindlimbs. d Serial paraffin sections from hindlimb growth plates showing H&E or Nampt immunostaining (inset = isotype control). Arrows indicate immunopositive cells within adjacent muscle (n = 3 mice/group). e Alcian blue-alizarin red S staining of ribcage, and (f) head. Four independent litters of mice were obtained and showed similar effects.
Fig. 2
Fig. 2. Nampt deletion promotes growth plate chondrocyte apoptosis and disrupts joint formation.
a H&E, Safranin O/Fast Green, or type II collagen immunostaining of histological sections of P2 Namptf/+ (control) and Namptf/f;Prx1-Cre (NamptΔPrx1) femurs (n = 3 mice/group). The dotted black boxes are enlarged and shown to the right. RZ resting zone, PZ proliferative zone, HZ hypertrophic zone (n = 3 mice/group). b Cell death by TUNEL assay in growth plate of femurs. TUNEL positive signal appears in green. c Histological sections as in panel a illustrating the fused joints in the hindlimb of NamptΔPrx1 mice. Four independent litters of mice were obtained and showed similar effects.
Fig. 3
Fig. 3. NR administration during pregnancy rescued most of the skeletal defects caused by Nampt deletion.
a NR was administered in the drinking water to dams during pregnancy. NR is converted to NMN and NAD, bypassing the need for Nampt in the salvage pathway. Figure created using BioRender. b Whole-mount alcian blue-alizarin red S staining of forelimbs and (c) hindlimbs (n = 3); pre-natal NR (pNR). d, e Serial sections from P2 Namptf/+ (control) and Namptf/f;Prx1-Cre (NamptΔPrx1) knees (representative of 2–3 pups per genotype) showing immunostaining for Nampt (d), Safranin O staining for proteoglycans (e), or TUNEL staining (green fluorescence) for dead cells (f). Fem femur, Tib tibia, Men Meniscus.
Fig. 4
Fig. 4. The NAD salvage pathway in mesenchymal cells is indispensable for formation of secondary ossification center and joint development post-birth.
NR was administered in the drinking water to dams during pregnancy (pNR) and progeny was examined at P7. a H&E staining performed on histological sections of Namptf/+ (control) and Namptf/f;Prx1-Cre (NamptΔPrx1) femurs (n = 3). The black boxes are enlarged and shown on the right. b Cell death by TUNEL assay in growth plate of femurs. c Histological sections as in panel a illustrating the damaged superficial cartilage at the knee joint in NamptΔPrx1 mice. d Expression of the indicated genes in cartilage dissected from the hind limbs by quantitative RT-PCR (n = 4 control and 5 mice/group). Lines represent mean ± SD, p values by two-sided Student t-test. Source data are provided as a Source Data file.
Fig. 5
Fig. 5. The NAD salvage pathway in mesenchymal cells is required for post-natal endochondral, but not intramembranous, bone formation.
a MicroCT images from femur of Namptf/+ (control) and Namptf/f;Prx1-Cre (NamptΔPrx1) mice at P28. b H&E staining performed on histological sections of knee, tibia, and ankle of NamptΔPrx1 mice to illustrate the lack of mineralized secondary ossification center (n = 3 mice/group). c Representative pictures of H&E staining of undemineralized histological sections of tibia (left) and quantification of osteoblast numbers at the endocortical surfaces (right) (n = 3 mice/group). Black arrows indicate osteoblasts covering the endocortical surfaces. BM=bone marrow. d Representative pictures of double calcein labels at the endocortical surfaces indicated by the white arrows (left) and quantification of mineral apposition rate (MAR) (right). Dotted white line marks the bone surface. e Representative pictures of male mice. f Whole body weight, and (g) DXA BMD of 1 mo-old male (n = 5 NamptΔOsx1 and 12 Osx1-cre mice/group) and female mice (n = 8 NamptΔOsx1 and 11 Osx1-cre mice/group). Lines represent mean ± SD, p values by two-sided Student t-test. Source data are provided as a Source Data file.
Fig. 6
Fig. 6. Chondrocytes have enhanced redox metabolism.
a Single-cell RNA-seq analysis, UMAP-based visualization of major classes of non-hematopoietic cells (bone and bone marrow fractions) based on two published single cell RNA sequencing datasets, annotated post hoc (see Supplementary Fig. 2 for cell specific markers of individual cell types) and colored by clustering. b Dot plots of selected reporter metabolites of individual cell types using reporter metabolite analysis test. c Expression (row-wide Z score of normalized expression level; single cell RNA sequencing) of metabolic related genes (rows) in the cells of each cluster (columns). Depicted in bold with an asterisk are the enzymes that require NAD/NADH or NADP/NADPH redox reactions.
Fig. 7
Fig. 7. Nampt inhibition has a similar effect on ATP production in chondrocytes cultured in normoxia versus hypoxia.
Primary chondrocytes from wild-type C57BL/6 mice were cultured in normoxia (20% O2) or hypoxia (1% O2) for a total of 3 days and treated with vehicle or FK866 for the last 24 h (a, d, f), or for a total of 4 days and treated for the last 48 h (b, c, e, g). Measurements of intracellular NAD+ (n = 3 wells) (a, b), NADH/NAD ratio (n = 3 wells) (c), intracellular ATP (n = 8 wells) (d, e), and lactate in the medium (n = 8 wells) (f, g). Graphs depict representative experiments. Each dot represents replicate wells. Each experiment was repeated twice. Lines represent mean ± SD, p values by Student t-test. Source data are provided as a Source Data file.
Fig. 8
Fig. 8. Nampt deletion greatly impacts gene expression in chondrocytes.
NR was administered to dams during pregnancy. Single cell RNA-seq analysis of cells extracted from the growth plates of P2 NamptΔPrx1 and littermate control mice born from dams receiving NR during pregnancy. a UMAP plot of chondrocytes and other mesenchymal lineage cells obtained from mice of both genotypes. b Gene expression plot of key known chondrocytes markers of individual cells on UMAP coordinate. c Dot plot of the distribution of top markers gene in Clusters 1–8. d UMAP plots of the different cell types described in panel a obtained from control versus NamptΔPrx1 mice; pre-natal NR (pNR). e Bar plots depicting the number and percentage of cells within the cell clusters shown in (d).
Fig. 9
Fig. 9. Nampt deletion severely impacts cell metabolism.
a Volcano plot of the differential gene expression results between chondrocytes II and chondrocytes I, described in Fig. 8, using two-sided MAST statistical test with false discovery rate adjusted p-value. Some key genes are labeled on the plot. Genes downregulated in chondrocytes II are in green and upregulated are in purple. b Serial sections from P2 Namptf/+ (control) and Namptf/f;Prx1-Cre (NamptΔPrx1) knees (representative of 2–3 pups per genotype) showing Safranin O staining for proteoglycans (left), in situ hybridization for Ptgs2 (center) and Pim3 (right); pre-natal NR (pNR). c, d Dot plots of key results of functional enrichment analysis based on the differential gene expression between chondrocytes II and chondrocytes I. Processes enriched in chondrocytes II are in purple and processes suppressed are in green based on gene ontology (GO) (c), and reporter metabolite (d).

References

    1. Canto C, Menzies KJ, Auwerx J. NAD(+) metabolism and the control of energy homeostasis: a balancing act between mitochondria and the nucleus. Cell Metab. 2015;22:31–53. doi: 10.1016/j.cmet.2015.05.023. - DOI - PMC - PubMed
    1. Bonkowski MS, Sinclair DA. Slowing ageing by design: the rise of NAD+ and sirtuin-activating compounds. Nat. Rev. Mol. Cell Biol. 2016;17:679–690. doi: 10.1038/nrm.2016.93. - DOI - PMC - PubMed
    1. Katsyuba E, Auwerx J. Modulating NAD(+) metabolism, from bench to bedside. EMBO J. 2017;36:2670–2683. doi: 10.15252/embj.201797135. - DOI - PMC - PubMed
    1. Imai S, Guarente L. NAD+ and sirtuins in aging and disease. Trends Cell Biol. 2014;24:464–471. doi: 10.1016/j.tcb.2014.04.002. - DOI - PMC - PubMed
    1. Bogan KL, Brenner C. Nicotinic acid, nicotinamide, and nicotinamide riboside: a molecular evaluation of NAD+ precursor vitamins in human nutrition. Annu Rev. Nutr. 2008;28:115–130. doi: 10.1146/annurev.nutr.28.061807.155443. - DOI - PubMed

Publication types

LinkOut - more resources