. 2023 Jun 17;14(1):3611.
doi: 10.1038/s41467-023-39299-3.

Spatiotemporal resolution of germinal center Tfh cell differentiation and divergence from central memory CD4+ T cell fate

Affiliations

Spatiotemporal resolution of germinal center Tfh cell differentiation and divergence from central memory CD4+ T cell fate

Fangming Zhu et al. Nat Commun. .

Abstract

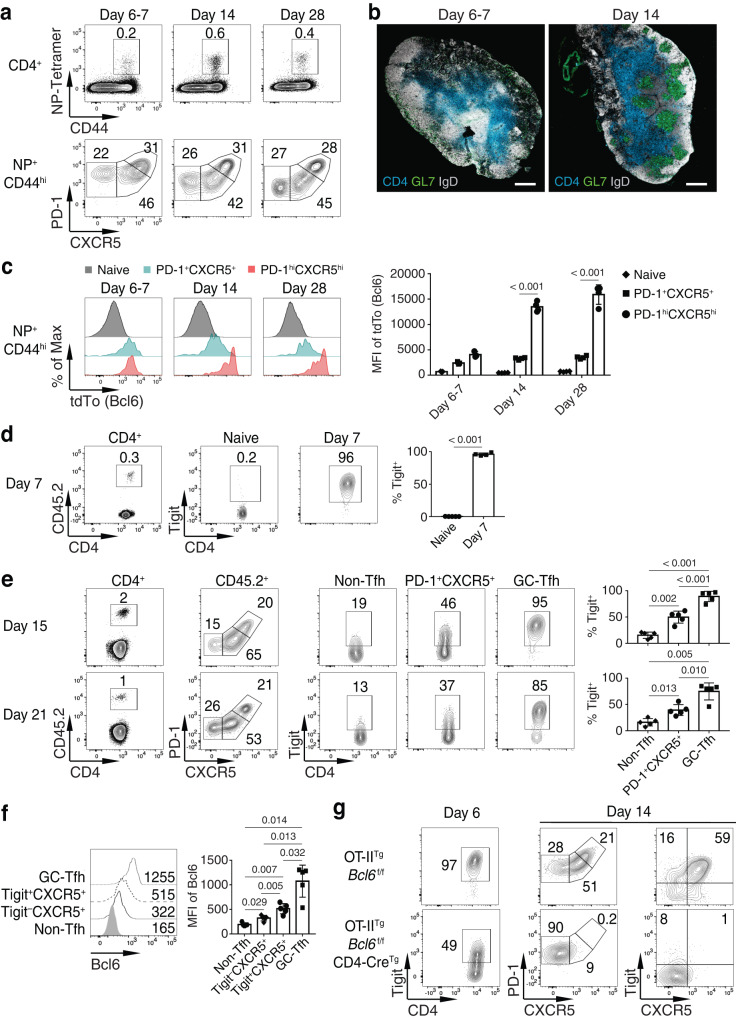
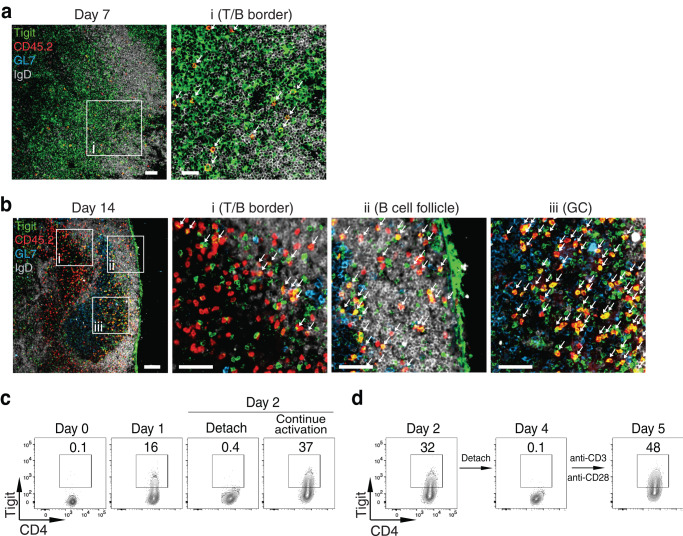
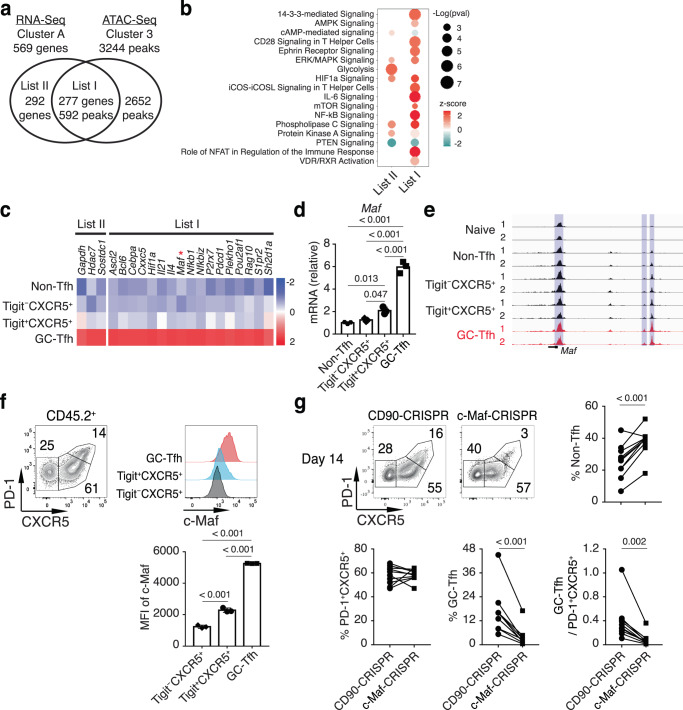
Follicular helper T (Tfh) cells are essential for germinal center (GC) B cell responses. However, it is not clear which PD-1+CXCR5+Bcl6+CD4+ T cells will differentiate into PD-1hiCXCR5hiBcl6hi GC-Tfh cells and how GC-Tfh cell differentiation is regulated. Here, we report that the sustained Tigit expression in PD-1+CXCR5+CD4+ T cells marks the precursor Tfh (pre-Tfh) to GC-Tfh transition, whereas Tigit-PD-1+CXCR5+CD4+ T cells upregulate IL-7Rα to become CXCR5+CD4+ T memory cells with or without CCR7. We demonstrate that pre-Tfh cells undergo substantial further differentiation at the transcriptome and chromatin accessibility levels to become GC-Tfh cells. The transcription factor c-Maf appears critical in governing the pre-Tfh to GC-Tfh transition, and we identify Plekho1 as a stage-specific downstream factor regulating the GC-Tfh competitive fitness. In summary, our work identifies an important marker and regulatory mechanism of PD-1+CXCR5+CD4+ T cells during their developmental choice between memory T cell fate and GC-Tfh cell differentiation.


Conflict of interest statement

The authors declare no competing interests.

Figures

Fig. 1
Fig. 1. Sustained Tigit expression in CXCR5+CD4+ T cells is associated with GC-Tfh cell differentiation.
ac Bcl6-protein reporter mice were intranasally infected with PR8. a At days 6–7, 14, and 28 p.i., the NP+CD44hiCD4+ T cells in the medLN were analyzed for PD-1 and CXCR5 staining. b Confocal microscopy analysis of expression of CD4 (blue), GL7 (green), and IgD (white) in the medLN was performed at days 6–7 and 14 p.i. Scale bars, 400 μm. c Indicated populations of NP+CD44hiCD4+ T cells at days 6–7, 14, and 28 p.i. were analyzed for tdTomato (tdTo, Bcl6-reporter) expression (days 6–7, n = 4; day 14, n = 4; day 28, n = 4). df Purified OT-II cells were transferred into CD45.1+ SMARTA recipient mice followed by intranasal infection with PR8-OVA. (d) Naïve OT-II and donor OT-II at day 7 p.i. and (e) indicated donor cell populations at days 15 and 21 p.i. in the medLN were analyzed for Tigit staining (day 7, n = 4; day 15, n = 5; day 21, n = 5). f Indicated donor cell populations at day 21 p.i. in the medLN were analyzed for Bcl6 intracellular staining (n = 5). g Purified OT-II cells from OT-IITgBcl6f/f or OT-IITgBcl6f/fCD4-CreTg mice were transferred into CD45.1+ SMARTA recipient mice followed by intranasal infection with PR8-OVA. Indicated donor cell populations in the medLN were analyzed for Tigit, PD-1, and CXCR5 staining at days 6 and 14 p.i. Data in ag are representative (or pooled) results of at least two independent experiments. Bars represent average ±SD. The P-values were determined by a two-tailed unpaired t-test (d), a one-way ANOVA with Tukey’s multiple comparisons test (e, f), or a two-way ANOVA with Sidak’s multiple comparisons test (c). Source data are provided as a Source Data file.
Fig. 2
Fig. 2. Tigit+CD4+ T cell localization and regulation of Tigit expression in activated CD4+ T cells.
a, b Purified CD45.2+ OT-II cells were transferred into CD45.1+ C57BL/6 recipient mice followed by intranasal infection with PR8-OVA. Confocal microscopy analysis of expression of Tigit (green), CD45.2 (red), GL7 (blue), and IgD (white) in the medLN was performed at days 7 (a) and 14 (b) p.i. Insets of the T/B border (i), B cell follicle (ii), and GC (iii), as indicated, are shown at higher magnification, with each arrow (pointing to yellow) representing a cell stained with both Tigit and CD45.2. Scale bars, 50 μm and 25 μm (for zoom-in views) in a, and 100 μm and 50 μm (for zoom-in views) in b. c, d Purified CD4+ T cells from C57BL/6 mice were activated in vitro with anti-CD3/CD28 antibodies. Tigit staining was analyzed in: c naïve cells (Day 0), day 1 activated cells (Day 1), day 2 activated cells (Continue activation), and cells stimulated for 1 day, followed by transfer of cells to a new well for another day without further stimulation (Detach), and d CD4+ T cells activated for 2 days (Day 2) and expanded in culture for 2 days (Day 4), then re-stimulated with anti-CD3/CD28 antibodies overnight (Day 5). Data in ad are representative results of at least two independent experiments. Source data are provided as a Source Data file.
Fig. 3
Fig. 3. Transcriptome and chromatin accessibility analyses in Tfh cell differentiation.
Purified OT-II cells were transferred into CD45.1+ SMARTA recipient mice followed by intranasal infection with PR8-OVA. ac Donor OT-II cells at day 21 p.i. in the medLN were analyzed by RNA-seq. a Clustered heatmap of naïve and indicated donor cell populations. b Venn diagram of DEGs and c IPA for the indicated comparisons. d, e Donor OT-II cells at day 14 p.i. in the medLN were analyzed by ATAC-seq. d Clustered heatmap of naïve and indicated donor cell populations. e Transcription factor binding motif enrichment in ATAC-seq peak clusters from Fig. 3d (top), with RNA-seq gene expression of selected transcription factor family members (bottom). f GSEA of indicated donor cell populations using published Th1, Tcmp, and GC-Tfh signature gene sets. RNA-seq and ATAC-seq samples are independent biological replicates. Source data are provided as a Source Data file.
Fig. 4
Fig. 4. The divergent differentiation of Tigit and Tigit+ PD-1+CXCR5+CD4+ T cells.
a, b Purified OT-II cells were transferred into CD45.1+ SMARTA recipient mice followed by intranasal infection with PR8-OVA. Indicated donor cell populations at day 28 p.i. in the medLN (a) or spleen (b) were analyzed for PD-1, CXCR5, Tigit, and IL-7Rα staining (n = 11). ce CD45.1+CD45.2+ and CD45.1+ C57BL/6 mice were intranasally infected with PR8. CD45.1+CD45.2+CD44+Tigit+IL-7RαPD-1+CXCR5+ (Tigit+IL-7Rα) and CD45.1+CD44+TigitIL-7Rα+PD-1+CXCR5+ (TigitIL-7Rα+) CD4+ T cells at day 14 p.i. were sorted and co-transferred into CD45.2+ C57BL/6 recipient mice followed by intranasal infection with PR8. c Ratio of the two donor cell populations (left panel) and Tigit and IL-7Rα expression on indicated donor cell populations (right panel) before transfer. d Ratio of the two donor cell populations (left panel) and quantification of relative percentages at day 14 p.i. (right panel, n = 8). e Donor CD4+ T cells at day 14 p.i. in the medLN were analyzed for PD-1 and CXCR5 staining, with quantification of indicated populations and PD-1hiCXCR5hi GC-Tfh to PD-1+CXCR5+ cell ratios (n = 8). Data in ae are representative (or pooled) results of at least two independent experiments. Bars represent average ±SD. The P-values were determined by a two-tailed paired t-test (d, e), or a one-way ANOVA with Tukey’s multiple comparisons test (a, b). Source data are provided as a Source Data file.
Fig. 5
Fig. 5. Central memory phenotype induction in CXCR5 and CXCR5+ IL-7Rα+CD4+ T cells.
ac Purified OT-II cells were transferred into CD45.1+ SMARTA recipient mice followed by intranasal infection with PR8-OVA. Indicated donor cell populations at day 28 p.i. in the medLN were analyzed for CXCR6 and Ly6c staining (a) and Psgl-1 staining (b). c Indicated donor OT-II populations at day 28 p.i. in the medLN and spleen were analyzed for CD62L and CCR7 staining (n = 11). d Purified CD45.1+ OT-II cells were transferred into CD45.2+ C57BL/6 recipient mice followed by intranasal infection with PR8-OVA. Indicated donor OT-II populations at day 14 p.i. in the medLN were analyzed for CD62L and CCR7 staining (n = 3). e C57BL/6 mice were intranasally immunized with KLH-GP61-80 and LPS. Indicated GP+ populations at day 35 p.i. in the spleen were analyzed for CD62L and CCR7 staining (n = 5). Data in ae are representative (or pooled) results of at least two independent experiments. Bars represent average ±SD. The P-values were determined by a two-tailed unpaired t-test (b, d, e), or a one-way ANOVA with Tukey’s multiple comparisons test (c). Source data are provided as a Source Data file.
Fig. 6
Fig. 6. c-Maf is a critical regulator of pre- to GC-Tfh cell differentiation.
a Venn diagram of genes in RNA-seq Cluster A and gene loci in ATAC-seq Cluster 3 from Figs. 3a and 3d, respectively. b IPA of List I and List II genes from Fig. 6a. c Expression heatmap of select genes from List I and List II. d Donor OT-II cells at day 14 p.i. in the medLN of PR8-OVA-infected recipient mice were analyzed by real time RT-PCR for Maf mRNA levels (n = 3). e ATAC-seq read density at the Maf gene locus of naïve and indicated donor cell populations as in Fig. 3d. f Purified OT-II cells were transferred into CD45.1+ SMARTA recipient mice followed by intranasal infection with PR8-OVA. Donor OT-II cells at day 14 p.i. in the medLN were analyzed for PD-1 and CXCR5 staining (left), and indicated populations were analyzed for c-Maf intracellular staining (right, n = 3). g CRISPR/Cas9 was used to delete Thy1 (CD90-CRISPR) or Maf (c-Maf-CRISPR) in purified OT-II cells from CD45.1+CD45.2+ OT-IITg or CD45.2+ OT-IITg mice, respectively. CD90-CRISPR and c-Maf-CRISPR OT-II cells were co-transferred into CD45.1+ SMARTA recipient mice followed by intranasal infection with PR8-OVA. Donor OT-II cells at day 14 p.i. in the medLN were analyzed for PD-1 and CXCR5 staining (n = 10). Data in d, f, g are representative (or pooled) results of two independent experiments. Bars represent average ±SD. The P-values were determined by a two-tailed paired t-test (g), or a one-way ANOVA with Tukey’s multiple comparisons test (d, f). RNA-seq and ATAC-seq samples are independent biological replicates. Source data are provided as a Source Data file.
Fig. 7
Fig. 7. Plekho1 plays a stage-specific role in regulating the competitive fitness of GC-Tfh cells.
a Purified OT-II cells were transferred into CD45.1+ SMARTA recipient mice followed by intranasal infection with PR8-OVA. Indicated donor cell populations at day 14 p.i. in the medLN were analyzed by real time RT-PCR for Plekho1 mRNA levels (n = 3). b ATAC-seq read density at the Plekho1 gene locus of naïve and indicated donor cell populations as in Fig. 3d. c Purified CD4+ T cells from C57BL/6 mice were activated in vitro and infected with control retrovirus (RV-Ctrl) or retrovirus expressing Maf (RV-c-Maf) under Th0 and Tfh-like culture conditions. On day 4, retrovirally infected cells were sorted and analyzed by real time RT-PCR for Plekho1 mRNA levels (n = 3). dh Purified OT-II cells from CD45.1+CD45.2+ and CD45.2+ OT-IITg mice were activated in vitro and infected with retrovirus expressing shRNAmir against CD19 (shCD19, CD45.1+CD45.2+) and Plekho1 (shPlekho1, CD45.2+). Retrovirally infected OT-II cells were co-transferred into CD45.1+ SMARTA recipient mice followed by intranasal infection with PR8-OVA two days after cell transfer. d Donor OT-II cells at days 14 and 21 p.i. in the medLN were analyzed for PD-1 and CXCR5 staining (day 14, n = 4; day 21, n = 8). eg Donor OT-II cells at day 14 p.i. in the medLN were analyzed by RNA-seq. e Clustered heatmap of shCD19 and shPlekho1 GC-Tfh cells. f Numbers and percentages of potential Foxo1 targets in Cluster i and Cluster ii genes from Fig. 7e. g Enrichr enrichment analysis of transcription factors associated with DEGs in Fig. 7e. h ImageStream analysis of Foxo1 sublocation in GC-Tfh cells 30 min after stimulation with anti-CD3/ICOS antibodies (n = 7). Scale bars, 12 μm. Data in a, c, d, h are representative (or pooled) results of two independent experiments. Bars represent average ±SD. The P-values were determined by a two-tailed paired t-test (d, h), a one-way ANOVA with Tukey’s multiple comparisons test (a), or a two-way ANOVA with Sidak’s multiple comparisons test (c). RNA-seq and ATAC-seq samples are independent biological replicates. Source data are provided as a Source Data file.

References

    1. Vinuesa CG, Tangye SG, Moser B, Mackay CR. Follicular B helper T cells in antibody responses and autoimmunity. Nat. Rev. Immunol. 2005;5:853–865. doi: 10.1038/nri1714. - DOI - PubMed
    1. Crotty S. Follicular helper CD4 T cells (TFH) Annu Rev. Immunol. 2011;29:621–663. doi: 10.1146/annurev-immunol-031210-101400. - DOI - PubMed
    1. Cannons JL, et al. Optimal germinal center responses require a multistage T cell:B cell adhesion process involving integrins, SLAM-associated protein, and CD84. Immunity. 2010;32:253–265. doi: 10.1016/j.immuni.2010.01.010. - DOI - PMC - PubMed
    1. Choi YS, et al. ICOS receptor instructs T follicular helper cell versus effector cell differentiation via induction of the transcriptional repressor Bcl6. Immunity. 2011;34:932–946. doi: 10.1016/j.immuni.2011.03.023. - DOI - PMC - PubMed
    1. Kerfoot SM, et al. Germinal center B cell and T follicular helper cell development initiates in the interfollicular zone. Immunity. 2011;34:947–960. doi: 10.1016/j.immuni.2011.03.024. - DOI - PMC - PubMed

Publication types

MeSH terms

Substances