. 2023 Jun 17;21(1):395.
doi: 10.1186/s12967-023-04262-9.

Integrative analysis of the gut microbiota and faecal and serum short-chain fatty acids and tryptophan metabolites in patients with cirrhosis and hepatic encephalopathy

Affiliations

Integrative analysis of the gut microbiota and faecal and serum short-chain fatty acids and tryptophan metabolites in patients with cirrhosis and hepatic encephalopathy

Qiang Wang et al. J Transl Med. .

Abstract

Objective: The purpose of this study was to describe the changes in the gut microbiome of patients with cirrhosis and hepatic encephalopathy (HE), as well as quantify the variations in short-chain fatty acid (SCFA) and tryptophan metabolite levels in serum and faeces.

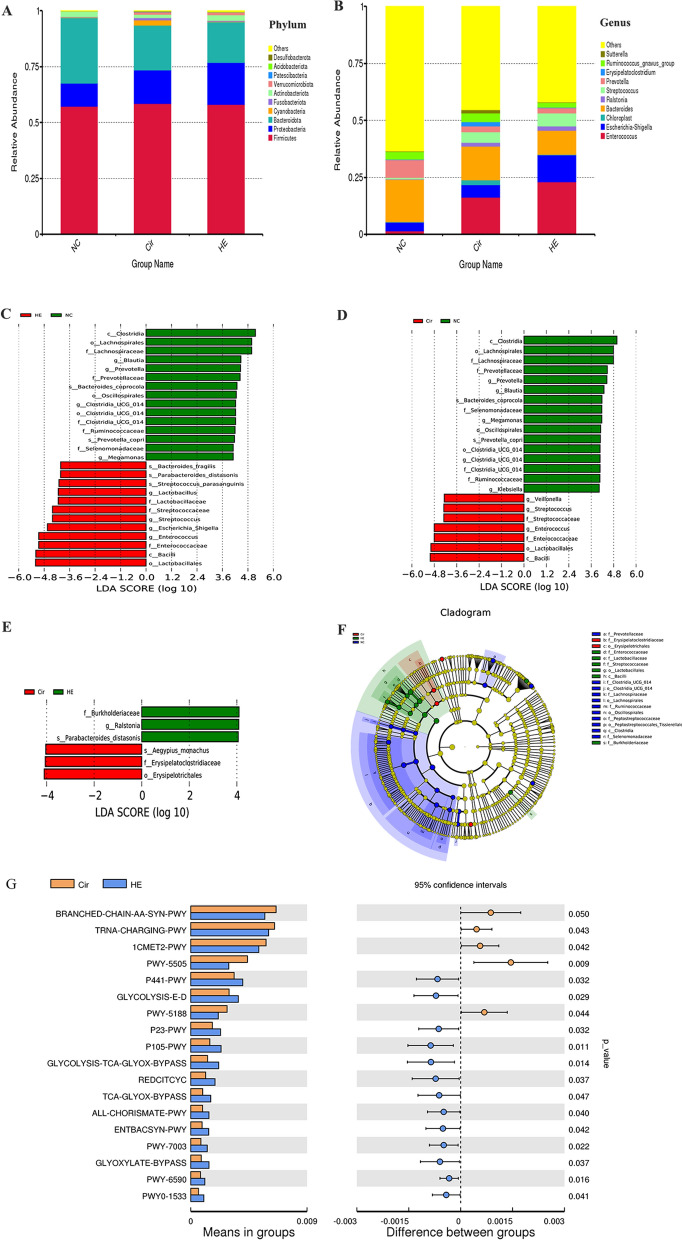
Methods: Fresh faeces and serum were collected from 20 healthy volunteers (NC group), 30 cirrhosis patients (Cir group), and 30 HE patients (HE group). Then, 16S rRNA sequencing and metabolite measurements were performed using the faeces. Gas chromatography‒mass spectrometry and ultrahigh-performance liquid chromatography-tandem mass spectrometry were used to measure SCFA and tryptophan levels, respectively. The results were analysed by SIMCA16.0.2 software. Differences in species were identified using MetaStat and t tests. The correlations among the levels of gut microbes and metabolites and clinical parameters were determined using Spearman correlation analysis.

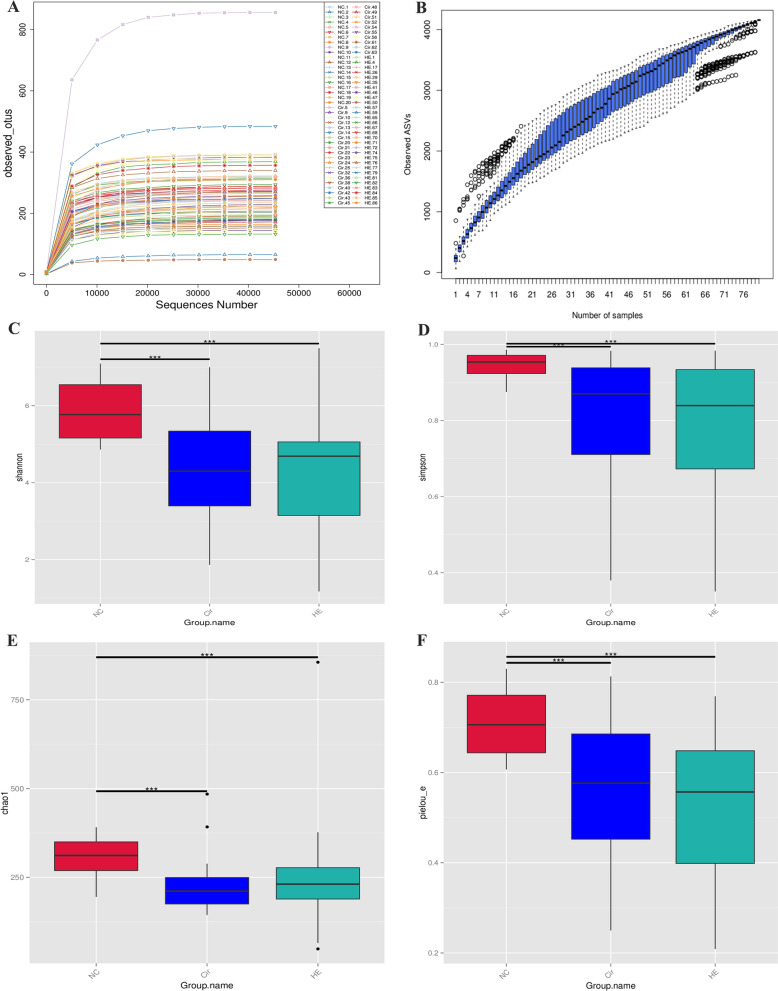
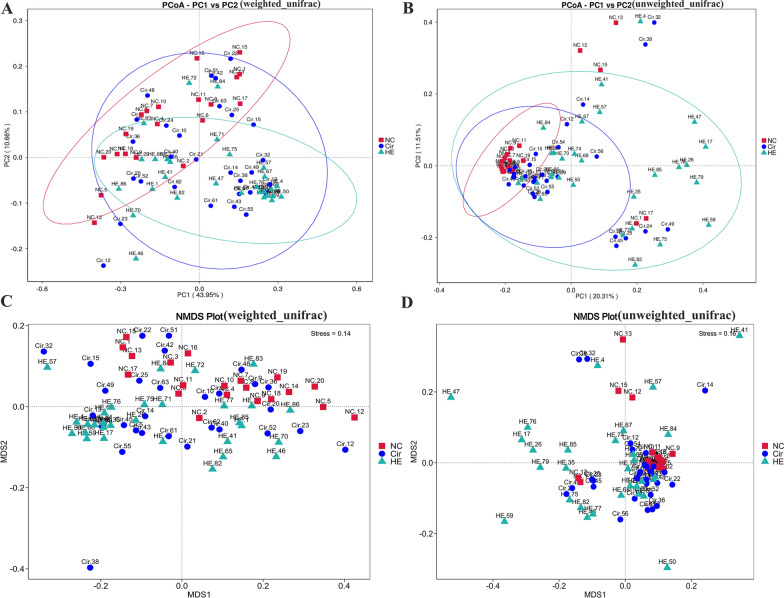
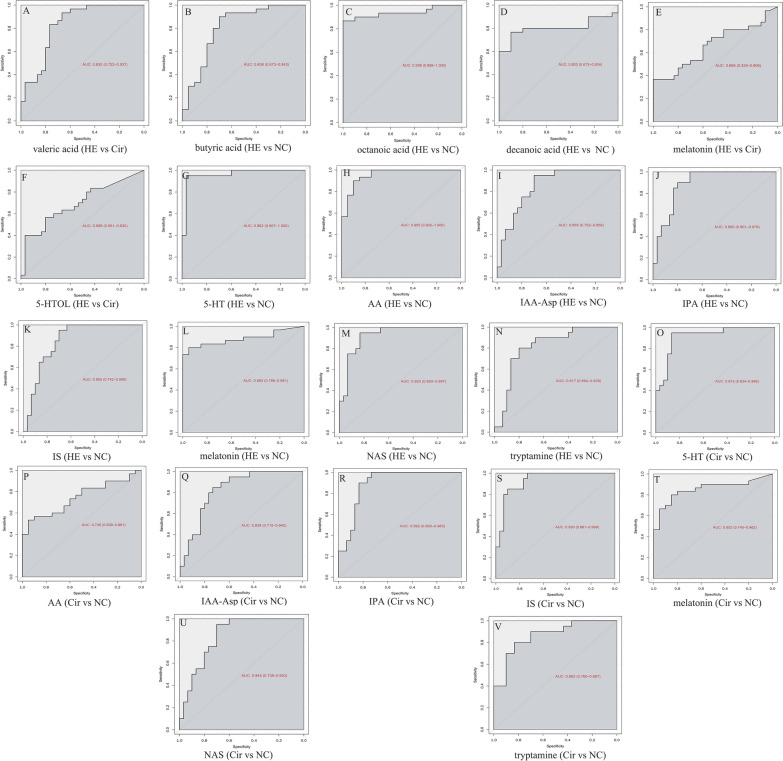
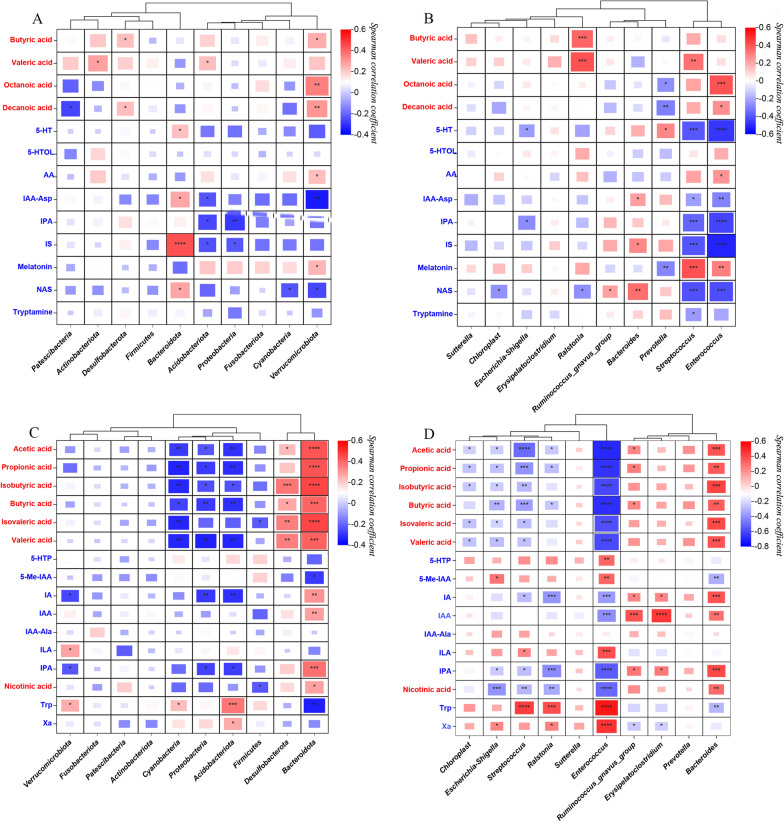
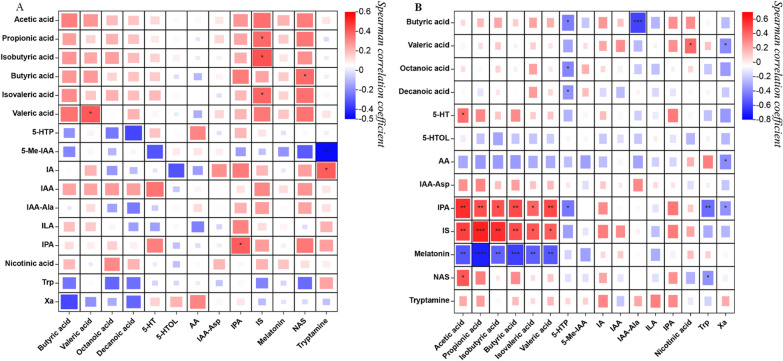
Results: Patients with cirrhosis and HE had lower microbial species richness and diversity in faeces than healthy volunteers; these patients also had altered β-diversity. Serum valeric acid levels were significantly higher in the HE group than in the Cir group. Serum SCFA levels did not differ between the Cir and NC groups. Serum melatonin and 5-HTOL levels were significantly higher in the HE group than in the Cir group. The Cir and NC groups had significant differences in the levels of eight serum tryptophan metabolites. Furthermore, the levels of faecal SCFAs did not differ between the HE and Cir groups. Faecal IAA-Ala levels were significantly lower in the HE group than in the Cir group. There were significant differences in the levels of 6 faecal SCFAs and 7 faecal tryptophan metabolites between the Cir and NC groups. Certain gut microbes were associated with serum and faecal metabolites, and some metabolites were associated with certain clinical parameters.

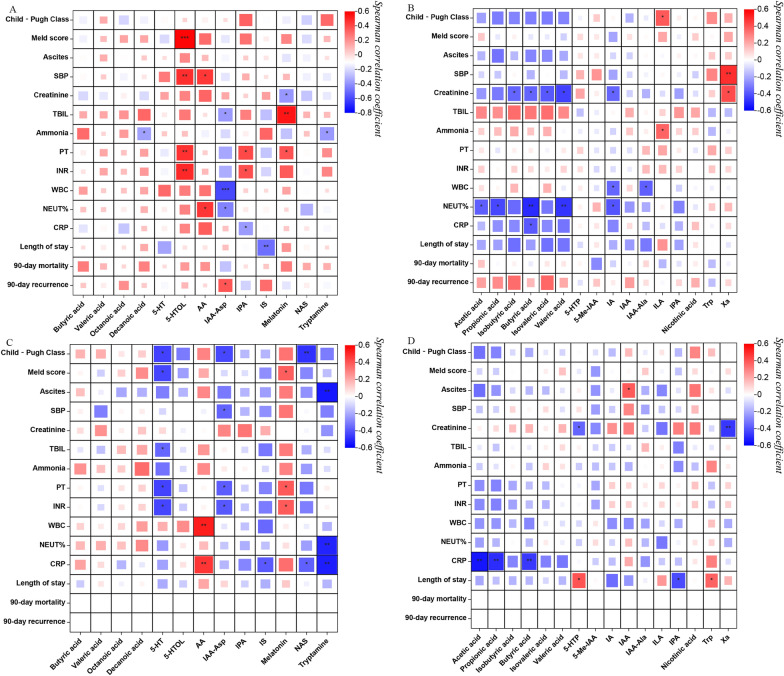
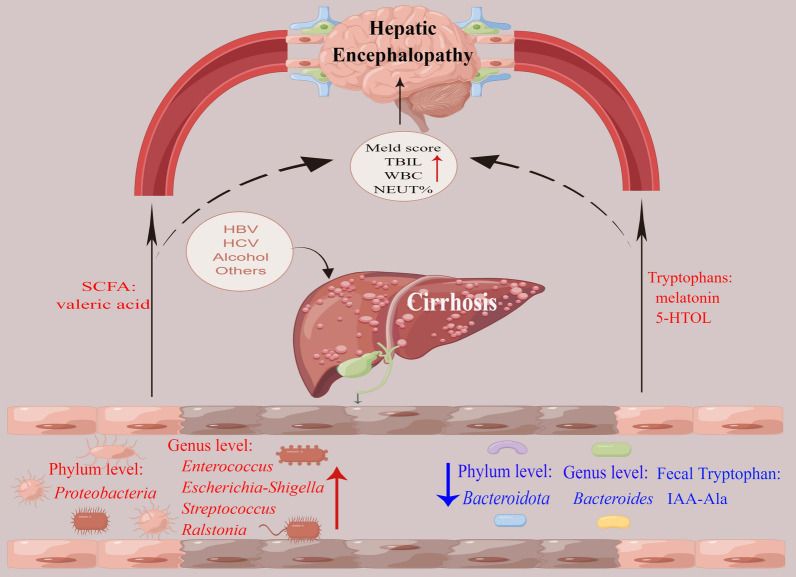
Conclusion: Reduced microbial species richness and diversity were observed in patients with HE and cirrhosis. In both serum and faeces, the levels of different SCFAs and tryptophan metabolites showed varying patterns of change. In HE patients, the levels of some serum tryptophan metabolites, and not SCFAs, were correlated with liver function and systemic inflammation. Systemic inflammation in patients with cirrhosis was correlated with faecal acetic acid levels. In summary, this study identified metabolites important for HE and cirrhosis.

Keywords: Gut microbiota; Hepatic encephalopathy; Liver cirrhosis; Short-chain fatty acids; Tryptophan.


Conflict of interest statement

The authors declare no competing interest.

Figures

Fig. 1
Fig. 1
Altered gut microbiota diversity in patients with cirrhosis and HE. A, Rarefaction curve in the HE, Cir, and NC groups. B Species accumulation boxplots in the HE, Cir, and NC groups. CF The α diversity alterations of gut microbiota in the three groups (Shannon, Simpson, Chao1, and Pielou_e index)
Fig. 2
Fig. 2
Gut microbiota composition of the three groups. A, B PCoA analysis using UniFrac distances. C, D NMDS analysis using Bray‒Curtis distances
Fig. 3
Fig. 3
The relative abundances of dominant taxa and the results of LDA effect size analysis of the three groups and function annotations. A, B Phylum- and genus-level relative abundances of dominant taxa. C LDA score for different taxa in the HE group (red) and NC group (green); D in the Cir group (red) and NC group (green); E in the Cir group (red) and HE group (green). F The evolutionary branch diagram of all taxa; circles in blue and green denote the differences between the most abundant classes of microbiota. G Results of the functional annotations in the Cir group and HE group based on the MetaCyc database
Fig. 4
Fig. 4
The AUC values achieved using the levels of serum SCFAs (AD) and tryptophan metabolites (EV)
Fig. 5
Fig. 5
The AUC values achieved using the levels of faecal SCFAs (AI) and tryptophan metabolites (JY)
Fig. 6
Fig. 6
Heatmap of correlation analysis between the levels of metabolites and gut microbes; red represents SCFAs; blue represents tryptophan. A Between serum metabolites and gut microbiota at the phylum level. B Between serum metabolites and gut microbiota at the genus level. C Between faecal metabolites and gut microbiota at the phylum level. D Between faecal metabolites and gut microbiota at the genus level
Fig. 7
Fig. 7
Heatmap of correlation analysis between the levels of serum metabolites and faecal metabolites in the HE group (A) and Cir group (B). On the left are metabolites in faeces, and the bottom part shows metabolites in serum
Fig. 8
Fig. 8
Heatmap of correlation analysis between the levels of metabolites (SCFAs and tryptophan) and clinical parameters. A Serum metabolites and clinical parameters of the HE group. B Faecal metabolites and the clinical parameters of the HE group. C Serum metabolites and the clinical parameters of the Cir group. D Faecal metabolites and the clinical parameters of the Cir group
Fig. 9
Fig. 9
The critical gut microbes, SCFAs, and tryptophan metabolites that may play vital roles in the pathogenesis and progression of cirrhosis to HE. Cirrhosis causes dysbiosis of the gut microbiota and changes in metabolite concentrations in both faeces and serum. These changes result in functional alterations that ultimately contribute to the development of hepatic encephalopathy as the disease progresses. Red represents an increase; blue represents depletion

References

    1. Collaborators GBDC The global, regional, and national burden of cirrhosis by cause in 195 countries and territories, 1990–2017: a systematic analysis for the global burden of Disease Study 2017. Lancet Gastroenterol Hepatol. 2020;5(3):245–66. doi: 10.1016/S2468-1253(19)30349-8. - DOI - PMC - PubMed
    1. Bajaj JS, O’Leary JG, Tandon P, Wong F, Garcia-Tsao G, Kamath PS, Maliakkal B, Biggins SW, Thuluvath PJ, Fallon MB, et al. Hepatic encephalopathy is Associated with mortality in patients with cirrhosis Independent of other extrahepatic organ failures. Clin Gastroenterol Hepatol. 2017;15(4):565–574e564. doi: 10.1016/j.cgh.2016.09.157. - DOI - PubMed
    1. Häussinger D, Dhiman RK, Felipo V, Görg B, Jalan R, Kircheis G, Merli M, Montagnese S, Romero-Gomez M, Schnitzler A, et al. Hepatic encephalopathy. Nat Rev Dis Primers. 2022;8(1):44. doi: 10.1038/s41572-022-00366-6. - DOI - PubMed
    1. Elsaid MIRustgi VK. Epidemiology of hepatic Encephalopathy. Clin Liver Dis. 2020;24(2):157–74. doi: 10.1016/j.cld.2020.01.001. - DOI - PubMed
    1. Rose CF, Amodio P, Bajaj JS, Dhiman RK, Montagnese S, Taylor-Robinson SD. Vilstrup HJalan R. hepatic encephalopathy: novel insights into classification, pathophysiology and therapy. J Hepatol. 2020;73(6):1526–47. doi: 10.1016/j.jhep.2020.07.013. - DOI - PubMed

Publication types

LinkOut - more resources