. 2023 Jun 17;13(1):9835.
doi: 10.1038/s41598-023-36359-y.

Screening macroalgae for mitigation of enteric methane in vitro

Affiliations

Screening macroalgae for mitigation of enteric methane in vitro

D E Wasson et al. Sci Rep. .

Abstract

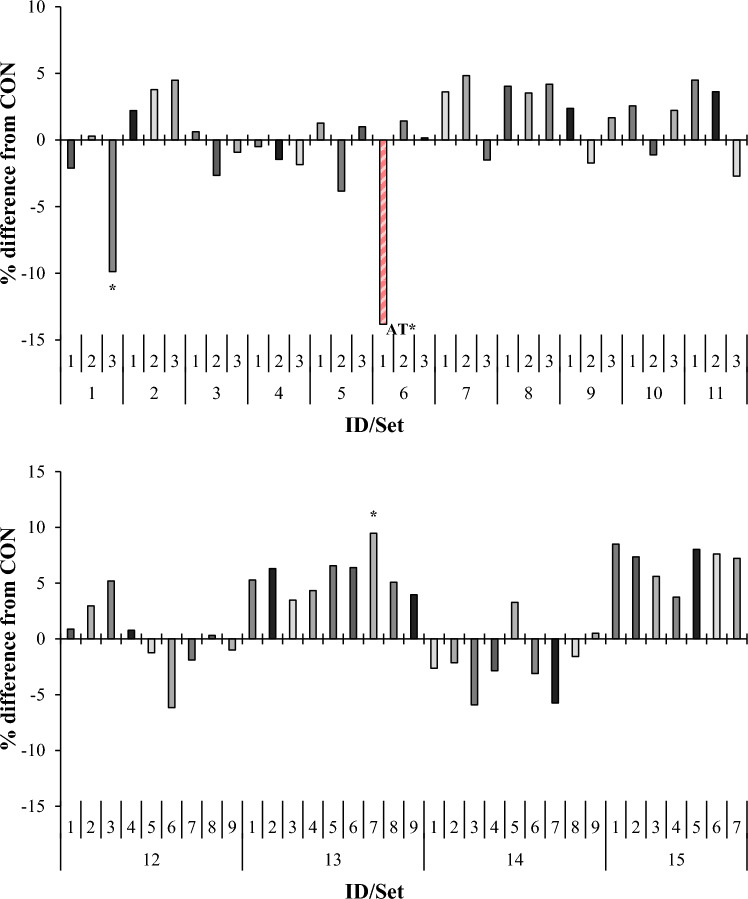
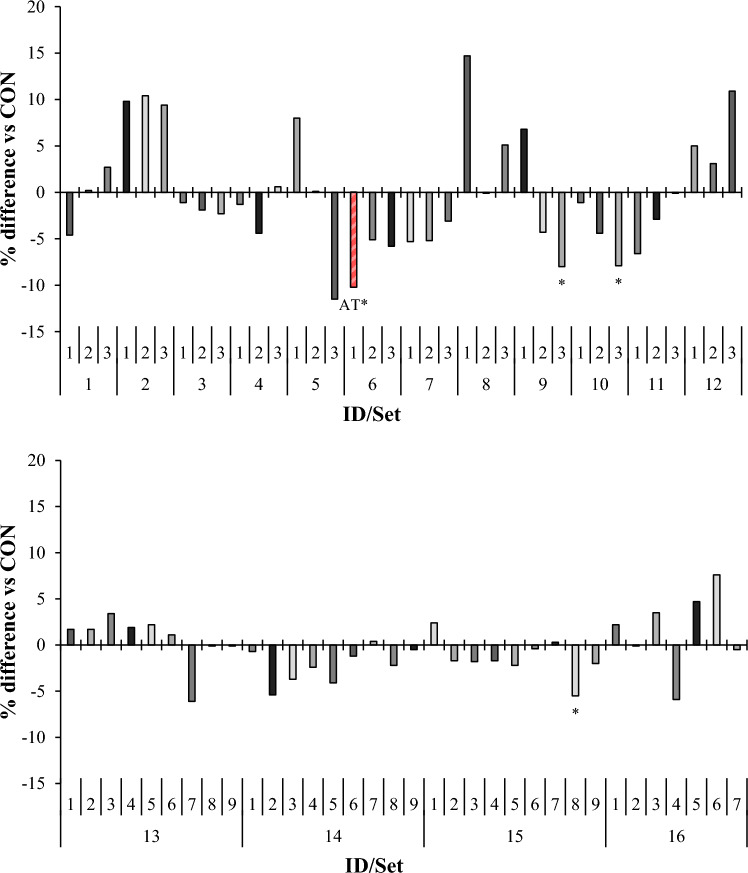
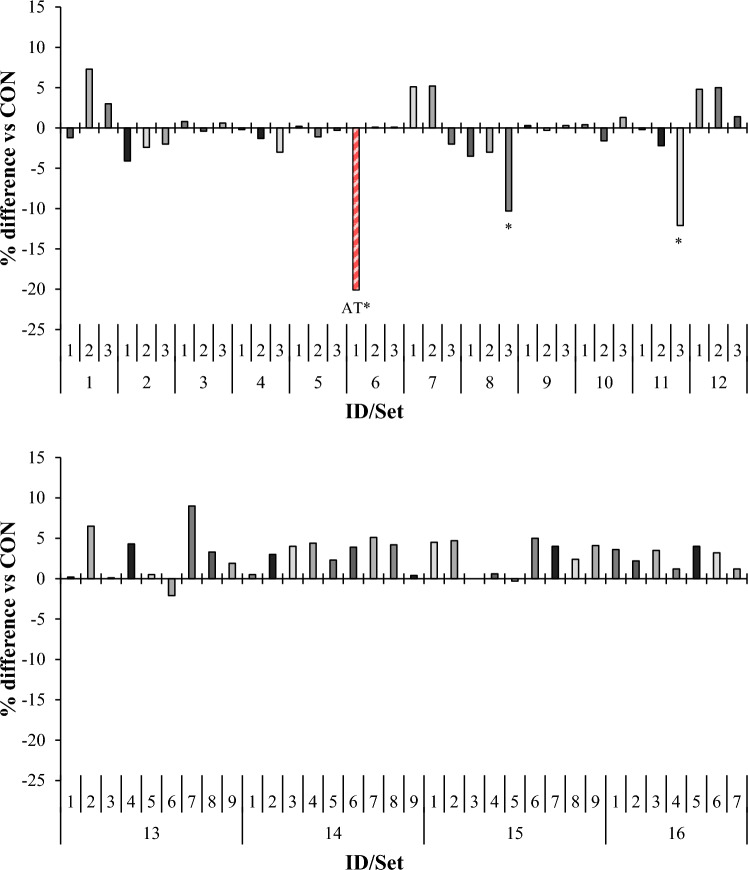
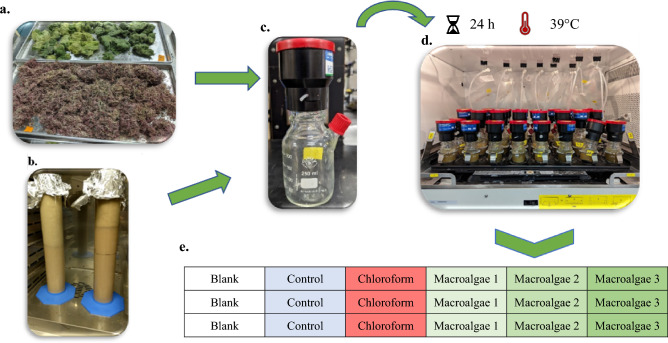
This study investigated the effects of 67 species of macroalgae on methanogenesis and rumen fermentation in vitro. Specimens were analyzed for their effect on ruminal fermentation and microbial community profiles. Incubations were carried out in an automated gas production system for 24-h and macroalgae were tested at 2% (feed dry matter basis) inclusion rate. Methane yield was decreased 99% by Asparagopsis taxiformis (AT) when compared with the control. Colpomenia peregrina also decreased methane yield 14% compared with control; no other species influenced methane yield. Total gas production was decreased 14 and 10% by AT and Sargassum horneri compared with control, respectively. Total volatile fatty acid (VFA) concentration was decreased between 5 and 8% by 3 macroalgae, whereas AT reduced it by 10%. Molar proportion of acetate was decreased 9% by AT, along with an increase in propionate by 14%. Asparagopsis taxiformis also increased butyrate and valerate molar proportions by 7 and 24%, respectively, whereas 3 macroalgae species decreased molar proportion of butyrate 3 to 5%. Vertebrata lanosa increased ammonia concentration, whereas 3 other species decreased it. Inclusion of AT decreased relative abundance of Prevotella, Bacteroidales, Firmicutes and Methanobacteriaceae, whereas Clostridium, Anaerovibrio and Methanobrevibacter were increased. Specific gene activities for Methanosphaera stadtmane and Methanobrevibacter ruminantium were decreased by AT inclusion. In this in vitro study, Asparagopsis taxiformis was most effective in decreasing methane concentration and yield, but also decreased total gas production and VFA concentration which indicates overall inhibition of ruminal fermentation. No other macroalgae were identified as potential mitigants of enteric methane.


Conflict of interest statement

The authors declare no competing interests.

Figures

Figure 1
Figure 1
Relative (percent difference, in comparison to set-specific control) effect of macroalgae on 24 h total gas production (mL/g dry matter) in vitro. For set-specific algae identification, see Supplementary Table 1 (ID# within Set). Number of observations used in the statistical analysis: from 26 to 66 (incubation Sets 1 through 15). Mean total gas production for control: 127, 126, 130, 126, 134, 130, 119, 121, 137, 123, 127, 123, 121, 122, and 97 mL/g dry matter, respectively; SEM = 4.1, 2.9, 2.5, 2.4, 5.3, 3.2, 6.2, 3.2, 3.7, 3.3, 4.7, 3.1, 3.5, 4.2, and 3.0, respectively. Means marked with an asterisk differ from the set-specific control (P < 0.05).
Figure 2
Figure 2
Relative (percent difference, in comparison to set-specific control) effect of macroalgae on 24 h methane yield (mL/g dry matter) in vitro. For set-specific algae identification, see Supplementary Table 1 (ID# within Set). Number of observations used in the statistical analysis: from 26 to 66 (incubation Sets 1 through 15). Mean methane yield for control: 7.97, 9.80, 7.61, 6.13, 8.90, 7.99, 7.71, 7.85, 8.48, 9.06, 7.47, 7.51, 8.01, 7.29, and 5.52 mL/g dry matter, respectively; SEM = 0.815, 0.541, 0.514, 0.367, 1.251, 0.666, 0.856, 0.464, 0.464, 0.617, 0.670, 0.560, 0.446, 0.439, and 0.395, respectively. Means marked with an asterisk differ from the set-specific control (P < 0.05).
Figure 3
Figure 3
Relative (percent difference, in comparison to set-specific control) effect of macroalgae on total VFA concentration (mM) in vitro. For set-specific algae identification, see Supplementary Table 1 (ID# within Set). Number of observations used in the statistical analysis: from 26 to 66 (incubation Sets 1 through 15). Mean Total VFA production for control: 52.1, 75.2, 63.7, 64.6, 59.3, 62.0, 47.5, 59.5, 65.0, 50.4, 59.1, 49.8, 49.6, 49.0, and 46.9 umol/mL, respectively; SEM = 1.43, 3.87, 2.79, 2.45, 4.19, 2.25, 4.09, 2.09, 3.61, 4.37, 3.92, 2.73, 1.37, 0.97, and 2.53, respectively. Means marked with an asterisk differ from the set-specific control (P < 0.05).
Figure 4
Figure 4
Relative (percent difference, in comparison to set-specific control) effect of macroalgae on acetate:propionate ratio in vitro. For set-specific algae identification, see Supplementary Table 1 (ID# within Set). Number of observations used in the statistical analysis: from 26 to 66 (incubation Sets 1 through 15). Mean acetate:propionate ratio for control: 1.72, 1.82, 2.34, 1.90, 2.06, 1.92, 2.34, 2.63, 2.63, 2.72, 2.38, 2.54, 2.45, 2.61, and 2.25 respectively; SEM = 0.055, 0.085, 0.202, 0.331, 0.427, 0.307, 0.320, 0.085, 0.556, 0.195, 0.943, 1.041, 0.094, and 0.057, respectively. Means marked with an asterisk differ from the set-specific control (P < 0.05).
Figure 5
Figure 5
Incubation workflow overview. Incubation workflow: (1) Macroalgae (a) and feed substrate are dried, ground, and added to the vessels (c) with the buffer; (2) Rumen inoculum (b) is collected and clarified; (3) Clarified inoculum is added to the vessels; (4) Vessels are sealed and placed into the incubator (d). Incubation layout example (e): Blank (no substrate), Control (feed substrate only), Chloroform (feed substrate + CHCl3), and Macroalgae (feed substrate with 2% DM Macroalgae).

References

    1. EPA. Inventory of U.S. Greenhouse Gas Emissions and Sinks. Accessed April 15, 2022. https://www.epa.gov/ghgemissions/inventory-us-greenhouse-gas-emissions-a.... (2021).
    1. Hungate RE, et al. Formate as an intermediate in the bovine rumen fermentation. J. Bacteriol. 1970;102:389–397. doi: 10.1128/jb.102.2.389-397. - DOI - PMC - PubMed
    1. Hristov AN, et al. Mitigation of methane and nitrous oxide emissions from animal operations: I. A review of enteric methane mitigation options. J. Anim. Sci. 2013;91:5045–5069. doi: 10.2527/jas.2013-6583. - DOI - PubMed
    1. Beauchemin KA, et al. Review: Fifty years of research on rumen methanogenesis: Lessons learned and future challenges for mitigation. Animal. 2020;14:S2–S16. doi: 10.1017/S1751731119003100. - DOI - PubMed
    1. Arndt C, et al. Full adoption of the most effective strategies to mitigate methane emissions by ruminants can help meet the 1.5 °C target by 2030 but not 2050. Proc. Natl. Acad. Sci. 2022;119:e2111294119. doi: 10.1073/pnas.2111294119. - DOI - PMC - PubMed

Publication types