. 2024 Mar;13(2):264-276.
doi: 10.1016/j.jshs.2023.06.004. Epub 2023 Jun 17.

Lower limb suspension induces threshold-specific alterations of motor units properties that are reversed by active recovery

Affiliations

Lower limb suspension induces threshold-specific alterations of motor units properties that are reversed by active recovery

Giacomo Valli et al. J Sport Health Sci. 2024 Mar.

Abstract

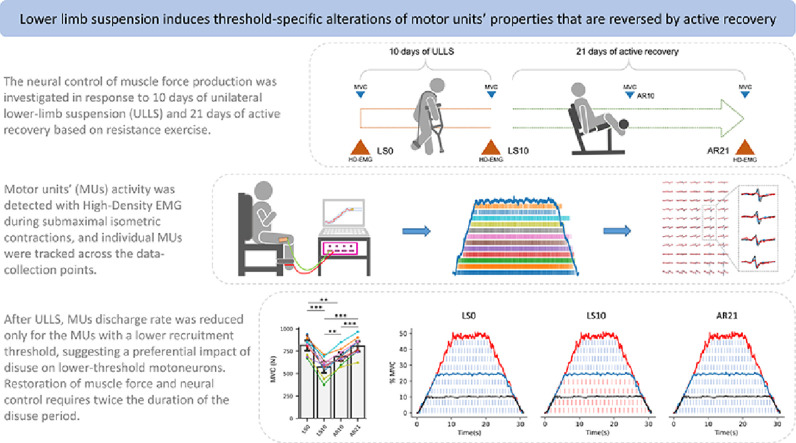
Purpose: This study aimed to non-invasively test the hypothesis that (a) short-term lower limb unloading would induce changes in the neural control of force production (based on motor units (MUs) properties) in the vastus lateralis muscle and (b) possible changes are reversed by active recovery (AR).

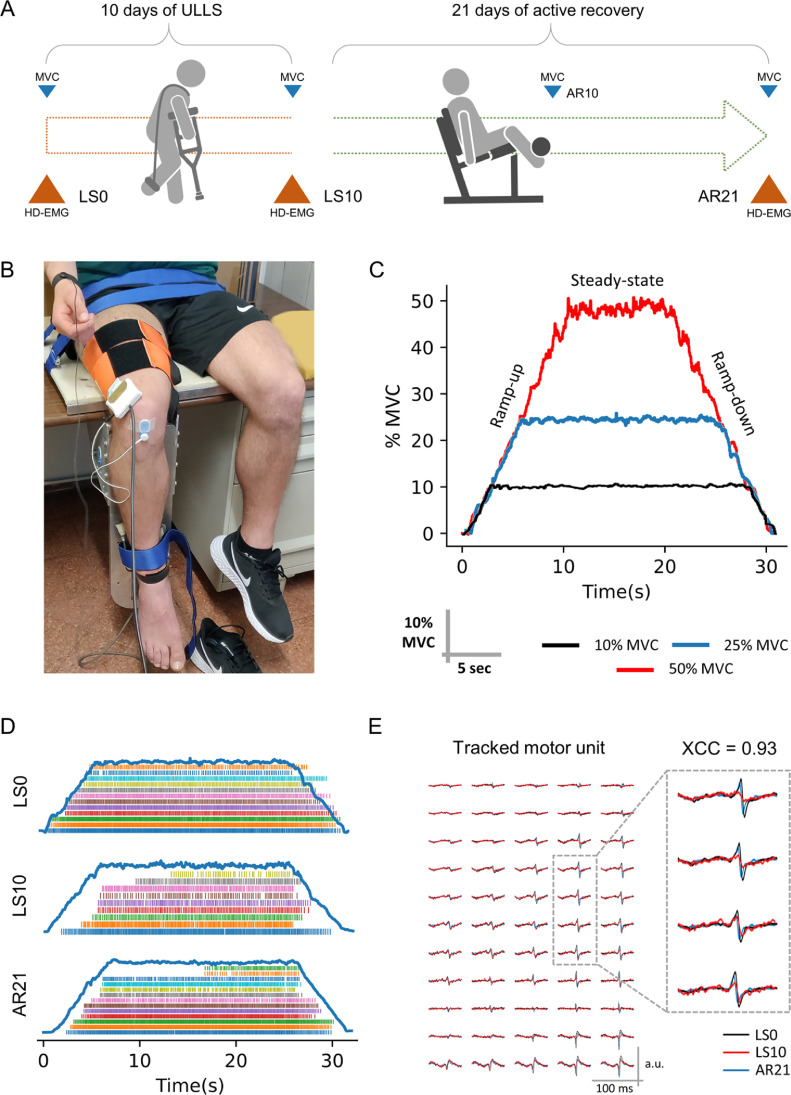
Methods: Ten young males underwent 10 days of unilateral lower limb suspension (ULLS) followed by 21 days of AR. During ULLS, participants walked exclusively on crutches with the dominant leg suspended in a slightly flexed position (15°-20°) and with the contralateral foot raised by an elevated shoe. The AR was based on resistance exercise (leg press and leg extension) and executed at 70% of each participant's 1 repetition maximum, 3 times/week. Maximal voluntary isometric contraction (MVC) of knee extensors and MUs properties of the vastus lateralis muscle were measured at baseline, after ULLS, and after AR. MUs were identified using high-density electromyography during trapezoidal isometric contractions at 10%, 25%, and 50% of the current MVC, and individual MUs were tracked across the 3 data collection points.

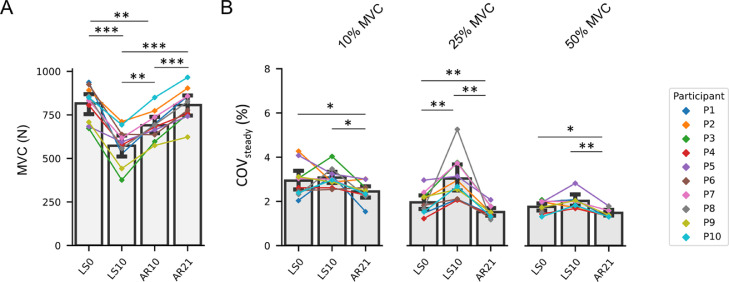
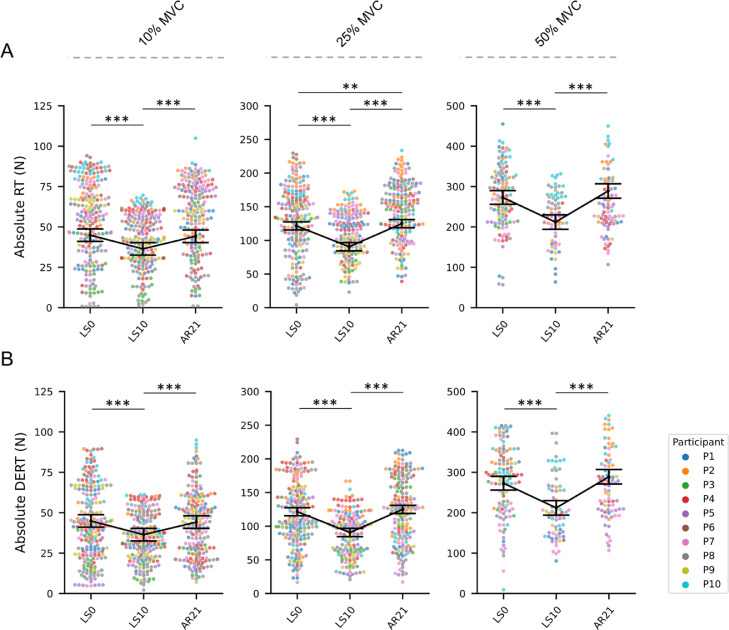
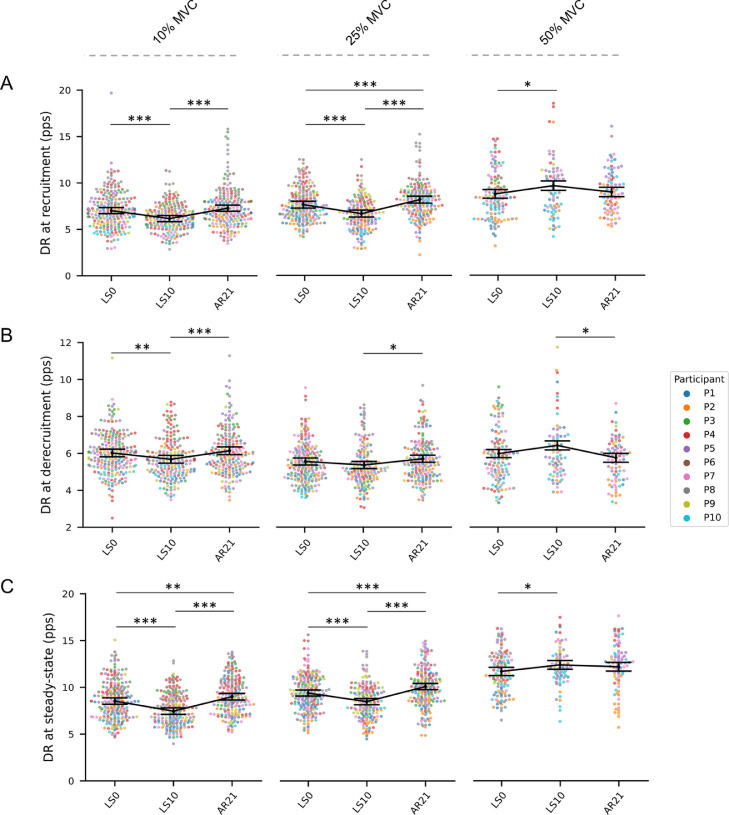
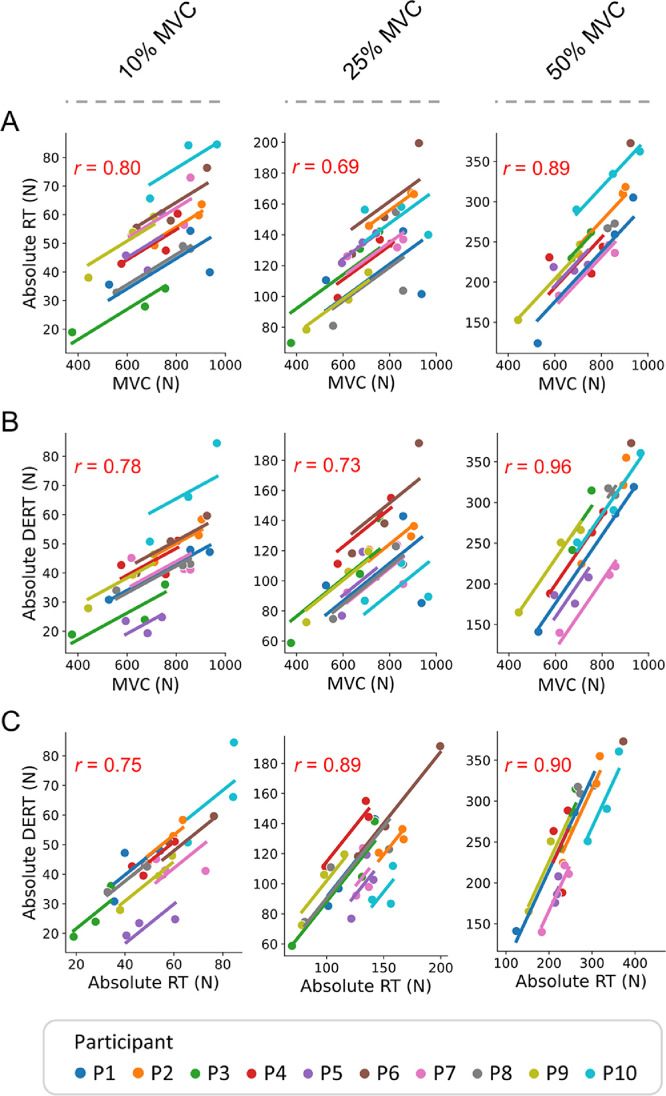
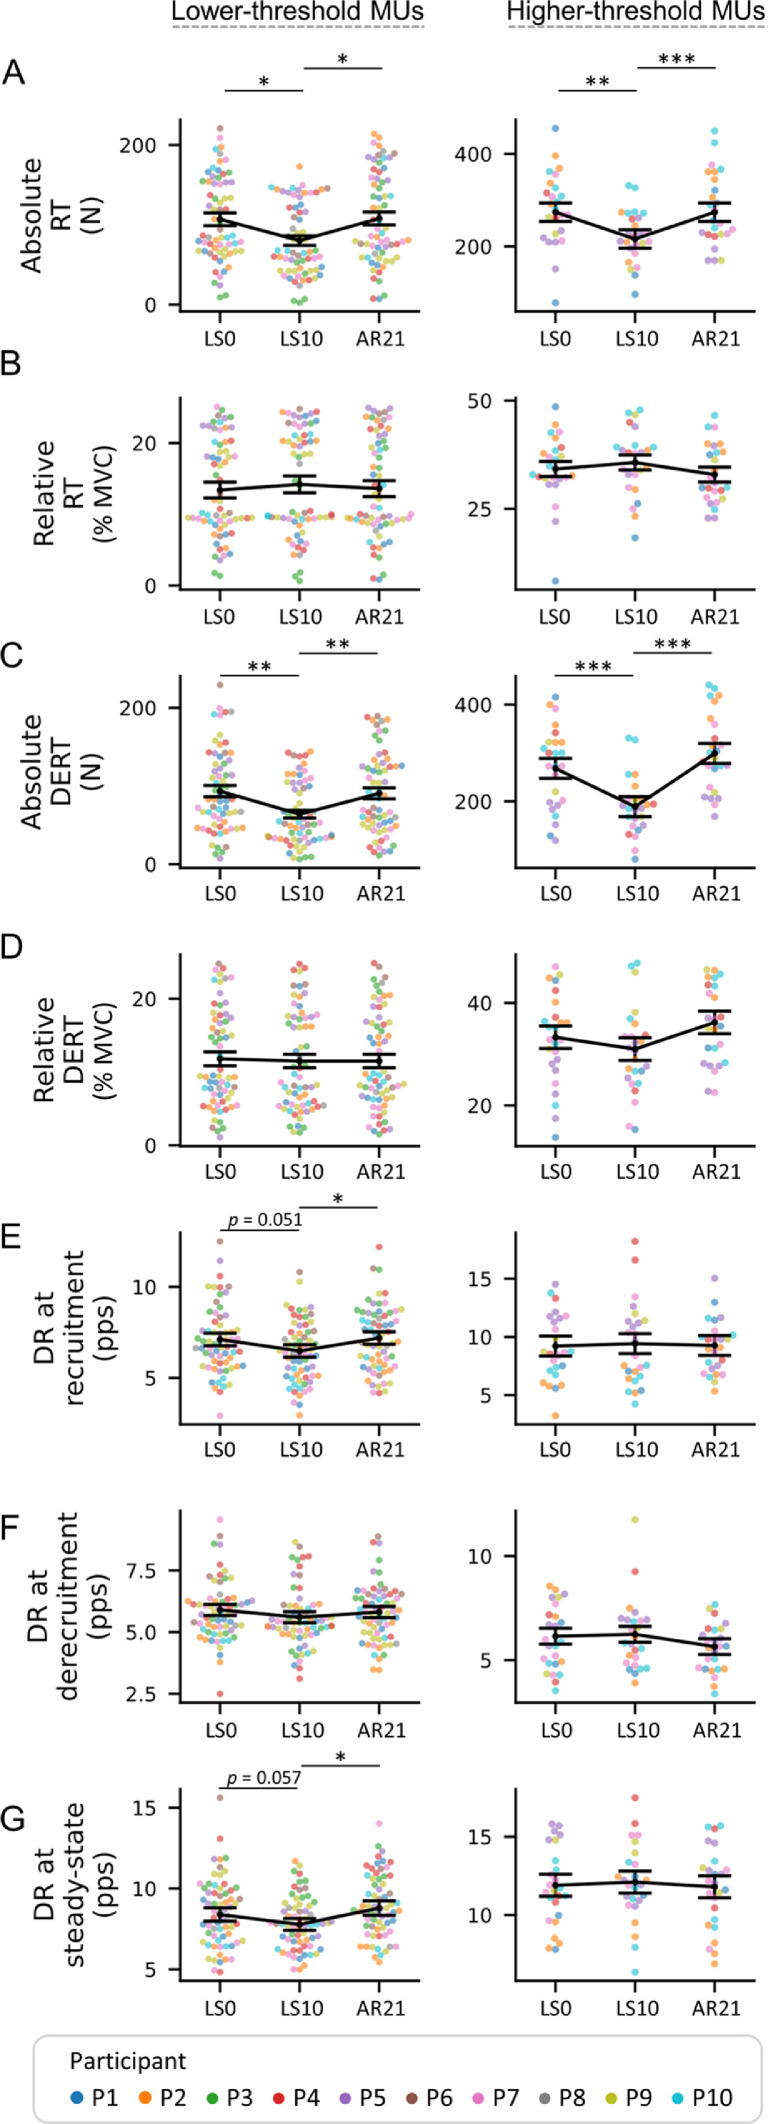
Results: We identified 1428 unique MUs, and 270 of them (18.9%) were accurately tracked. After ULLS, MVC decreased by 29.77%, MUs absolute recruitment/derecruitment thresholds were reduced at all contraction intensities (with changes between the 2 variables strongly correlated), while discharge rate was reduced at 10% and 25% but not at 50% MVC. Impaired MVC and MUs properties fully recovered to baseline levels after AR. Similar changes were observed in the pool of total as well as tracked MUs.

Conclusion: Our novel results demonstrate, non-invasively, that 10 days of ULLS affected neural control predominantly by altering the discharge rate of lower-threshold but not of higher-threshold MUs, suggesting a preferential impact of disuse on motoneurons with a lower depolarization threshold. However, after 21 days of AR, the impaired MUs properties were fully restored to baseline levels, highlighting the plasticity of the components involved in neural control.

Keywords: Disuse; High-density EMG; Muscle disuse; Neural impairment; Neuromuscular degeneration.


Conflict of interest statement

Competing interests The authors declare that they have no competing interests.

Figures

Image, graphical abstract
Graphical abstract
Fig 1
Fig. 1
Schematic representation of (A) the study design and (B–E) procedures of data collection and analysis. (A) data were collected at baseline (Day 0 of limb suspension), after 10 days of ULLS, and after 21 days of active recovery (data collection points were named LS0, LS10, and AR21, respectively). MVC was recorded also after 10 days of active recovery (AR10); (B) HD-EMG was recorded from the vastus lateralis muscle during ramp contractions at 10%, 25%, and 50% MVC; (C) ramp slope was standardized at 5% MVC/s. The recorded electrical activity of the muscle was decomposed to obtain (D) the pattern of discharge times of the MUs and (E) the MUs action potential shape was used to track the MUs longitudinally across the different data collection points. XCC is the measure of similarity between the MUs action potential shape. AR = active recovery; HD-EMG = high-density electromyography; LS = limb suspension; MUs = motor units; MVC = maximal voluntary contraction; ULLS = unilateral lower limb suspension; XCC = cross-correlation coefficient.
Fig 2
Fig. 2
Bar plots representing (A) the MVC and (B) the COV of the steady state phase at the different data collection points. COV of the steady state phase is also represented at the 3 different submaximal contraction intensities (i.e., 10%, 25%, and 50% MVC). Data are displayed as mean ± SD, and the changes for every participant are highlighted by a connected point plot. Significance levels are: * p < 0.05, ** p < 0.01, *** p < 0.001. AR = active recovery; COV = coefficient of variation of force; LS = limb suspension; MVC = maximal voluntary isometric contraction; N = Newton.
Fig 3
Fig. 3
Swarm plots representing the (A) absolute MUs RT and (B) DERT at the 3 data collection points. From left to right, MUs properties are presented for the 3 different submaximal contraction intensities (i.e., 10% MVC, 25% MVC, and 50% MVC). Individual MUs are represented by dots and clustered by subject. Summary data are presented as mean ± SEM, and the direction of the changes is highlighted by a connection line. Significance levels are: ** p < 0.01, *** p < 0.001. AR = active recovery; DERT = derecruitment threshold; LS = limb suspension; MUs = motor units; MVC = maximal voluntary isometric contraction; N = Newton; RT = recruitment threshold; SEM = standard error of the mean.
Fig 4
Fig. 4
Swarm plots representing the MUs DR at (A) recruitment, (B) derecruitment, and (C) during the steady-state phase at the 3 data collection points. From left to right, MUs properties are presented for the 3 different submaximal contraction intensities (i.e., 10%, 25%, and 50% MVC). Individual MUs are represented by dots and clustered by subject. Summary data are presented as mean ± SEM, and the direction of the changes is highlighted by a connection line. Significance levels are: * p < 0.05, ** p < 0.01, *** p < 0.001. AR = active recovery; DR = discharge rate; LS = limb suspension; MUs = motor units; MVC = maximal voluntary isometric contraction; pps = pulses per second; SEM = standard error of the mean.
Fig 5
Fig. 5
Plots of the repeated-measures correlation describing the common within-individual association between (A) MVC and absolute RT, (B) MVC and absolute DERT, as well as (C) absolute RT and absolte DERT across the different data collection points. From left to right, correlations are presented at the 3 different submaximal contraction intensities (i.e., 10%, 25%, and 50% MVC). The r value is reported in the upper left of each figure. Significance level is p < 0.001 for all correlations. DERT = derecruitment threshold; MVC = maximal voluntary isometric contraction; N = Newton; RT = recruitment threshold.
Fig 6
Fig. 6
Swarm plots representing the MUs properties obtained from the pool of tracked MUs. (A and C) MUs RT and DERT are presented in both absolute and (B and D) relative terms (as percent of the MVC). MUs DR is shown at (E) recruitment, (F) derecruitment, and (G) during the steady-state phase, at the 3 data collection points. From left to right, MUs properties are presented based on the classification of lower- and higher-threshold (i.e., recruited below or above 25% MVC). Individual MUs are represented by dots and clustered by subject. Summary data are presented as mean ± SEM, and the direction of the changes is highlighted by a connection line. Significance levels are: * p < 0.05, ** p < 0.01, *** p < 0.001. AR = active recovery; DERT = derecruitment threshold; DR = discharge rate; LS = limb suspension; MUs = motor units; MVC = maximal voluntary isometric contraction; N = Newton; pps = pulses per second; RT = recruitment threshold; SEM = standard error of the mean.

Similar articles

Cited by

References

    1. Reggiani C. Not all disuse protocols are equal: New insight into the signalling pathways to muscle atrophy. J Physiol. 2015;593:5227–5228. - PMC - PubMed
    1. Sarto F, Valli G, Monti E. Motor unit alterations with muscle disuse: What's new? J Physiol. 2022;600:4811–4813. - PubMed
    1. Clark BC. In vivo alterations in skeletal muscle form and function after disuse atrophy. Med Sci Sports Exerc. 2009;41:1869–1875. - PubMed
    1. Monti E, Reggiani C, Franchi MV, et al. Neuromuscular junction instability and altered intracellular calcium handling as early determinants of force loss during unloading in humans. J Physiol. 2021;599:3037–3061. - PMC - PubMed
    1. Duchateau J, Hainaut K. Effects of immobilization on contractile properties, recruitment and firing rates of human motor units. J Physiol. 1990;422:55–65. - PMC - PubMed