. 2023 Aug;299(8):104935.
doi: 10.1016/j.jbc.2023.104935. Epub 2023 Jun 17.

A crystallin mutant cataract with mineral deposits

Affiliations

A crystallin mutant cataract with mineral deposits

Peter J Minogue et al. J Biol Chem. 2023 Aug.

Abstract

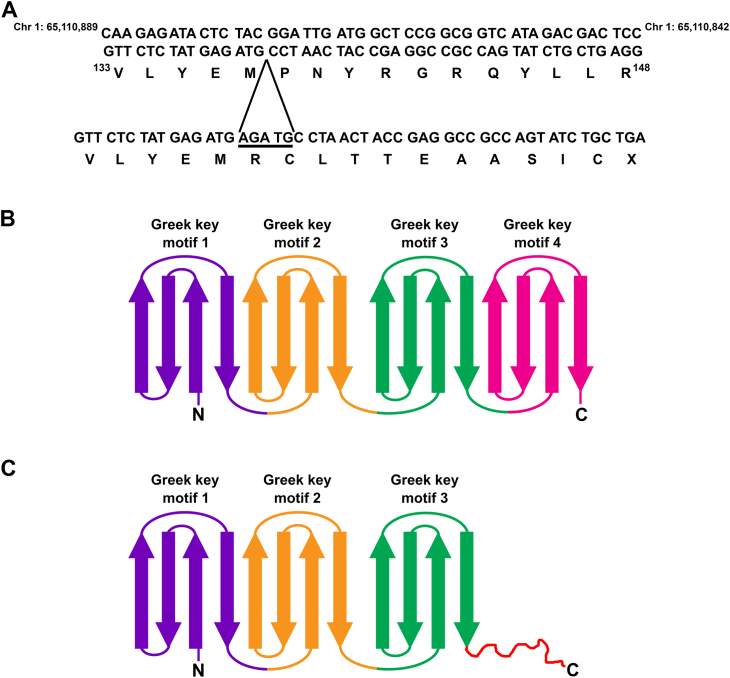
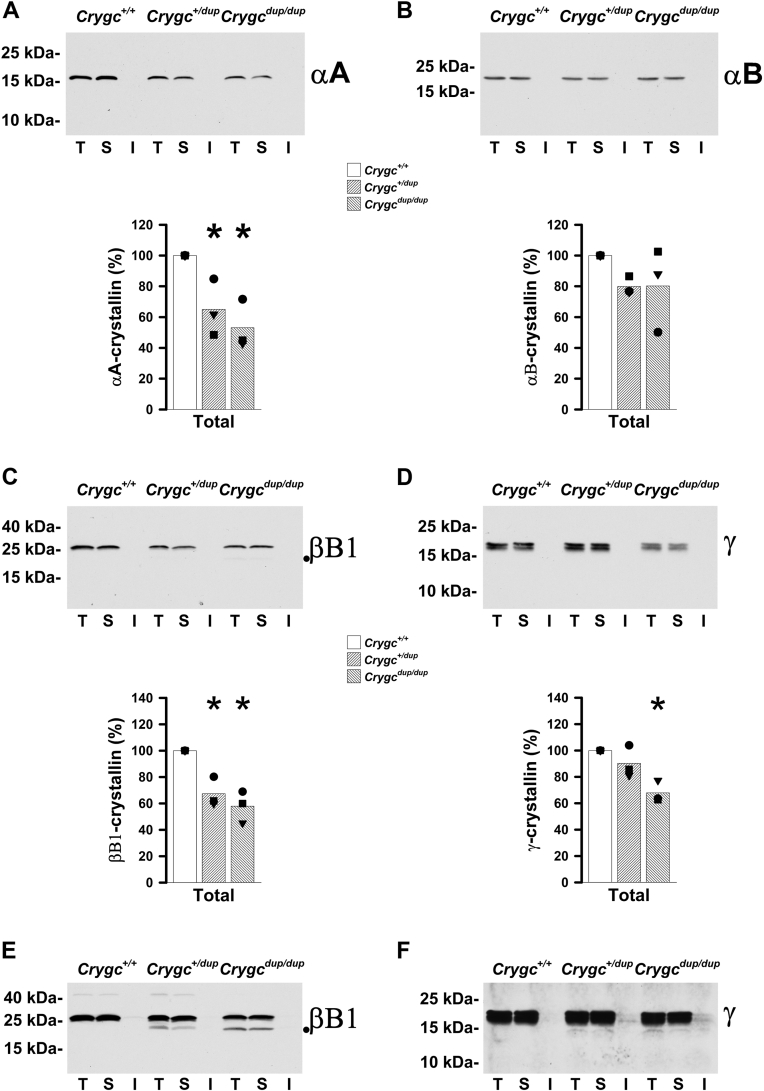
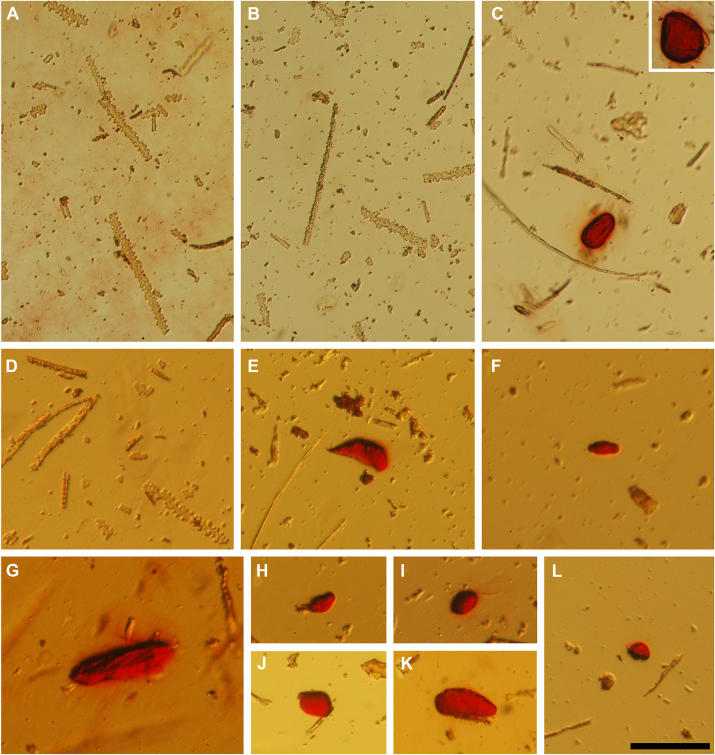
Connexin mutant mice develop cataracts containing calcium precipitates. To test whether pathologic mineralization is a general mechanism contributing to the disease, we characterized the lenses from a nonconnexin mutant mouse cataract model. By cosegregation of the phenotype with a satellite marker and genomic sequencing, we identified the mutant as a 5-bp duplication in the γC-crystallin gene (Crygcdup). Homozygous mice developed severe cataracts early, and heterozygous animals developed small cataracts later in life. Immunoblotting studies showed that the mutant lenses contained decreased levels of crystallins, connexin46, and connexin50 but increased levels of resident proteins of the nucleus, endoplasmic reticulum, and mitochondria. The reductions in fiber cell connexins were associated with a scarcity of gap junction punctae as detected by immunofluorescence and significant reductions in gap junction-mediated coupling between fiber cells in Crygcdup lenses. Particles that stained with the calcium deposit dye, Alizarin red, were abundant in the insoluble fraction from homozygous lenses but nearly absent in wild-type and heterozygous lens preparations. Whole-mount homozygous lenses were stained with Alizarin red in the cataract region. Mineralized material with a regional distribution similar to the cataract was detected in homozygous lenses (but not wild-type lenses) by micro-computed tomography. Attenuated total internal reflection Fourier-transform infrared microspectroscopy identified the mineral as apatite. These results are consistent with previous findings that loss of lens fiber cell gap junctional coupling leads to the formation of calcium precipitates. They also support the hypothesis that pathologic mineralization contributes to the formation of cataracts of different etiologies.

Keywords: cataract; connexin; crystallin; gap junction; infrared spectroscopy; intercellular conductance; lens; micro-computed tomography; mineralization.


Conflict of interest statement

Conflict of interest The authors declare that they have no conflicts of interest with the contents of this article.

Figures

Figure 1
Figure 1
Homozygous crystallin mutant mice develop severe cataracts. A and B, darkfield images of the lenses from a 26-day-old wild-type C57BL/6J mouse (A) and a 23-day-old homozygous crystallin mutant mouse (B). Scale bar = 600 μm.
Figure 2
Figure 2
The mutant mice have a 5-bp duplication in the γC-crystallin (Crygc) gene. A, top, DNA sequence of a region of mouse chromosome 1 from the GRCM39 mouse genome assembly encoding part of γC-crystallin. The encoded wild-type amino acid sequence is shown underneath. Bottom, DNA sequence of the same region of chromosome 1 from a homozygous Crygc mutant mouse showing the site of insertion of the 5-bp duplication (underlined nucleotide sequence). The resulting amino acid sequence is shown underneath. The 5-bp duplication results in a frameshift and an early termination of the protein. B, diagram of the wild-type protein with its four Greek key motifs. C, diagram of the mutant protein. The frameshift occurs after the third Greek key motif (red squiggly line) and the resulting mutant protein lacks the fourth Greek key motif. C, C-terminus; N, N-terminus.
Figure 3
Figure 3
Heterozygous crystallin mutant mice develop mild cataracts with age. The lenses from wild-type (Crygc+/+; A, C, and E) and heterozygous crystallin mutant (Crygc+/dup; B, D, and F) mice at 90 (A and B), 120 (C and D), and 213 (E and F) days of age were photographed using darkfield illumination. A very faint opalescence is detected in the example shown for the 90-day-old heterozygous lens (B). By 120 days of age (D), heterozygous mutant lenses show several minor opacities in the nuclear region and a halo that encircles them. The number, intensity, and size of nuclear opacities are more pronounced at 213 days of age (F). Scale bar = 600 μm.
Figure 4
Figure 4
Expression of the γC-crystallin mutant decreases total levels of crystallins but does not lead to major effects on their solubility. AD, immunoblots illustrate levels of αA- (A), αB- (B), βB1- (C), and γ- (D) crystallins in whole lens homogenates (T), and lens aqueous-soluble (S) and aqueous-insoluble (I) fractions from 30- to 32-day-old wild-type (Crygc+/+), heterozygous mutant (Crygc+/dup), and homozygous mutant (Crygcdup/dup) mice. Total levels of αA- and βB1-crystallins were decreased in heterozygous mutant lenses, while total levels of αA-, βB1- and γ-crystallins were decreased in homozygous mutant lenses. A faint βB1-crystallin band of faster electrophoretic mobility was detected in the total homogenate and aqueous-soluble fraction of homozygous mutant lenses (its position is marked with a dot in panel C). Graphs show the average of the densitometric values of the bands obtained in the total homogenates after quantification of the bands detected in three independent experiments (black symbols, one for each set containing all three genotypes). For each experiment, values were normalized to the value determined in the total homogenate of the wild-type lens for the corresponding crystallin (which was set to 100%). Asterisks indicate values that differed significantly from the levels in the total homogenate of the wild-type mice. E, example illustrating the appearance of the faster electrophoretic mobility βB1-crystallin band in the total homogenates and aqueous-soluble fractions of heterozygous mutant (Crygc+/dup) and homozygous mutant (Crygcdup/dup) lenses after long overexposure of the X-ray film. F, example illustrating the slight bands of γ-crystallin detected in the insoluble fraction of some heterozygous mutant (Crygc+/dup) and homozygous mutant (Crygcdup/dup) lenses after extremely long overexposure of the X-ray film. The example also illustrates the appearance of a very faint band that migrates faster than the doublet in the total homogenates and aqueous-soluble fractions from heterozygous (Crygc+/dup) and homozygous (Crygcdup/dup) mutant lenses.
Figure 5
Figure 5
Cellular organization and denucleation are impaired in CrygCdup-expressing lenses. AF, confocal images show the distributions of wheat germ agglutinin (WGA; A, C and E) and Draq5-stained nuclei and nuclear remnants (B, D, and F) in equatorial sections from 10-day-old lenses of wild-type (Crygc+/+; A and B), heterozygous mutant (Crygc+/dup; C and D), and homozygous mutant (Crygcdup/dup; E and F) mice. Scale bar: 100 μm.
Figure 6
Figure 6
Expression of CrygCdupimpairs lens cell differentiation. AC, immunoblots of GRP78 (A), TOM20 (B), and histone H3 (C) in whole lens homogenates from wild-type (Crygc+/+), heterozygous mutant (Crygc+/dup), and homozygous mutant (Crygcdup/dup) mice at 30 days of age. The migration positions of the molecular mass markers are indicated on the left. Graphs show the quantification of the immunoreactive bands obtained in independent experiments (black circles). The bars represent the averages of the values obtained for each genotype (n = 3). Significant differences between wild-type and heterozygous mutant lenses or wild-type and homozygous mutant lenses are indicated by asterisks (p <0.05).
Figure 7
Figure 7
Expression of the crystallin mutant alters levels of Cx46 and Cx50 proteins but not their transcripts at 1 month of age. A and B, immunoblots of Cx46 (A) and Cx50 (B) in whole lens homogenates from wild-type (Crygc+/+), heterozygous mutant (Crygc+/dup), and homozygous mutant (Crygcdup/dup) mice at 30 days of age. The migration positions of the molecular mass markers are indicated on the left. Graphs show the quantification of the immunoreactive bands obtained in independent experiments (black circles). The bars represent the averages of the values obtained for each genotype (n = 3). Significant differences between wild-type and heterozygous mutant lenses or wild-type and homozygous mutant lenses are indicated by asterisks (p<0.05). C and D, graphs show the fold change of the transcript levels for Gja3 (Cx46 transcript; C) and Gja8 (Cx50 transcript; D) in 30-day-old heterozygous (Crygc+/dup) and homozygous (Crygcdup/dup) mutant lenses relative to wild-type littermate lenses (Crygc+/+) as determined by Reverse Transcription Real-Time PCR. The values obtained in each of three independent experiments are shown in black circles. The value obtained in wild-type lenses was considered as 1.
Figure 8
Figure 8
The immunoreactive pattern of distribution of Cx46 is altered in lenses expressing the crystallin mutant. AI, confocal images show the distributions of immunoreactive Cx46 (green; A, D and G) and filamentous actin (phalloidin, red; B, E and H) in cross sections from lenses of wild-type (Crygc+/+; AC), heterozygous mutant (Crygc+/dup; DF), and homozygous mutant (Crygcdup/dup; GI) mice at 46 to 48 days of age. The merged images for the two fluorescence signals and the nuclei stained with Draq5 are shown on the right (C, F and I). Scale bar: 45 μm.
Figure 9
Figure 9
The distribution of immunoreactive Cx50 is decreased in lenses expressing the crystallin mutant. AI, confocal images show the distributions of immunoreactive Cx50 (green; A, D and G) and filamentous actin (phalloidin, red; B, E, and H) in cross sections from lenses of wild-type (Crygc+/+; AC), heterozygous mutant (Crygc+/dup; DF), and homozygous mutant (Crygcdup/dup; GI) mice at 46 to 48 days of age. The merged images for the two fluorescence signals and Draq5-stained nuclei are shown on the right (C, F, and I). Scale bar: 45 μm.
Figure 10
Figure 10
Lenses from mice expressing the crystallin mutant have decreased gap junctional conductance. A, graph shows the series resistance (Rs) due to gap junctions coupling fiber cells between the point of recording and the surface of the lens from 91- to 118-day-old wild-type (Crygc+/+), heterozygous mutant (Crygc+/dup) and homozygous mutant (Crygcdup/dup) lenses. Data are graphed as a function of radial distance from the lens center (r; cm), normalized to the lens radius (a; cm). B, graphical comparison of the data from wild-type (Crygc+/+) and heterozygous mutant (Crygc+/dup) lenses to illustrate more clearly the increase in series resistance in heterozygous mutant lenses.
Figure 11
Figure 11
Particles in the insoluble fractions of Crygcdup/duplenses stain with Alizarin red. AC, photographs of material present in lens insoluble fractions from 60-day-old wild-type (A), heterozygous (B), and homozygous (C) mice after resuspension and reaction with Alizarin red. DF, photographs of material present in lens insoluble fractions from 111-day-old wild-type (D) and homozygous crystallin mutant (E and F) mice after resuspension and reaction with Alizarin red. C(inset) and GL, photographs show additional examples of Alizarin red-stained particles present in the insoluble fraction of homozygous crystallin mutant lenses. Scale bar: 97 μm for panels AC, 84 μm for panels DL.
Figure 12
Figure 12
Crygcdup/duplenses stain with Alizarin red. A and B, photographs of 35-day-old wild-type (Crygc+/+; A) and homozygous crystallin mutant (Crygcdup/dup; B) lenses using darkfield illumination. C and D, images show the same lenses from the wild-type (C) and the homozygote (D) after whole-mount staining with Alizarin red. Scale bar: 500 μm for panels A and B, 385 μm for panels C and D.
Figure 13
Figure 13
The X-ray dense material in Crygcdup/duplenses occupies the same region as the cataract. A and B, darkfield images of lenses from 60-day-old wild-type (A) and homozygous Crygcdup/dup (B) mice. C, Three-dimensional projection of the micro-CT images from the homozygous lens shown in B. The scale bar represents 216 μm for panels A and B, and 200 μm for panel C.
Figure 14
Figure 14
The mineral in Crygcdup/duplenses is apatite. A, image showing Yasue staining of a section from the lens of the 60-day-old homozygous Crygcdup/dup mouse shown on Figure 13, B and C. The stained material that appears black corresponds to calcifications. B, image of an adjacent unstained section of the same lens on low emissivity glass used for infrared imaging. C, image shows the infrared signal map of the boxed region shown in B generated by collecting infrared spectra with a pixel resolution of 1.56 μm. Green areas are mineral regions and blue areas are protein regions. D, graphs show the spectra of a non-mineral region, two mineral regions, and the apatite standard. Arrows point to spectral features characteristic of apatite mineral. The scale bars in A and B represent 200 μm. The scale bars in the insets of panels A and B represent 52.5 μm and 41.5 μm, respectively.

References

    1. Horwitz J. α-crystallin. Exp. Eye Res. 2003;76:145–153. - PubMed
    1. Bloemendal H., de Jong W., Jaenicke R., Lubsen N.H., Slingsby C., Tardieu A. Ageing and vision: structure, stability and function of lens crystallins. Prog. Biophys. Mol. Biol. 2004;86:407–485. - PubMed
    1. Resnikoff S., Pascolini D., Etya’ale D., Kocur I., Pararajasegaram R., Pokharel G.P., et al. Global data on visual impairment in the year 2002. Bull. World Health Organ. 2004;82:844–851. - PMC - PubMed
    1. Sharma K.K., Santhoshkumar P. Lens aging: Effects of crystallins. Biochim. Biophys. Acta. 2009;1790:1095–1108. - PMC - PubMed
    1. Truscott R.J.W., Friedrich M.G. Molecular processes implicated in human age-related nuclear cataract. Invest. Ophthalmol. Vis. Sci. 2019;60:5007–5021. - PMC - PubMed

Publication types