. 2023 Jun 18;11(1):98.
doi: 10.1186/s40478-023-01595-w.

Abcd1 deficiency accelerates cuprizone-induced oligodendrocyte loss and axonopathy in a demyelinating mouse model of X-linked adrenoleukodystrophy

Affiliations

Abcd1 deficiency accelerates cuprizone-induced oligodendrocyte loss and axonopathy in a demyelinating mouse model of X-linked adrenoleukodystrophy

Ksenija Martinović et al. Acta Neuropathol Commun. .

Abstract

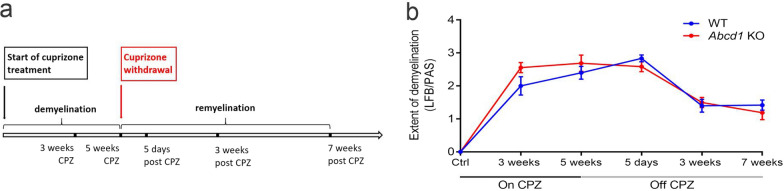
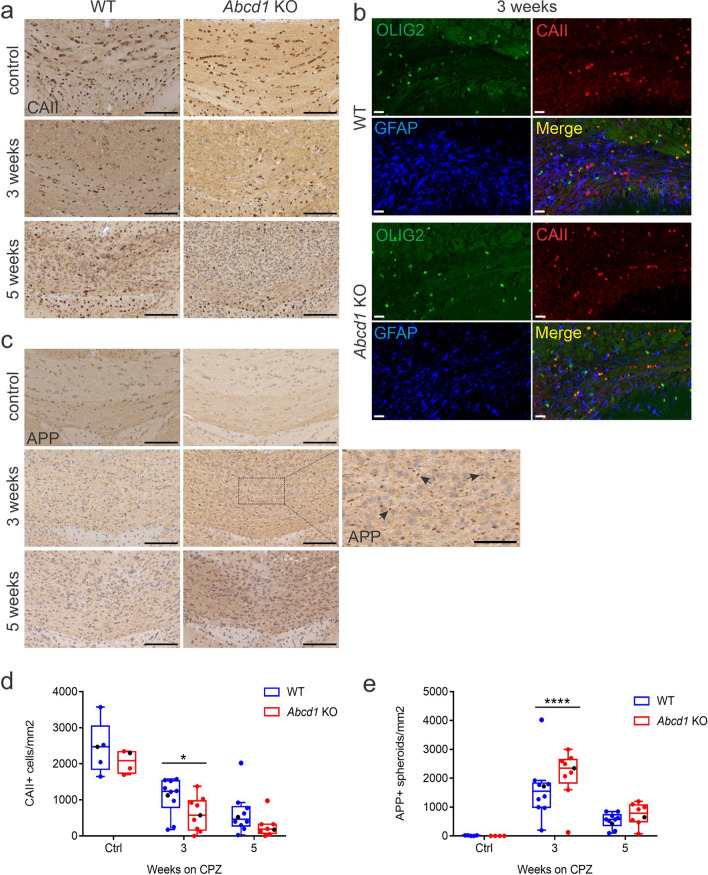
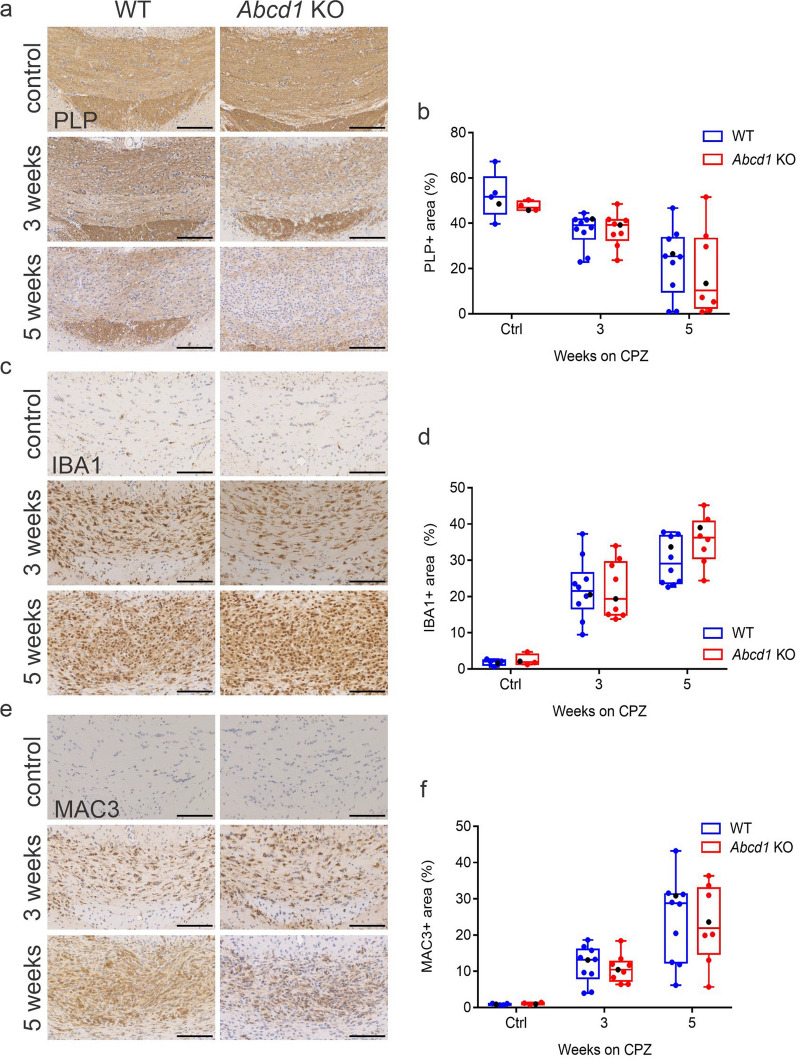
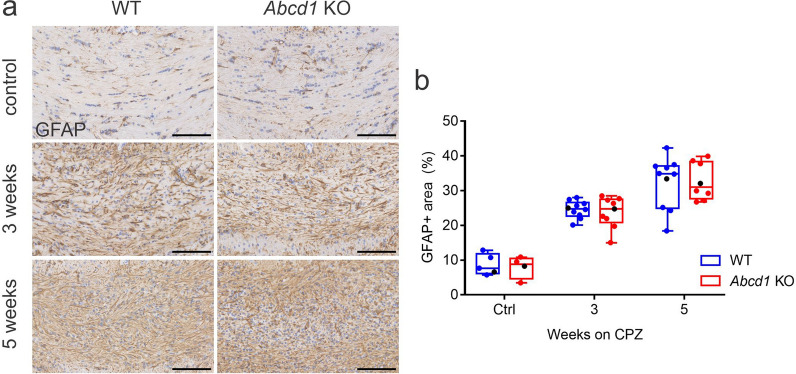
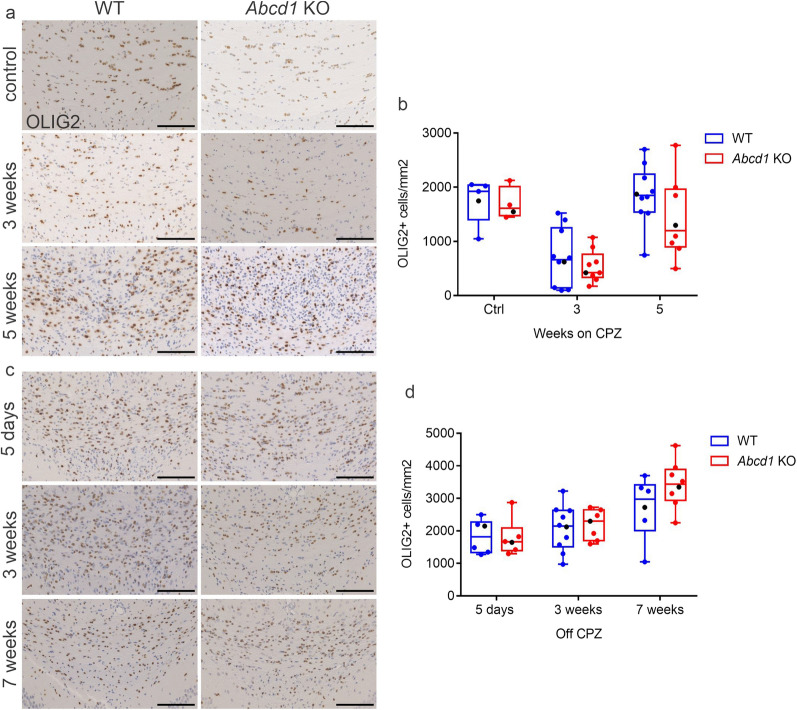
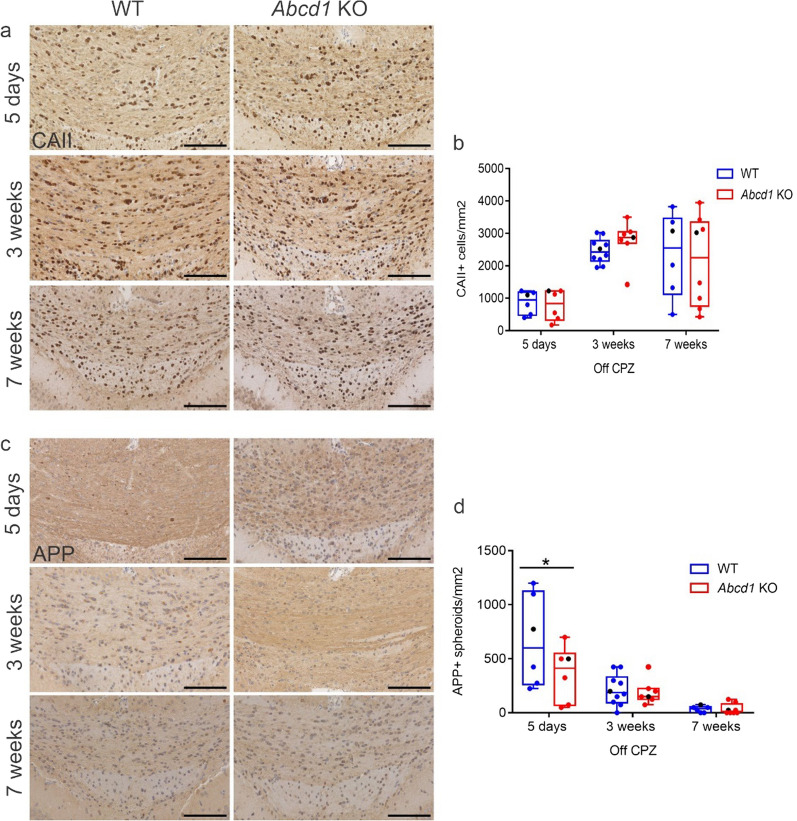
X-linked adrenoleukodystrophy (X-ALD), the most frequent, inherited peroxisomal disease, is caused by mutations in the ABCD1 gene encoding a peroxisomal lipid transporter importing very long-chain fatty acids (VLCFAs) from the cytosol into peroxisomes for degradation via β-oxidation. ABCD1 deficiency results in accumulation of VLCFAs in tissues and body fluids of X-ALD patients with a wide range of phenotypic manifestations. The most severe variant, cerebral X-ALD (CALD) is characterized by progressive inflammation, loss of the myelin-producing oligodendrocytes and demyelination of the cerebral white matter. Whether the oligodendrocyte loss and demyelination in CALD are caused by a primary cell autonomous defect or injury to oligodendrocytes or by a secondary effect of the inflammatory reaction remains unresolved. To address the role of X-ALD oligodendrocytes in demyelinating pathophysiology, we combined the Abcd1 deficient X-ALD mouse model, in which VLCFAs accumulate without spontaneous demyelination, with the cuprizone model of toxic demyelination. In mice, the copper chelator cuprizone induces reproducible demyelination in the corpus callosum, followed by remyelination upon cuprizone removal. By immunohistochemical analyses of oligodendrocytes, myelin, axonal damage and microglia activation during de-and remyelination, we found that the mature oligodendrocytes of Abcd1 KO mice are more susceptible to cuprizone-induced cell death compared to WT mice in the early demyelinating phase. Furthermore, this effect was mirrored by a greater extent of acute axonal damage during demyelination in the KO mice. Abcd1 deficiency did not affect the function of microglia in either phase of the treatment. Also, the proliferation and differentiation of oligodendrocyte precursor cells and remyelination progressed at similar rates in both genotypes. Taken together, our findings point to an effect of Abcd1 deficiency on mature oligodendrocytes and the oligodendrocyte-axon unit, leading to increased vulnerability in the context of a demyelinating insult.

Keywords: Abcd1 KO; Axonopathy; Cuprizone; Demyelination; Microglia; Oligodendrocytes; Peroxisome; X-ALD.


Conflict of interest statement

The authors have no competing interests to declare.

Figures

Fig. 1
Fig. 1
Timeline of the cuprizone administration and myelination state in Abcd1 KO and WT mice. (a) Schematic depicting the cuprizone-feeding paradigm used in the study, along with the corresponding time points for analysis. (b) Evaluation of the extent of demyelination and remyelination in the corpus callosum based on LFB/PAS myelin staining (subjective score: 0, complete myelination; 3, complete demyelination). The graph shows group means ± SEM (controls: n = 5 WT, 4 Abcd1 KO; treatment time points: n = 6–10 WT, 6–9 Abcd1 KO mice). The individual values are displayed in Additional file 2:  Fig. S2b
Fig. 2
Fig. 2
Accelerated oligodendrocyte loss and axonopathy in cuprizone-intoxicated Abcd1 KO mice. (a) Representative images of CAII immunohistochemistry showing mature oligodendrocytes at control, 3 and 5 weeks cuprizone (CPZ) treatment in the medial corpus callosum of WT and Abcd1 KO mice. Scale bar: 100 µm. (b) Confocal triple staining showing mature oligodendrocytes (CAII, red), all cells of the oligodendrocytic lineage (Olig2, green) and astrocytes (GFAP, blue) at 3 weeks CPZ, WT and Abcd1 KO mice (scale bar: 20 µm). (c) Micrographs showing APP+ axonal spheroids revealing acute axonal damage as described in (a). Scale bar: 100 µm. Magnified view of the 3 weeks CPZ, Abcd1 KO; scale bar: 50 µm. (d, e) Quantifications of the number of CAII+ cells and APP+ spheroids are shown as box plots according to Tukey with dot plot overlays, medians and 1.5 IQR error bars. The data points represented in the micrographs are color-coded in black. Grubbs outlier test detected two outliers at 3 weeks CPZ for APP and two at 5 weeks CPZ for CAII, shown in the graphs, but excluded from the subsequent statistical analysis. Statistics: One-way ANOVA with Sidak’s multiple comparisons test. Controls: n = 5 WT, 4 Abcd1 KO; 3 weeks CPZ: n = 10 WT, 9 Abcd1 KO; 5 weeks CPZ: n = 10 WT, 8 Abcd1 KO. Adjusted p-value: *p = 0.0226; ****p < 0.0001)
Fig. 3
Fig. 3
WT and Abcd1 KO mice show similar dynamics of myelin loss and microglia activation during cuprizone-induced demyelination. (af) Representative images of the medial corpus callosum of WT and Abcd1 KO mice showing immunohistochemistry for the myelin protein PLP (a), total (IBA1+) microglia (c) and activated (MAC3+) microglia (e) and quantification at baseline, 3 weeks and 5 weeks of cuprizone treatment. Scale bar: 100 µm. Quantification of the PLP+ (b), IBA1+ (d) and MAC3+ (f) staining is displayed as % of total area analyzed. The data are shown as box plots according to Tukey with dot plot overlays, medians and 1.5 IQR error bars. The data points represented in the micrographs are color-coded in black. Statistical analysis: One-way ANOVA with Sidak’s multiple comparisons test. Controls: n = 5 WT, 4 Abcd1 KO; 3 weeks CPZ: n = 10 WT, 9 Abcd1 KO; 5 weeks CPZ: n = 10 WT, 8 Abcd1 KO
Fig. 4
Fig. 4
WT and Abcd1 KO mice show similar extent of astrocyte activation during cuprizone-induced demyelination. (a) Representative immunohistochemistry images for GFAP in the medial corpus callosum of WT and Abcd1 KO mice at baseline, 3 weeks and 5 weeks of cuprizone treatment. Scale bar: 100 µm. (b) Quantification of GFAP staining is displayed as % of the total area analyzed. The data are depicted as box plots according to Tukey with dot plot overlays, medians and 1.5 IQR error bars. The data points represented in the micrographs are colod-coded in black. Statistical analysis: One-way ANOVA with Sidak’s multiple comparisons test. Controls: n = 5 WT, 4 Abcd1 KO; 3 weeks CPZ: n = 10 WT, 9 Abcd1 KO; 5 weeks CPZ: n = 10 WT, 8 Abcd1 KO
Fig. 5
Fig. 5
Abcd1 KO OPCs proliferate normally in response to cuprizone intoxication. (ad) Representative images of immunohistochemistry for OLIG2 in the corpus callosum of WT and Abcd1 KO mice before, during (a) and after (c) dietary cuprizone administration showing all cells of the oligodendrocyte lineage. Scale bar: 100 µm. Quantifications of OLIG2+ cell density (cells/mm2) in the demyelination (b) and remyelination (d) stages are depicted as box plots according to Tukey with dot plot overlays, medians and 1.5 IQR error bars. The data points represented in the micrographs are color-coded in black. Statistical analysis: One-way ANOVA with Sidak’s multiple comparisons test (n = 5–10 WT, 4–10 Abcd1 KO mice)
Fig. 6
Fig. 6
Mature oligodendrocyte numbers increase to a similar extent in WT and Abcd1 KO mice upon cuprizone withdrawal. (a) Representative images of immunohistochemistry for in the corpus callosum of WT and Abcd1 KO mice during recovery from 5 weeks cuprizone intoxication show mature (CAII+) oligodendrocytes (a) and of APP+ spheroids marking acute axonal damage (c). Scale bar: 100 µm. (b), (d) Quantifications of (a) and (c), respectively. Statistical analysis: One-way ANOVA with Sidak’s multiple comparisons test (n = 6–10 WT; 6–8 Abcd1 KO mice). For APP 5 days off CPZ, adjusted p-value: *p = 0.0353
Fig. 7
Fig. 7
Attenuation of microglial response and myelin renewal are not impaired in Abcd1 KO mice. Representative images of the corpus callosum of WT and Abcd1 KO mice after cuprizone withdrawal showing immunohistochemical detection and quantification of (a, b) PLP+ myelin, (c, d) total (IBA1+) microglia and (e, f) activated (MAC3+) microglia at 5 days, 3 weeks and 7 weeks post cuprizone (CPZ). Scale bar: 100 µm. Two outliers detected by the Grubbs outlier test at 3 weeks off CPZ (one each from the PLP WT and MAC3 WT groups) are shown in the graphs but were excluded from the statistics. Statistical analysis: One-way ANOVA with Sidak’s multiple comparisons test (n = 6–10 WT; 6–8 Abcd1 KO mice). For MAC3 5 days off CPZ, adjusted p-value: *p = 0.0366

Similar articles

Cited by

References

    1. Moser AB, et al. Newborn screening for X-linked adrenoleukodystrophy. Int J Neonatal Screen. 2016;2(4):1. doi: 10.3390/ijns2040015. - DOI - PMC - PubMed
    1. Mosser J, et al. Putative X-linked adrenoleukodystrophy gene shares unexpected homology with ABC transporters. Nature. 1993;361(6414):726–730. doi: 10.1038/361726a0. - DOI - PubMed
    1. Mosser J, et al. The gene responsible for adrenoleukodystrophy encodes a peroxisomal membrane protein. Hum Mol Genet. 1994;3(2):265–271. doi: 10.1093/hmg/3.2.265. - DOI - PubMed
    1. Wiesinger C, et al. Impaired very long-chain acyl-CoA beta-oxidation in human X-linked adrenoleukodystrophy fibroblasts is a direct consequence of ABCD1 transporter dysfunction. J Biol Chem. 2013;288(26):19269–19279. doi: 10.1074/jbc.M112.445445. - DOI - PMC - PubMed
    1. Moser HW. Adrenoleukodystrophy: phenotype, genetics, pathogenesis and therapy. Brain. 1997;120(Pt 8):1485–1508. doi: 10.1093/brain/120.8.1485. - DOI - PubMed

Publication types

MeSH terms

Substances