

Integrating host transcriptomic signatures for distinguishing autoimmune encephalitis in cerebrospinal fluid by metagenomic sequencing
- PMID: 37332019
- PMCID: PMC10278324
- DOI: 10.1186/s13578-023-01047-x
Integrating host transcriptomic signatures for distinguishing autoimmune encephalitis in cerebrospinal fluid by metagenomic sequencing
Abstract
Background: The early accurate diagnoses for autoimmune encephalitis (AE) and infectious encephalitis (IE) are essential since the treatments for them are different. This study aims to discover some specific and sensitive biomarkers to distinguish AE from IE at early stage to give specific treatments for good outcomes.
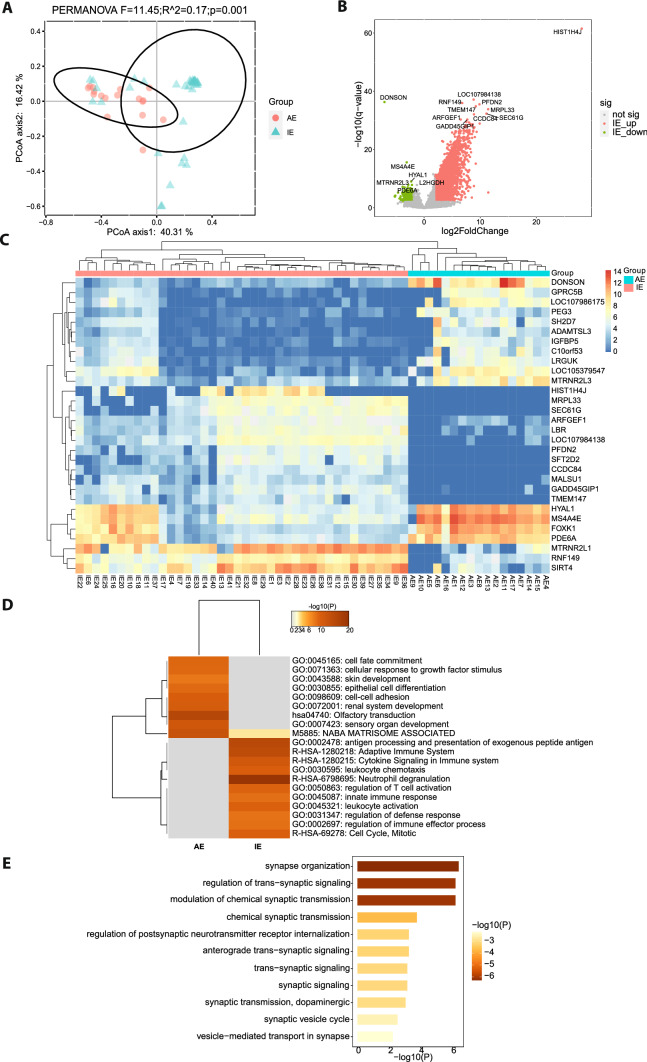
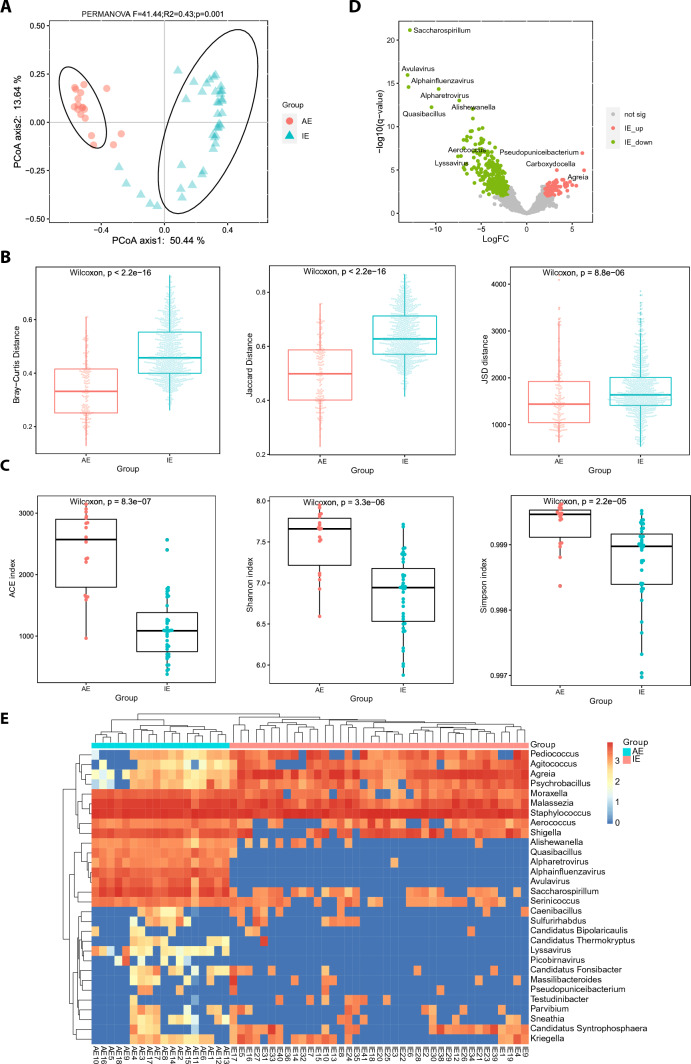
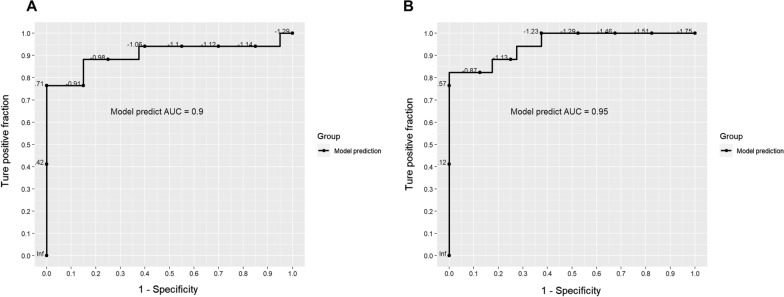
Results: We compared the host gene expression profiles and microbial diversities of cerebrospinal fluid (CSF) from 41 patients with IE and 18 patients with AE through meta-transcriptomic sequencing. Significant differences were found in host gene expression profiles and microbial diversities in CSF between patients with AE and patients with IE. The most significantly upregulated genes in patients with IE were enriched in pathways related with immune response such as neutrophil degranulation, antigen processing and presentation and adaptive immune system. In contrast, those upregulated genes in patients with AE were mainly involved in sensory organ development such as olfactory transduction, as well as synaptic transmission and signaling. Based on the differentially expressed genes, a classifier consisting of 5 host genes showed outstanding performance with an area under the receiver operating characteristic (ROC) curve (AUC) of 0.95.
Conclusions: This study provides a promising classifier and is the first to investigate transcriptomic signatures for differentiating AE from IE by using meta-transcriptomic next-generation sequencing technology.
Keywords: Autoimmune encephalitis; Cerebrospinal fluid; Infectious encephalitis; Next-generation sequencing (NGS); Transcriptomic signatures.
© 2023. The Author(s).
Conflict of interest statement
The authors declare that they have no competing interests.
Figures
Similar articles
-
Comparisons Between Infectious and Autoimmune Encephalitis: Clinical Signs, Biochemistry, Blood Counts, and Imaging Findings.Neuropsychiatr Dis Treat. 2020 Nov 4;16:2649-2660. doi: 10.2147/NDT.S274487. eCollection 2020. Neuropsychiatr Dis Treat. 2020. PMID: 33177828 Free PMC article.
-
Construction of an Assisted Model Based on Natural Language Processing for Automatic Early Diagnosis of Autoimmune Encephalitis.Neurol Ther. 2022 Sep;11(3):1117-1134. doi: 10.1007/s40120-022-00355-7. Epub 2022 May 11. Neurol Ther. 2022. PMID: 35543808 Free PMC article.
-
Phosphatidylcholine PC ae C44:6 in cerebrospinal fluid is a sensitive biomarker for bacterial meningitis.J Transl Med. 2020 Jan 7;18(1):9. doi: 10.1186/s12967-019-02179-w. J Transl Med. 2020. PMID: 31910875 Free PMC article.
-
Advances in Potential Cerebrospinal Fluid Biomarkers for Autoimmune Encephalitis: A Review.Front Neurol. 2022 Jul 22;13:746653. doi: 10.3389/fneur.2022.746653. eCollection 2022. Front Neurol. 2022. PMID: 35937071 Free PMC article. Review.
-
Diagnostic accuracy of the metagenomic next-generation sequencing (mNGS) for detection of bacterial meningoencephalitis: a systematic review and meta-analysis.Eur J Clin Microbiol Infect Dis. 2022 Jun;41(6):881-891. doi: 10.1007/s10096-022-04445-0. Epub 2022 Apr 26. Eur J Clin Microbiol Infect Dis. 2022. PMID: 35474146
Cited by
-
Stacking ensemble learning models diagnose pulmonary infections using host transcriptome data from metatranscriptomics.Sci Rep. 2025 Aug 20;15(1):30516. doi: 10.1038/s41598-025-15914-9. Sci Rep. 2025. PMID: 40835893 Free PMC article.
References
Grants and funding
LinkOut - more resources
Full Text Sources
