
brainlife.io: A decentralized and open source cloud platform to support neuroscience research

Soichi Hayashi et al. ArXiv. .

Update in

  • brainlife.io: a decentralized and open-source cloud platform to support neuroscience research.
    Hayashi S, Caron BA, Heinsfeld AS, Vinci-Booher S, McPherson B, Bullock DN, Bertò G, Niso G, Hanekamp S, Levitas D, Ray K, MacKenzie A, Avesani P, Kitchell L, Leong JK, Nascimento-Silva F, Koudoro S, Willis H, Jolly JK, Pisner D, Zuidema TR, Kurzawski JW, Mikellidou K, Bussalb A, Chaumon M, George N, Rorden C, Victory C, Bhatia D, Aydogan DB, Yeh FF, Delogu F, Guaje J, Veraart J, Fischer J, Faskowitz J, Fabrega R, Hunt D, McKee S, Brown ST, Heyman S, Iacovella V, Mejia AF, Marinazzo D, Craddock RC, Olivetti E, Hanson JL, Garyfallidis E, Stanzione D, Carson J, Henschel R, Hancock DY, Stewart CA, Schnyer D, Eke DO, Poldrack RA, Bollmann S, Stewart A, Bridge H, Sani I, Freiwald WA, Puce A, Port NL, Pestilli F. Hayashi S, et al. Nat Methods. 2024 May;21(5):809-813. doi: 10.1038/s41592-024-02237-2. Epub 2024 Apr 11. Nat Methods. 2024. PMID: 38605111 Free PMC article.

Abstract

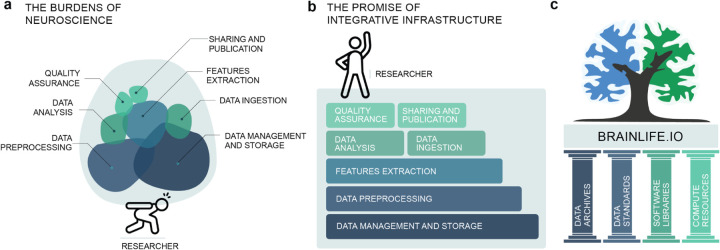
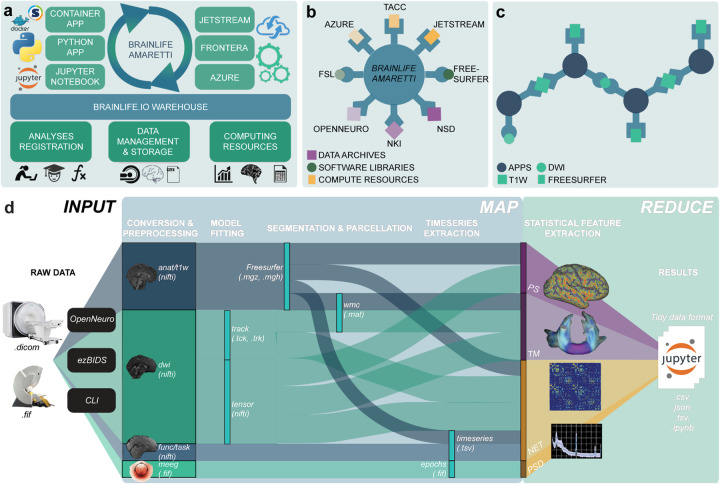
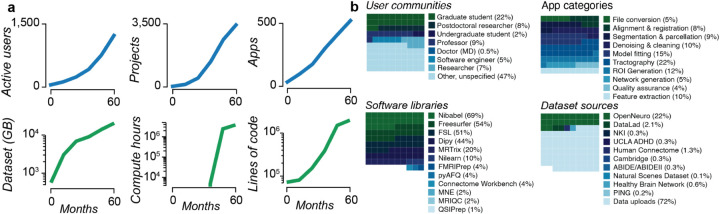
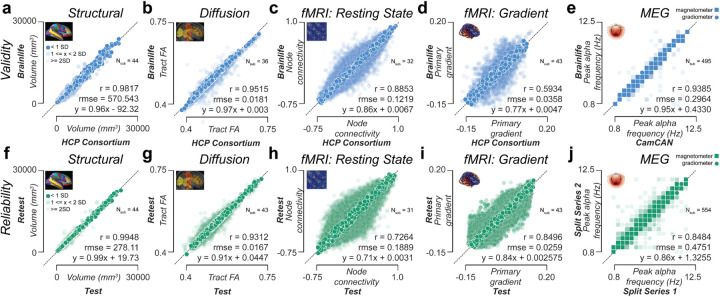
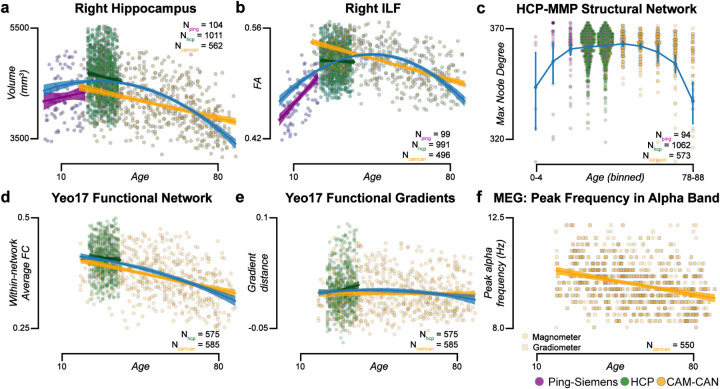
Neuroscience research has expanded dramatically over the past 30 years by advancing standardization and tool development to support rigor and transparency. Consequently, the complexity of the data pipeline has also increased, hindering access to FAIR data analysis to portions of the worldwide research community. brainlife.io was developed to reduce these burdens and democratize modern neuroscience research across institutions and career levels. Using community software and hardware infrastructure, the platform provides open-source data standardization, management, visualization, and processing and simplifies the data pipeline. brainlife.io automatically tracks the provenance history of thousands of data objects, supporting simplicity, efficiency, and transparency in neuroscience research. Here brainlife.io's technology and data services are described and evaluated for validity, reliability, reproducibility, replicability, and scientific utility. Using data from 4 modalities and 3,200 participants, we demonstrate that brainlife.io's services produce outputs that adhere to best practices in modern neuroscience research.


Conflict of interest statement

Competing interests. The authors declare no competing financial interests.

Figures

Figure 1.
Figure 1.. The burdens of neuroscience.
a. A figurative representation of the current major burdens of performing neuroimaging investigations. b. Our proposal for integrative infrastructure that coordinates services required to perform FAIR, reproducible, rigorous, and transparent neuroimaging research thereby lifting the burden from the researcher. c. brainlife.io rests upon the foundational pillars of the open science community such as data archives, standards, software libraries and compute resources. Panels a and b adapted from Eke et al. (2021).
Figure 2.
Figure 2.. The brainlife.io platform concepts, architecture, and approach.
a. brainlife.io’s Amaretti links data archives, software libraries, and computing resources. Specifically, ‘Apps’ (containerized services defined on GitHub.com) are automatically matched with data stored in the ‘Warehouse’ with computing resources. Statistical analyses can be implemented using Jupyter Notebooks. b. brainlife.io provides efficient docking between data archives, processing apps, and compute resources via a centralized service. c. Apps use standardized Datatypes and allow “smart docking” only with compatible data objects. App outputs can be docked by other Apps for further processing. d. brainlife.io’s Map step takes MRI, MEG and EEG data and processes them to extract statistical features of interest. brainlife.io’s reduce step takes the extracted features and serves them to Jupyter Notebooks for statistical analysis. PS: parc-stats Datatype; TM: tractmeasures Datatype; NET: network Datatype; PSD: power-spectrum density Datatype. CLI: Common Line Interface.
Figure 3.
Figure 3.. brainlife.io impact (2018–2022).
a. Top left. Number of users submitting more than 10 jobs per month. Top middle. Number of projects over time. Top right. Number of Apps over time. Bottom left. Data storage across all Projects. Bottom middle. Compute hours across all Projects (data only available 6 months post project start). Bottom right. Lines of code in the top 50 most-used Apps. b. Top left. User communities. Top right. App categories. Bottom left. Percent of total jobs launched with the software library installed (percentage for jobs of top 50 most-used Apps). Bottom right. Datasets sources. See also Fig. S2c for a world-wide distribution of the researchers that have accessed brainlife.io.
Figure 4.
Figure 4.. Data processing validity and reliability analysis.
Top row: Validity measures derived using the HCP Test-Retest data. Each dot corresponds to the ratio for a given subject between data preprocessed and provided by the HCP Consortium vs data preprocessed on brainlife.io in a given measure for a given structure. Pearson’s correlation (r), root mean squared error (rmse), and a linear fit between the test and retest results were calculated. a. Parcel volume (mm3). b. Tract-average fractional anisotropy (FA). c*. Node-wise functional connectivity (FC). d*. Primary gradient value derived from resting-state fMRI. e. Peak frequency (Hz) in the alpha band derived from MEG. Data from magnetometer sensors are represented as squares, and data from gradiometer sensors are represented as circles. Bottom row: Test-retest reliability measures derived from derivatives of the HCPTR dataset generated using brainlife.io. Each dot corresponds to the ratio between a test-retest subject and a given measure for a given structure. Pearson’s correlation (r), root mean squared error (rmse), and a linear fit between the test and retest results were calculated. f. Parcel volume (mm3). g. Tract-average fractional anisotropy (FA). h*. Node-wise functional connectivity (FC). i*. Primary gradient value derived from resting-state fMRI. j. Peak frequency (Hz) in the alpha band derived from MEG using the Cambridge (Cam-CAN) dataset. Data from magnetometer sensors are represented as squares, and data from gradiometer sensors are represented as circles. Dark colors represent data within +/−1 standard deviation (SD. 50% opacity represents data within 1–2 SD. 25% opacity represents data outside 2 SD. *A representative 5% of data presented in c, d, h, i.
Figure 5.
Figure 5.. Lifelong brain maturation estimated across datasets.
Relationship between subject age and a. Right hippocampal volume, b. Right inferior longitudinal fasciculus (ILF) fractional anisotropy (FA), c*. maximum node degree of density network derived using the hcp-mmp atlas, d*. Within-network average functional connectivity (FC) derived using the Yeo17 atlas, e. Functional gradient distance for visual resting state network derived from the Yeo17 atlas, and f. Peak frequency in the alpha band derived from magnetometer (squares) and gradiometers (circles) from MEG data. These analyses include subjects from the PING (purple), HCP1200 (green), and Cam-CAN (yellow) datasets. Linear regressions were fit to each dataset, and a quadratic regression was fit to the entire dataset (blue). * All points in c, and d are presented. See also Fig. S5 and Supplemental platform utility for scientific applications.
Figure 6.
Figure 6.. Replication of previous studies using brainlife.io.
a. Average cortical hcp-mmp parcel thickness (Nstruc = 322) compared to parcel orientation dispersion index (ODI) from the NODDI model mapped to the cortical surface (inset) of the HCP S1200 dataset (Nsub = 1,043) and Cam-CAN (Nsub = 492) dataset compared to the parcel-average cortical thickness. b. Stressful life events obtained from Negative Life Events Schedule (NLES) survey from Healthy Brain Network participants (Nsub = 42) compared to Uncinate-average normalized Quantitative Anisotropy (QA). Mean linear regression (blue line) fits and standard deviation (shaded blue). c. Early life stress was obtained from multiple surveys collected from ABCD participants (Nsub = 1,107) compared to Uncinate-average Fractional Anisotropy (FA). Linear regression (green line) fits the data with standard deviation (shaded green).
Figure 7.
Figure 7.. Using brainlife.io to identify and characterize clinical populations from healthy controls.
a. Fractional anisotropy (FA) values were estimated within the superior temporal sulcus (da: dorsal anterior) from 20 healthy athlete controls (gray distribution) and 10 concussed athletes. Average FA, 10% low FA, and the lowest FA value across all concussed athletes were measured (red arrows and dot). b. Retinal OCT images from healthy controls (top row), Stargardt’s disease patients (middle row), and Choroideremia patients (bottom row). From these images, photoreceptor complex thickness was measured for each group (Controls: gray; Choroideremia: green; Stargardt’s: blue) in two distinct areas of the retina: the fovea (eccentricities 0–1 degrees) and the periphery (eccentricities 7–8 degrees). In addition, optic radiations carrying information for each area of the retina were segmented and FA profiles were mapped. Average profiles with standard error (shaded regions) were computed. One Stargardt and one Choroideremia participant were each identified as having FA profiles that deviated from both healthy controls and the opposing retinal disorder.
Figure 8.
Figure 8.. Reference datasets for quality assurance.
Example workflow for building normative reference ranges for multiple derived statistical products (cortical parcel volume, white matter tract profilometry, within-network functional connectivity, and power-spectrum density (PSD)). a. Cortical volumes of the left hippocampus from HCP participants. Red dots indicate outlier data points. b. Average fractional anisotropy (FA) profiles (blue line) plotted with two standard deviations (shaded regions). Red lines indicate outlier profiles. c. Within-network functional connectivity for the nodes within the Default-A network using the Yeo17 atlas. Red dots indicate outlier data points. d. Average PSD from occipital channels using magnetometer sensors from Cam-CAN participants with one standard deviation (shaded regions). Red lines indicate outlier participants. Peak alpha frequency distribution was also computed, and outliers were detected (inset). e. Normative reference distributions for each derived statistical product across the PING (purple), HCP (blue), and Cam-CAN (orange) datasets. These distributions have had outliers removed. An example of the brainlife visualization for reference datasets can be found in Fig. S8.

Similar articles

  • brainlife.io: a decentralized and open-source cloud platform to support neuroscience research.
    Hayashi S, Caron BA, Heinsfeld AS, Vinci-Booher S, McPherson B, Bullock DN, Bertò G, Niso G, Hanekamp S, Levitas D, Ray K, MacKenzie A, Avesani P, Kitchell L, Leong JK, Nascimento-Silva F, Koudoro S, Willis H, Jolly JK, Pisner D, Zuidema TR, Kurzawski JW, Mikellidou K, Bussalb A, Chaumon M, George N, Rorden C, Victory C, Bhatia D, Aydogan DB, Yeh FF, Delogu F, Guaje J, Veraart J, Fischer J, Faskowitz J, Fabrega R, Hunt D, McKee S, Brown ST, Heyman S, Iacovella V, Mejia AF, Marinazzo D, Craddock RC, Olivetti E, Hanson JL, Garyfallidis E, Stanzione D, Carson J, Henschel R, Hancock DY, Stewart CA, Schnyer D, Eke DO, Poldrack RA, Bollmann S, Stewart A, Bridge H, Sani I, Freiwald WA, Puce A, Port NL, Pestilli F. Hayashi S, et al. Nat Methods. 2024 May;21(5):809-813. doi: 10.1038/s41592-024-02237-2. Epub 2024 Apr 11. Nat Methods. 2024. PMID: 38605111 Free PMC article.
  • Author Correction: brainlife.io: a decentralized and open-source cloud platform to support neuroscience research.
    Hayashi S, Caron BA, Heinsfeld AS, Vinci-Booher S, McPherson B, Bullock DN, Bertò G, Niso G, Hanekamp S, Levitas D, Ray K, MacKenzie A, Avesani P, Kitchell L, Leong JK, Nascimento-Silva F, Koudoro S, Willis H, Jolly JK, Pisner D, Zuidema TR, Kurzawski JW, Mikellidou K, Bussalb A, Chaumon M, George N, Rorden C, Victory C, Bhatia D, Aydogan DB, Yeh FF, Delogu F, Guaje J, Veraart J, Fischer J, Faskowitz J, Fabrega R, Hunt D, McKee S, Brown ST, Heyman S, Iacovella V, Mejia AF, Marinazzo D, Craddock RC, Olivetti E, Hanson JL, Garyfallidis E, Stanzione D, Carson J, Henschel R, Hancock DY, Stewart CA, Schnyer D, Eke DO, Poldrack RA, Bollmann S, Stewart A, Bridge H, Sani I, Freiwald WA, Puce A, Port NL, Pestilli F. Hayashi S, et al. Nat Methods. 2024 Jun;21(6):1131. doi: 10.1038/s41592-024-02296-5. Nat Methods. 2024. PMID: 38714873 Free PMC article. No abstract available.
  • In defense of decentralized research data management.
    Hanke M, Pestilli F, Wagner AS, Markiewicz CJ, Poline JB, Halchenko YO. Hanke M, et al. Neuroforum. 2021;27(1):17-25. doi: 10.1515/nf-2020-0037. Epub 2021 Jan 11. Neuroforum. 2021. PMID: 36504549 Free PMC article.
  • A Standards Organization for Open and FAIR Neuroscience: the International Neuroinformatics Coordinating Facility.
    Abrams MB, Bjaalie JG, Das S, Egan GF, Ghosh SS, Goscinski WJ, Grethe JS, Kotaleski JH, Ho ETW, Kennedy DN, Lanyon LJ, Leergaard TB, Mayberg HS, Milanesi L, Mouček R, Poline JB, Roy PK, Strother SC, Tang TB, Tiesinga P, Wachtler T, Wójcik DK, Martone ME. Abrams MB, et al. Neuroinformatics. 2022 Jan;20(1):25-36. doi: 10.1007/s12021-020-09509-0. Epub 2021 Jan 27. Neuroinformatics. 2022. PMID: 33506383 Free PMC article. Review.
  • INSPIRE datahub: a pan-African integrated suite of services for harmonising longitudinal population health data using OHDSI tools.
    Bhattacharjee T, Kiwuwa-Muyingo S, Kanjala C, Maoyi ML, Amadi D, Ochola M, Kadengye D, Gregory A, Kiragga A, Taylor A, Greenfield J, Slaymaker E, Todd J; INSPIRE Network. Bhattacharjee T, et al. Front Digit Health. 2024 Jan 29;6:1329630. doi: 10.3389/fdgth.2024.1329630. eCollection 2024. Front Digit Health. 2024. PMID: 38347885 Free PMC article. Review.

References

    1. Poldrack R. A. et al. Scanning the horizon: towards transparent and reproducible neuroimaging research. Nat. Rev. Neurosci. 18, 115–126 (2017). - PMC - PubMed
    1. Birur B., Kraguljac N. V., Shelton R. C. & Lahti A. C. Brain structure, function, and neurochemistry in schizophrenia and bipolar disorder—a systematic review of the magnetic resonance neuroimaging literature. npj Schizophrenia 3, 1–15 (2017). - PMC - PubMed
    1. Pando-Naude V. et al. Gray and white matter morphology in substance use disorders: a neuroimaging systematic review and meta-analysis. Transl. Psychiatry 11, 29 (2021). - PMC - PubMed
    1. Ahmadzadeh M., Christie G. J., Cosco T. D. & Moreno S. Neuroimaging and analytical methods for studying the pathways from mild cognitive impairment to Alzheimer’s disease: protocol for a rapid systematic review. Systematic Reviews vol. 9 Preprint at 10.1186/s13643-020-01332-7 (2020). - DOI - PMC - PubMed
    1. Marek S. et al. Reproducible brain-wide association studies require thousands of individuals. Nature 603,654–660 (2022). - PMC - PubMed

Publication types

LinkOut - more resources