. 2023 Jun 2:10:1168339.
doi: 10.3389/fcvm.2023.1168339. eCollection 2023.

Hypoxia-inducible factor activation promotes osteogenic transition of valve interstitial cells and accelerates aortic valve calcification in a mice model of chronic kidney disease

Affiliations

Hypoxia-inducible factor activation promotes osteogenic transition of valve interstitial cells and accelerates aortic valve calcification in a mice model of chronic kidney disease

Dávid Máté Csiki et al. Front Cardiovasc Med. .

Abstract

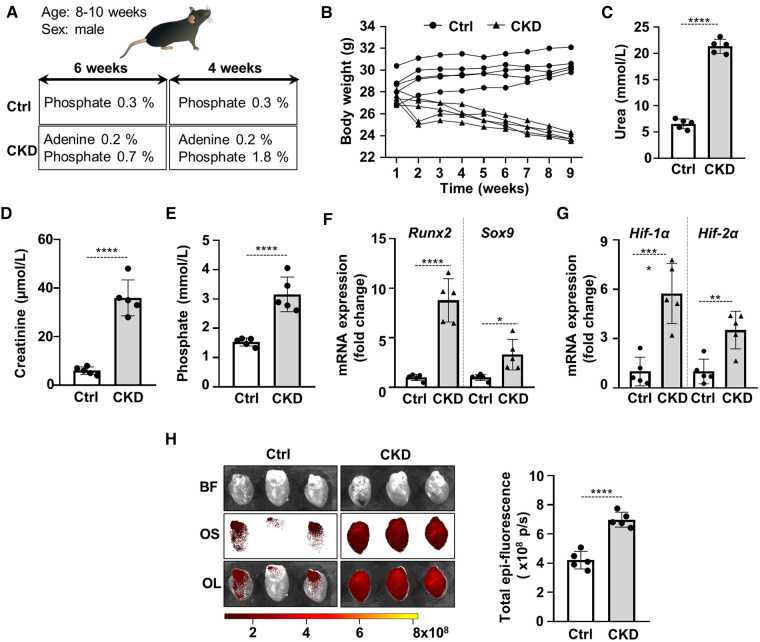
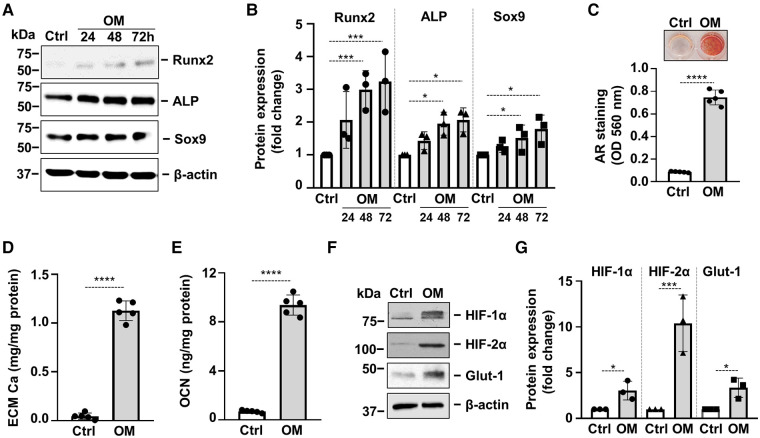
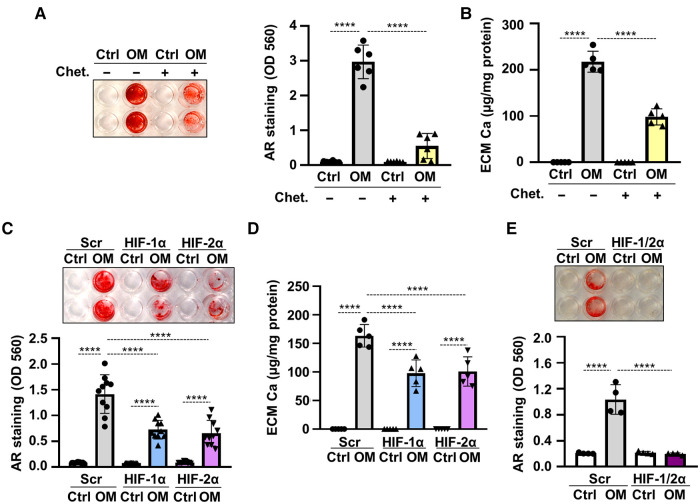
Introduction: Valve calcification (VC) is a widespread complication in chronic kidney disease (CKD) patients. VC is an active process with the involvement of in situ osteogenic transition of valve interstitial cells (VICs). VC is accompanied by the activation of hypoxia inducible factor (HIF) pathway, but the role of HIF activation in the calcification process remains undiscovered.

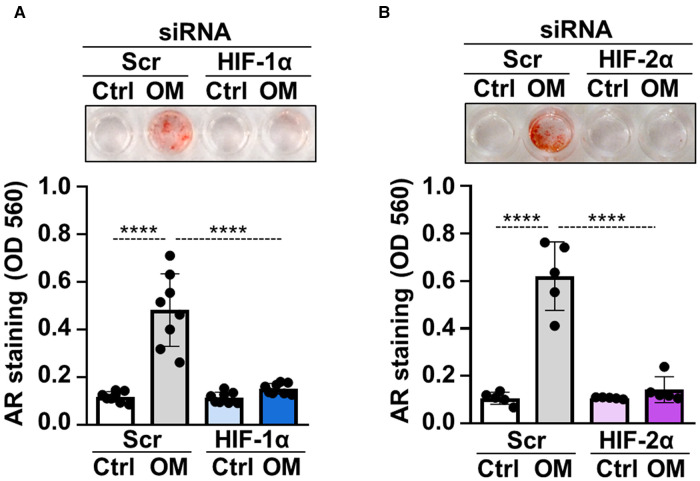
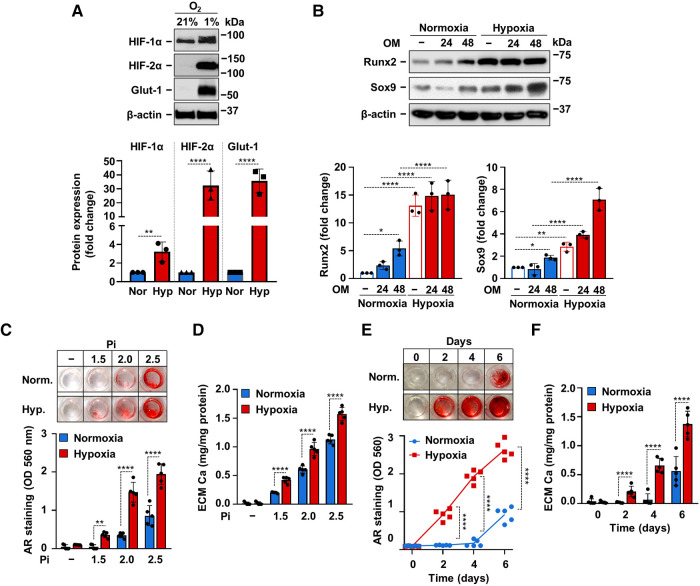
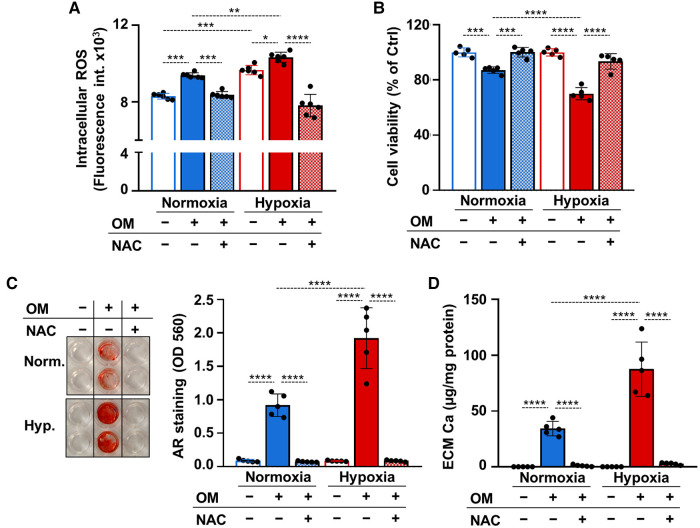
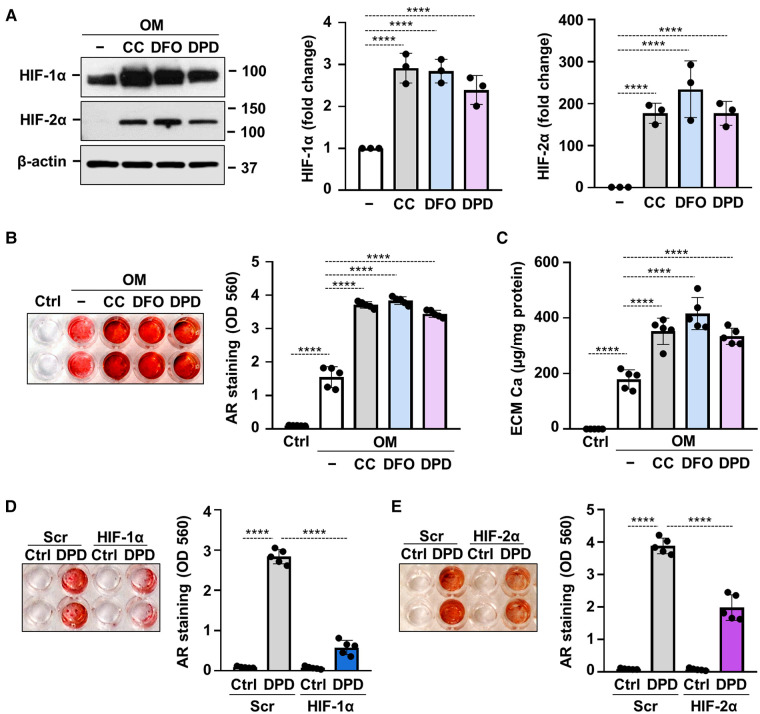
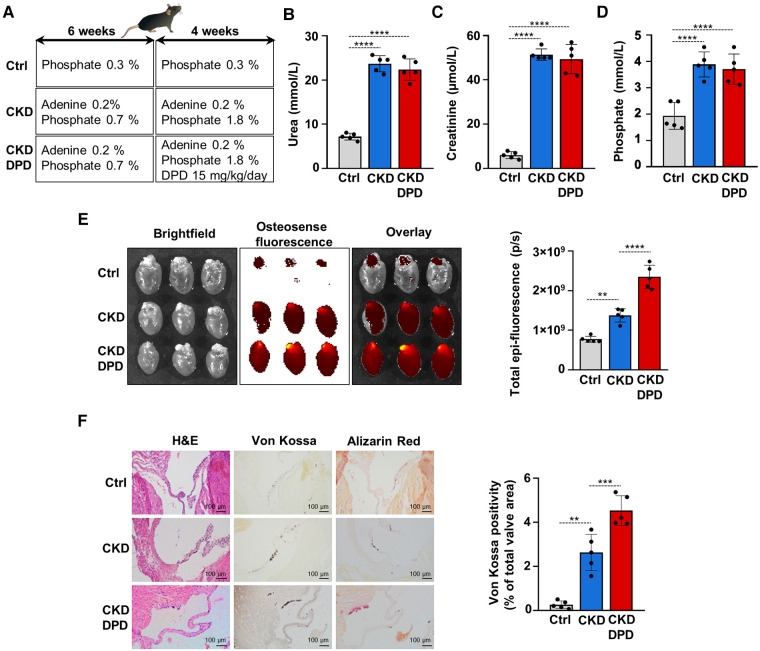
Methods and result: Using in vitro and in vivo approaches we addressed the role of HIF activation in osteogenic transition of VICs and CKD-associated VC. Elevation of osteogenic (Runx2, Sox9) and HIF activation markers (HIF-1α and HIF-2α) and VC occurred in adenine-induced CKD mice. High phosphate (Pi) induced upregulation of osteogenic (Runx2, alkaline-phosphatase, Sox9, osteocalcin) and hypoxia markers (HIF-1α, HIF-2α, Glut-1), and calcification in VICs. Down-regulation of HIF-1α and HIF-2α inhibited, whereas further activation of HIF pathway by hypoxic exposure (1% O2) or hypoxia mimetics [desferrioxamine, CoCl2, Daprodustat (DPD)] promoted Pi-induced calcification of VICs. Pi augmented the formation of reactive oxygen species (ROS) and decreased viability of VICs, whose effects were further exacerbated by hypoxia. N-acetyl cysteine inhibited Pi-induced ROS production, cell death and calcification under both normoxic and hypoxic conditions. DPD treatment corrected anemia but promoted aortic VC in the CKD mice model.

Discussion: HIF activation plays a fundamental role in Pi-induced osteogenic transition of VICs and CKD-induced VC. The cellular mechanism involves stabilization of HIF-1α and HIF-2α, increased ROS production and cell death. Targeting the HIF pathways may thus be investigated as a therapeutic approach to attenuate aortic VC.

Keywords: chronic kidney disease; hypoxia; hypoxia inducible factor; osteogenic differentiation; reactive oxygen species; valve calcification; valve interstitial cell.


Conflict of interest statement

The authors declare that the research was conducted in the absence of any commercial or financial relationships that could be construed as a potential conflict of interest.

Figures

Figure 1
Figure 1
Activation of osteogenic and hypoxia signaling and calcification in the heart of CKD mice. (A) Scheme of the experimental protocol. (B) Body weight, (C) plasma urea, (D) plasma creatinine, (E) plasma phosphate levels in control (Ctrl) and CKD mice (n = 5/group). (F,G) Relative mRNA expressions of Runx2, Sox9, HIF-1α and HIF-1α normalized to HPRT from heart tissue derived from Ctrl and CKD mice (n = 5, measured in triplicates). (H) Bright-field and macroscopic fluorescence reflectance imaging of calcification and quantification in the heart of Ctrl and CKD mice (n = 5/group). Data are expressed as mean ± SD. Ordinary one-way ANOVA followed by Tukey's multiply comparison test was used to calculate p values. *p < 0.05, **p < 0.01, ***p < 0.005, ****p < 0.001.
Figure 2
Figure 2
Osteogenic stimulation induces osteogenic transdifferentiation, calcification and activation of hypoxia signaling in VICs. Confluent VICs were cultured in Ctrl or osteogenic conditions (OM, 2.5 mmol/L excess Pi, 0.3 mmol/L excess Ca over Ctrl). (A,B) Runx2, ALP and Sox9 protein expressions detected by Western Blot from whole cell lysate (24, 48, 72 h). Membranes were re-probed for β-actin. Representative Western blots and densitometry analysis from three independent experiments. (C) Calcium deposition in the ECM (day 5) evaluated by AR staining. Representative image and quantification are depicted from 5 independent experiments. (D) Calcium content of the HCl-solubilized ECM. (E) OCN level of EDTA-solubilized ECM (day 10). (F,G) Protein expression of HIF-1α and HIF-2α in whole cell lysates (24 h). Membranes were re-probed for β-actin. Representative Western blots and relative expression of HIF-1α and HIF-2α normalized to β-actin from 3 independent experiments. (E,G) Representative AR staining (day 4) and quantification. Data are expressed as mean ± SD. Ordinary one-way ANOVA followed by Tukey's multiply comparison test was used to calculate p values. *p < 0.05, **p < 0.01, ***p < 0.005, ****p < 0.001.
Figure 3
Figure 3
HIF pathway is critically involved in osteogenic trans-differentiation of VICs. (A,B) Confluent VICs were cultured in control (Ctrl) or osteogenic conditions (OM, 2.5 mmol/L excess Pi, 0.3 mmol/L excess Ca over Ctrl) in the presence of HIF-1α, HIF-2α or scrambled siRNA. Representative AR staining (day 4) and quantification. Data are expressed as mean ± SD. Ordinary one-way ANOVA followed by Tukey's multiply comparison test was used to calculate p values. ****p < 0.001.
Figure 4
Figure 4
Hypoxia enhances OM-induced calcification of VICs. (A) Confluent VICs were maintained under normoxic (Nor, 21% O2) or hypoxic (Hyp, 1% O2) conditions. (A) HIF-1α, HIF-2α, Glut-1 and β-actin protein expressions detected by Western Blot from whole cell lysate (24 h). Representative Western blots and densitometry analysis from three independent experiments. (B) Confluent VICs under normoxic (21% O2) or hypoxic (1% O2) conditions were exposed to OM (2.5 mmol/L excess Pi, 0.3 mmol/L excess Ca over Ctrl). Runx2 and Sox9 protein expressions detected by Western Blot from whole cell lysate (24, 48 h). Membranes were re-probed for β-actin. Representative Western blots and densitometry analysis from three independent experiments. (C,D) Confluent VICs were exposed to OM with different Pi content (1.5–2.5 mmol/L excess over Ctrl) under normoxic (21% O2) and hypoxic conditions (1% O2). (C) Representative AR staining (day 6) and quantification. (D) Calcium content of the HCl-solubilized ECM (day 6). (E,F) Time course of calcium accumulation under normoxic and hypoxic conditions in the presence of OM. (E) Representative AR staining and quantification. (F) Calcium content of the HCl-solubilized ECM. Data are expressed as mean ± SD. (A-D,F) Ordinary one-way ANOVA followed by Tukey's multiply comparison test was used to obtain p values. (E) Multiply t-tests to compare normoxia and hypoxia samples at each time points were performed to obtain p values. *p < 0.05, **p < 0.01, ****p < 0.001.
Figure 5
Figure 5
Hypoxia enhances OM-induced osteogenic trans-differentiation of VICs through HIF-1 signaling. (A,B) Confluent VICs were maintained in Ctrl or OM (2.5 mmol/L excess Pi, 0.3 mmol/L excess Ca over Ctrl) conditions under hypoxia (1% O2) in the presence or absence of the HIF-1 inhibitor chetomin (Chet, 12 nmol/L). (A) Representative AR staining (day 4) and quantification. (B) Calcium content of the HCl-solubilized ECM (day 4). (C–F) VICs were kept under Ctrl or OM conditions in hypoxia (1% O2) in the presence of HIF-1α, HIF-2α or both, or scrambled siRNA. (C) Representative AR staining (day 4) and quantification. (D) Calcium content of the HCl-solubilized ECM (day 4). (E) Representative AR staining (day 4) and quantification of HIF-1α, HIF-2α double knocked-down cells. Data are expressed as mean ± SD. p values were calculated using one-way ANOVA followed by Tukey's multiply comparison analysis. ****p < 0.001.
Figure 6
Figure 6
ROS regulate calcification of VICs under both normoxia and hypoxia. (A–D) Confluent VICs were maintained under normoxia (21% O2) or hypoxia (1% O2) in Ctrl or OM conditions in the presence or absence of NAC (1 mmol/L). (A) Intracellular ROS production in VICs after a 4-hour exposure. (B) Cell viability assessed by MTT assay after 4 days of exposure. (C) Representative AR staining (day 4) and quantification. (B) Calcium content of the HCl-solubilized ECM (day 4). Data are expressed as mean ± SD. Ordinary one-way ANOVA followed by Tukey's multiply comparison test was used to obtain p values. *p < 0.05, **p < 0.01, ***p < 0.005, ****p < 0.001.
Figure 7
Figure 7
Hypoxia mimetic drugs augment OM-induced calcification of VICs. (A–C) Confluent VICs maintained in OM (2.5 mmol/L excess Pi, 0.3 mmol/L excess Ca) were treated with hypoxia mimetic drugs CoCl2 (CC, 200 µmol/L), desferrioxamine (DFO, 40 µmol/L) and Daprodustat (DPD, 20 µmol/L). (A) Protein expressions of HIF-1α and HIF-2α were detected by Western Blot in whole cell lysates (24 h). Membranes were re-probed for β-actin. Representative Western blots and densitometry analysis from three independent experiments. (B) Representative AR staining (day 5) and quantification. (C) Calcium content of the HCl-solubilized ECM (day 5). (D,E) VICs were kept under Ctrl or OM + DPD conditions in the presence of HIF-1α or HIF-2α or scrambled siRNA. Representative AR staining (day 4) and quantification. Data are expressed as mean ± SD. Ordinary one-way ANOVA followed by Tukey's multiply comparison test was used to obtain p values. *p < 0.05, **p < 0.01, ***p < 0.005, ****p < 0.001.
Figure 8
Figure 8
DPD increases aortic VC in mice with CKD. (A) Scheme of the experimental protocol. (B) Plasma urea, (C) creatinine, (D) phosphate levels (n = 5/group). (E) Bright-field and macroscopic fluorescence reflectance imaging of calcification and quantification in the heart of Ctrl, CKD and CKD + DPD mice (n = 5/group). (F) Histological analysis of heart valves obtained from Ctrl, CKD, and CKD + DPD mice. Representative H&E, von Kossa-stained and alizarin red-stained heart sections and quantification of von Kossa staining. Scalebar: 100 µm. Data are expressed as mean ± SD. Ordinary one-way ANOVA followed by Tukey's multiply comparison test was used to obtain p values. **p < 0.01, ***p < 0.005, ****p < 0.001.

Similar articles

Cited by

References

    1. Ureña-Torres P, D’Marco L, Raggi P, García-Moll X, Brandenburg V, Mazzaferro S, et al. Valvular heart disease and calcification in CKD: more common than appreciated. Nephrol Dial Transplant. (2020) 35:2046–53. 10.1093/NDT/GFZ133 - DOI - PubMed
    1. Marwick TH, Amann K, Bangalore S, Cavalcante JL, Charytan DM, Craig JC, et al. Chronic kidney disease and valvular heart disease: conclusions from a kidney disease: improving global outcomes (KDIGO) controversies conference. Kidney Int. (2019) 96:836–49. 10.1016/J.KINT.2019.06.025 - DOI - PubMed
    1. Kipourou K, O’Driscoll JM, Sharma R. Valvular heart disease in patients with chronic kidney disease. Eur Cardiol. (2022) 17:1–8. 10.15420/ECR.2021.25 - DOI - PMC - PubMed
    1. Bäck M, Michel JB. From organic and inorganic phosphates to valvular and vascular calcifications. Cardiovasc Res. (2021) 117:2016–29. 10.1093/CVR/CVAB038 - DOI - PMC - PubMed
    1. Rattazzi M, Bertacco E, Del Vecchio A, Puato M, Faggin E, Pauletto P. Aortic valve calcification in chronic kidney disease. Nephrol Dial Transplant. (2013) 28:2968–76. 10.1093/NDT/GFT310 - DOI - PubMed