. 2023 May 19;26(6):106901.
doi: 10.1016/j.isci.2023.106901. eCollection 2023 Jun 16.

The septate junction component bark beetle is required for Drosophila intestinal barrier function and homeostasis

Affiliations

The septate junction component bark beetle is required for Drosophila intestinal barrier function and homeostasis

Rachel A Hodge et al. iScience. .

Abstract

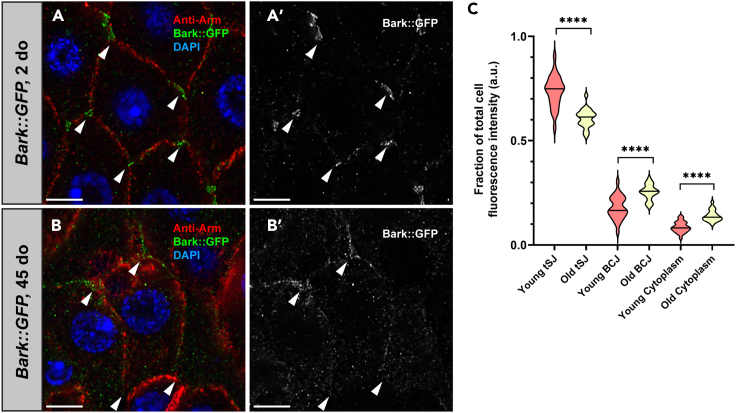
Age-related loss of intestinal barrier function has been documented across species, but the causes remain unknown. The intestinal barrier is maintained by tight junctions (TJs) in mammals and septate junctions (SJs) in insects. Specialized TJs/SJs, called tricellular junctions (TCJs), are located at the nexus of three adjacent cells, and we have shown that aging results in changes to TCJs in intestines of adult Drosophila melanogaster. We now demonstrate that localization of the TCJ protein bark beetle (Bark) decreases in aged flies. Depletion of bark from enterocytes in young flies led to hallmarks of intestinal aging and shortened lifespan, whereas depletion of bark in progenitor cells reduced Notch activity, biasing differentiation toward the secretory lineage. Our data implicate Bark in EC maturation and maintenance of intestinal barrier integrity. Understanding the assembly and maintenance of TCJs to ensure barrier integrity may lead to strategies to improve tissue integrity when function is compromised.

Keywords: Cell biology; Entomology; Molecular biology.


Conflict of interest statement

The authors declare no competing interests.

Figures

None
Graphical abstract
Figure 1
Figure 1
Anakonda/Bark beetle (Bark) localizes to the tricellular septate junction (tSJ) in the adult Drosophila intestine (A–A″) Representative staining for Bark (antisera, red) (Bark::GFP, GFP, green) in the posterior midgut (M) of young (2 do) flies. Pylorus (P) and hindgut (H) to the right. DNA is stained with DAPI (blue). Scale bars, 50 μm. (B–B″) High magnification view of an enterocyte (EC) showing staining of endogenous Bark protein and GFP-tagged Bark at the tSJ (arrowheads). Scale bars, 5 μm. (C–C″) High magnification view of an EC showing GFP-tagged Bark colocalizes with the bicellular septate junction (bSJ) protein Discs large 1 (Dlg1, red) at the tSJ (arrowheads). Scale bars, 5 μm.
Figure 2
Figure 2
Bark is lost from the tSJ in aged flies (A) In young (2 do) flies, Bark localizes to the tSJ (arrowheads) in ECs, whereas it is no longer detected at the tSJ in the aged (45 do) flies. Scale bars, 5 μm. (B and B′) Adherens junctions (Armadillo, Arm, red); Bark (GFP, green); DNA (DAPI, blue). Scale bars, 5 μm. (C) Quantification reveals that Bark is increased at the bicellular septate junction (bSJ) or in the cytoplasm of old flies. 3 cells were analyzed per PMG. young, n = 26; old, n = 22. 3 cells were measured per PMG. Each clearly visible tSJ in the cell was measured. 6 measurements were taken of the BCJ and cytoplasm in each cell, respectively. Quantification of fluorescence intensity ratios for Bark (C) in the bicellular junction (BCJ), tSJ, and cytoplasm. Black lines indicate median; statistical significance determined by Mann-Whitney test. ns, not significant; ∗, p < 0.05; ∗∗, p < 0.001; ∗∗∗∗, p < 0.0001.
Figure 3
Figure 3
Depletion of Gli results in loss of Bark from the tSJ in the adult posterior midgut (A–A″) In young outcrossed fly PMGs, Gli localizes exclusively to the tSJ. Scale bars, 20 μm. (B–B″) EC-specific depletion of Bark protein by 5966GS;bark RNAiGD expression causes mislocalization of Gli to cytoplasmic puncta, indicating Bark is required for Gli localization to the tSJ in the PMG. Genotypes: w; Gli::GFP; bark RNAiGD (control); w; Gli::GFP; 5966GS;bark RNAiGD. All flies are fed RU-486 for 7 days to induce transgene expression. Scale bars, 20 μm. (C–C″) In young outcrossed (7 do) fly PMGs, Bark is localized exclusively to the tSJ. Scale bars, 20 μm. (D–D″) Depletion of Gli expression in ECs of young (7 do) flies leads to loss of Bark from the tSJ and an increase in Bark on the bicellular junction and cytoplasm. Genotypes: w; 5966GS (control); w; Bark::GFP, 5966GS;Gli RNAi. All flies are fed RU-486 for 5 days to induce transgene expression. Bark (GFP, green); Armadillo (Arm, adherens junctions, red); DNA (DAPI, blue). Scale bars, 20 μm. (E) Quantification of mitotic events in the posterior midguts of 5966GS;bark RNAiGD and outcrossed controls. Median ±SEM; statistical significance was determined by Mann-Whitney test. ∗∗∗∗, p < 0.0001. (F) Quantification of mitotic events in the posterior midguts of 5966GS;Gli RNAi and outcrossed controls. Median ±SEM; statistical significance was determined by Mann-Whitney test. ∗∗∗∗, p < 0.0001. (G) Quantification of fluorescence intensity ratios for Bark in the bicellular junction (BCJ), tSJ, and cytoplasm. Black lines indicate median; Statistical significance determined by Mann-Whitney test. ∗∗, p < 0.01.
Figure 4
Figure 4
Bark is required at the tSJ in enterocytes to maintain intestinal homeostasis (A and B) Depletion of Bark in ECs of young (2 do) flies by 5966GS;bark RNAiGD expression for 5 days results in an increase in mitotic activity (n = 54), compared to outcrossed controls (n = 48). Genotypes: (A) w; esg-GFP, 5966GS (B) w; esg-GFP, 5966GS;bark RNAiGD. All flies are fed RU-486 to induce transgene expression. ISCs/EBs (GFP, green); mitotic cells (phosphorylated histone H3, pHH3, red), DNA (DAPI, blue). Scale bars, 20 μm. (C) Quantification of mitotic events. w; esg-GFP, 5966GS;bark RNAiKK flies are also included (n = 42). Error bars represent mean with SEM. Median ±SEM; statistical significance was determined by Mann-Whitney test. ∗∗∗∗, p < 0.0001. (D and E) Intestinal barrier integrity assay shows loss of barrier function upon depletion of Bark (red, n = 301) and (D) statistically significant (∗∗∗∗) shortening of lifespan, when compared to outcrossed controls (blue, n = 299). Genotypes: Red, w; esg-GFP, 5966GS>UAS-bark RNAiGD; blue, w; esg-GFP, 5966GS. ∗, p < 0.05; ∗∗∗, p < 0.001, ∗∗∗∗, p < 0.0001. Statistical significance determined by Fisher’s exact test (barrier integrity assay) and non-parametric log rank Mantel-Cox test (lifespan assay).
Figure 5
Figure 5
EB-specific depletion of bark results in EB accumulation, EE fate plasticity, and increases epithelial permeability (A–B‴) Confocal images of control PMGs (A-A‴) and >bark RNAiKK (B-B‴) in the R5 region after 7 days of tracing. Scale bar 20 μm. (C–D′) Knockdown of bark (D-D′) leads to an increase in the number of proliferating cells (marked by pHH3) as compared to the controls (C-C’). Scale bar 10 μm. (E–H) Quantifications of the number of EBs (E), new ECs (F), and traced EEs (H) on bark knockdown after 7 days of tracing. Depletion of bark induces EB to EE differentiation (insert, GFP/RFP+/anti-Pros+, H) but no significant change in the number of ECs (GFP/RFP+/anti-Dlg1+, F). (Control n = 17, >bark RNAiKK n = 13). Mean ± SD; statistical significance was determined by Mann-Whitney test. ∗∗∗∗, p < 0.001. In addition, bark knockdown increased the number of progenitor cells (GFP+/RFP+, E). Mean ± SD; statistical significance was determined by Mann-Whitney test. ∗∗∗∗, p < 0.001. (G) EC/EB ratio decreases upon bark knockdown. (Control n = 17, >bark RNAiKK n = 13). Mean ± SD; statistical significance was determined by Mann-Whitney test. ∗, p < 0.05. (I) Quantification of the number of mitotic cells on bark depletion after 7 days of tracing. (control n = 11, >bark RNAiKK n = 15). Mean ± SD; statistical significance was determined by Mann-Whitney test. ∗∗, p < 0.01. (J) Survival (in percentage) over time on bark knockdown using kluReDDM. Survival curves were plotted by combining data from >80 flies per one genotype group: Control (blue, n = 89), bark RNAiKK (red, n = 109). bark knockdown in EBs reduces lifespan significantly. Statistical significance determined by non-parametric log rank Mantel-Cox test. ∗∗∗∗, p < 0.0001. (K) Intestinal barrier integrity assay shows loss of barrier function upon depletion of Bark (red, n = 110) when compared to outcrossed controls (blue, n = 81). Statistical significance determined by Fisher’s exact test. (L) kluReDDM (w; UAS-CD8::GFP, tub-GAL80ts; klu-GAL4; UAS-H2B::RFP) tracing. Expression of two fluorophores (CD8::GFP and H2B::RFP) is driven by EB-specific driver klu-GAL4. EBs differentiating to epithelial ECs lose CD8::GFP, while stable H2B::RFP persists. The expression of UAS-driven transgenes is temporally controlled by a ubiquitously expressed temperature-sensitive GAL80ts repressor, which is inactivated by temperature shift to 29°C.
Figure 6
Figure 6
Knockdown of bark in ISCs/EBs results in reduced Notch pathway activation, similar to aging (A–B′) Expression of H2B::RFP is driven by ISC- and EB- driver esg-GAL4. H2B::RFP persists in epithelial ECs differentiated from EBs. Gbe+Su(H)GFP is a readout of Notch activity and a marker of the EB lineage (arrowheads, B-B′) Scale bar, 10 um. (C and D) Quantification of GFP fluorescence intensity and (D) EB nuclear size following 7 days of bark depletion. Knockdown of bark decreases GFP fluorescence intensity (C) and EB nuclear size (GFP+ cells, D) compared to controls (control n = 73, >bark RNAiKK n = 70). Mean ± SD; statistical significance determined by Mann-Whitney test. ∗∗∗∗, p < 0.0001. (E and F) In aged (45 do) flies (F), EB number (GFP+ cells) is higher than in young (2 do) flies (E). (arrowheads, B-B′) Scale bar, 10 um. (G and H) Quantification of GFP fluorescence intensity and (H) EB number following 7 days of bark depletion. Knockdown of bark decreases GFP fluorescence intensity (control n = 27, >bark RNAiKK n = 30) (G) and increases EB number (GFP+ cells, control n = 3, >bark RNAiKK n = 3) compared to controls (H). Mean ± SD; statistical significance determined by Student’s t test. ∗, p < 0.05, ∗∗∗∗, p < 0.0001.

Similar articles

Cited by

References

    1. Marchiando A.M., Graham W.V., Turner J.R. Epithelial barriers in homeostasis and disease. Annu. Rev. Pathol. 2010;5:119–144. - PubMed
    1. Kirkwood T.B.L. Intrinsic ageing of gut epithelial stem cells. Mech. Ageing Dev. 2004;125:911–915. - PubMed
    1. Biteau B., Hochmuth C.E., Jasper H. JNK activity in somatic stem cells causes loss of tissue homeostasis in the aging Drosophila gut. Cell Stem Cell. 2008;3:442–455. - PMC - PubMed
    1. Ren W.y., Wu K.f., Li X., Luo M., Liu H.c., Zhang S.c., Hu Y. Age-related changes in small intestinal mucosa epithelium architecture and epithelial tight junction in rat models. Aging Clin. Exp. Res. 2014;26:183–191. - PubMed
    1. Schiffrin E.J., Morley J.E., Donnet-Hughes A., Guigoz Y. The inflammatory status of the elderly: the intestinal contribution. Mutat. Res. 2010;690:50–56. - PubMed

LinkOut - more resources