. 2023 Jun 2:17:1151309.
doi: 10.3389/fnins.2023.1151309. eCollection 2023.

Post-ischemic reorganization of sensory responses in cerebral cortex

Affiliations

Post-ischemic reorganization of sensory responses in cerebral cortex

P Hayley et al. Front Neurosci. .

Abstract

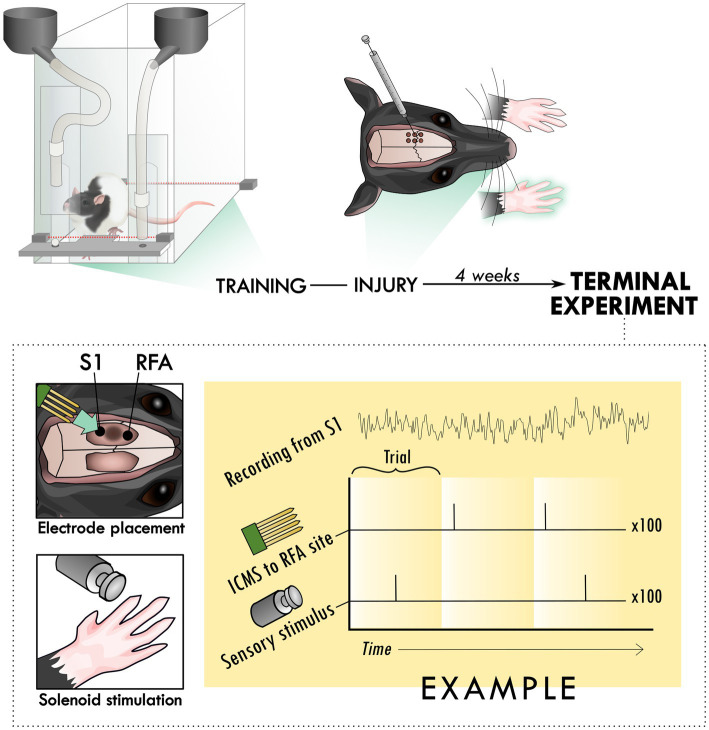
Introduction: Sensorimotor integration is critical for generating skilled, volitional movements. While stroke tends to impact motor function, there are also often associated sensory deficits that contribute to overall behavioral deficits. Because many of the cortico-cortical projections participating in the generation of volitional movement either target or pass-through primary motor cortex (in rats, caudal forelimb area; CFA), any damage to CFA can lead to a subsequent disruption in information flow. As a result, the loss of sensory feedback is thought to contribute to motor dysfunction even when sensory areas are spared from injury. Previous research has suggested that the restoration of sensorimotor integration through reorganization or de novo neuronal connections is important for restoring function. Our goal was to determine if there was crosstalk between sensorimotor cortical areas with recovery from a primary motor cortex injury. First, we investigated if peripheral sensory stimulation would evoke responses in the rostral forelimb area (RFA), a rodent homologue to premotor cortex. We then sought to identify whether intracortical microstimulation-evoked activity in RFA would reciprocally modify the sensory response.

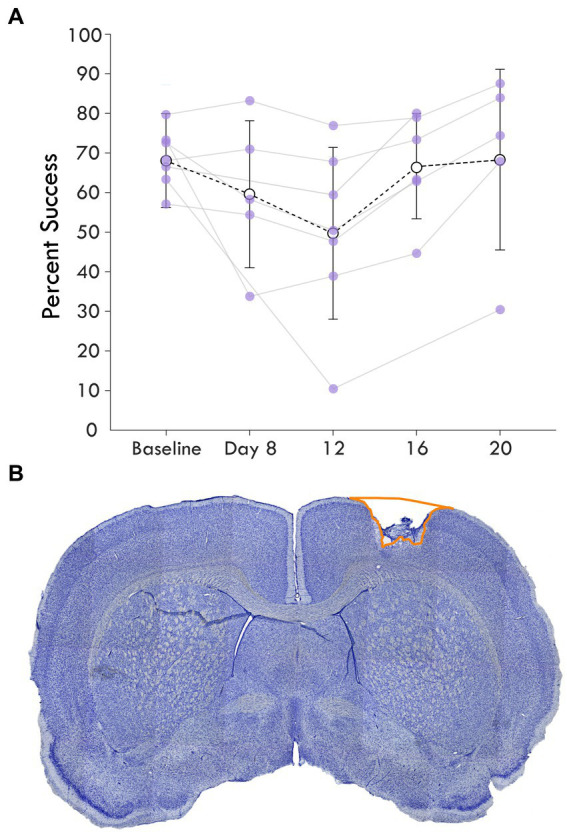
Methods: We used seven rats with an ischemic lesion of CFA. Four weeks after injury, the rats' forepaw was mechanically stimulated under anesthesia and neural activity was recorded in the cortex. In a subset of trials, a small intracortical stimulation pulse was delivered in RFA either individually or paired with peripheral sensory stimulation.

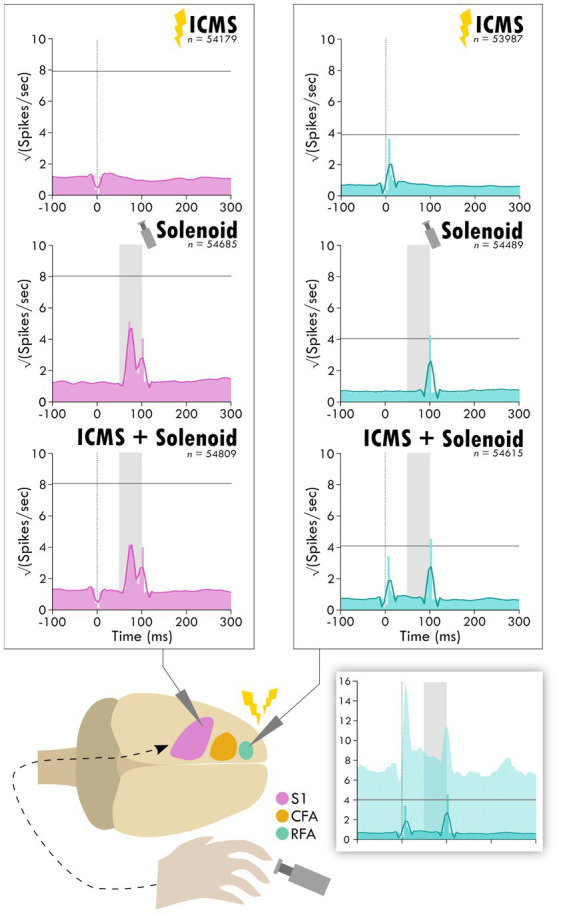
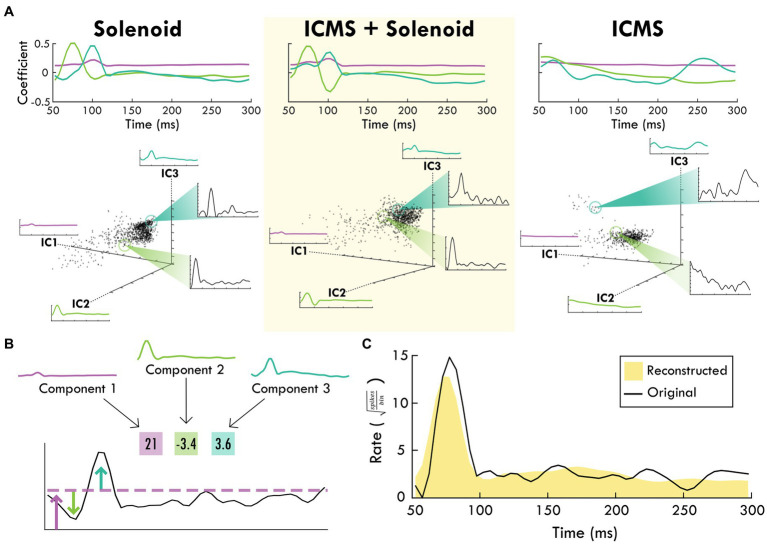
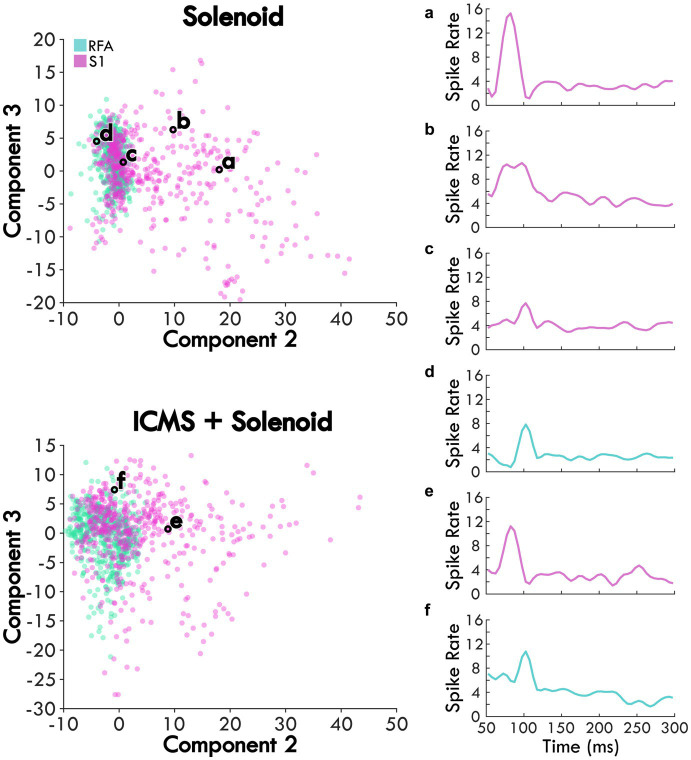
Results: Our results point to post-ischemic connectivity between premotor and sensory cortex that may be related to functional recovery. Premotor recruitment during the sensory response was seen with a peak in spiking within RFA after the peripheral solenoid stimulation despite the damage to CFA. Furthermore, stimulation in RFA modulated and disrupted the sensory response in sensory cortex.

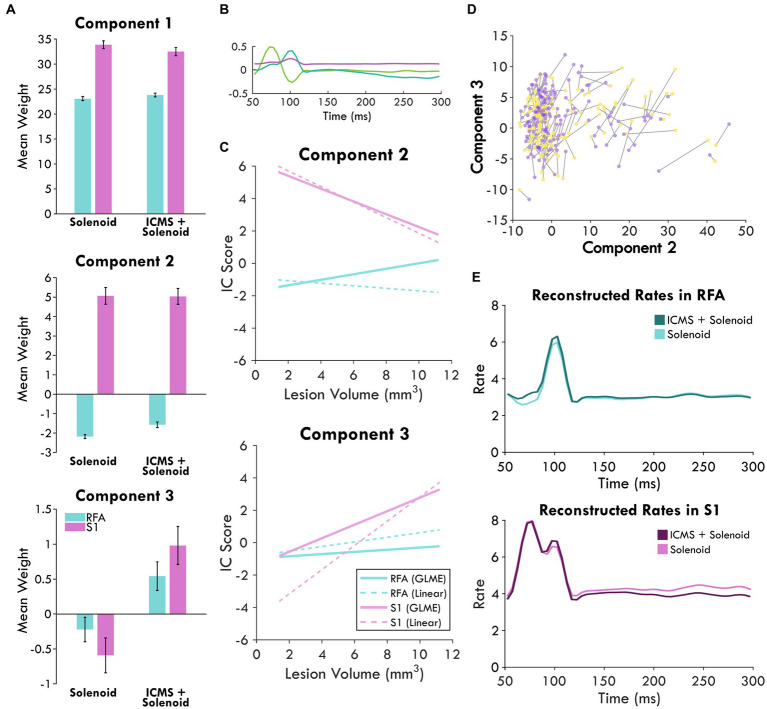
Discussion: The presence of a sensory response in RFA and the sensitivity of S1 to modulation by intracortical stimulation provides additional evidence for functional connectivity between premotor and somatosensory cortex. The strength of the modulatory effect may be related to the extent of the injury and the subsequent reshaping of cortical connections in response to network disruption.

Keywords: activity; cerebral cortex; plasticity; somatosensory; stimulation.


Conflict of interest statement

The authors declare that the research was conducted in the absence of any commercial or financial relationships that could be construed as a potential conflict of interest.

Figures

Figure 1
Figure 1
Experimental set-up and design. Rats were trained to perform the skilled reach task using an automated behavioral box. After training, rats underwent an injury procedure in which 6 burr holes were made over primary motor cortex and used to inject the vasoconstrictor, endothelin-1. The resulting lesion affected the contralateral forelimb as assayed in the skilled reach task. 4 weeks after the injury procedure, a terminal procedure was conducted in which bilateral cranial openings were made to expose cortex. Two microelectrode arrays were placed in putative premotor (RFA) and somatosensory cortex (S1), near the lesion in primary cortex and the solenoid was positioned to deliver peripheral sensory stimulation. Trials were cycled between peripheral stimulation only, intracortical microstimulation (ICMS) only, and the two together at an offset latency while recording from both arrays for 100 repetitions per trial type, constituting an experimental block.
Figure 2
Figure 2
Average single pellet reach task success following cortical lesion. (A) shows the percent success or the percent of successful retrievals out of total attempts made in each assay is shown over the experimental course. The baseline behavioral score averages pre-injury assays while the next timepoints represent assays post-injury. Each rat’s success is plotted as a point and shown with the mean and standard deviation at the timepoint for each assay. (B) highlights a coronal section of a brain stained with cresyl violet showing an example cortical lesion.
Figure 3
Figure 3
Average response in spiking activity to stimulation type in sensory and premotor cortex. The schematic at the bottom shows the cortical areas and the respective recorded activity during each of the three trial types: ICMS, Solenoid, and ICMS + Solenoid. Each peri-event time histogram shows the averaged spike rate for a trial type in each respective cortical area. The lighter shaded bins show the mean spiking at each time point while the overlaying dark line is the smoothed mean. The horizontal gray line is three standard deviations above the average pre-stimulus activity. The vertical dotted line shows where ICMS delivery occurs; spikes 4 ms around any artifact, as occurs with ICMS delivery, were removed from consideration resulting in a blanking period. The shaded gray area shows the extent of solenoid action from the trigger to its retraction time. The shaded inset on the bottom shows the PETH plot of ICMS + Solenoid trials in RFA with the 95% confidence interval of the smoothed mean shown as a lighter background.
Figure 4
Figure 4
The top-3 independent components of the spiking response of each trial type. (A) shows each stimulation type and the corresponding independent components over the trial time. Positive coefficients are correlated with spiking activity while negative coefficients are anti-correlated with spiking activity. In the scatter plots below, each component is shown as an axis and each trial is plotted as a point within the three dimensions. Exemplar trials are highlighted and shown in insets with spike rate over time. (B) shows how the component weights (boxes) scale the component shapes to describe the features of the mean firing rate of an example channel. The corresponding blue and green arrows point to the deviations in mean firing rate while the purple arrow and line generally indicate the background firing rate that are captured by the respective component and its weight. (C) shows the reconstruction (shaded yellow) of the mean spike rate of an example channel (black line) using the descriptive weightings of the independent components.
Figure 5
Figure 5
The average scores of Solenoid and ICMS + Solenoid trials in each area. Each channel’s spike rate, averaged across an experimental block, is plotted on the second and third component axes based on its score. Channels in RFA are shown as blue and those in S1 are pink. Examples of the average channel spike rates are outlined in black and shown in the subpanels. (a) and (b) two different channels within S1 of the same rat showing different response profiles. (c) channel in S1 of the rat with the largest lesion volume highlighting a smaller first peak. (d) channel in RFA showing a single evoked peak. (e) and (f) the same channels in panels (a) and (d), respectively, during ICMS + Solenoid trials.
Figure 6
Figure 6
Combined independent component analysis of the sensory response and its modulation. (A) shows the mean weights of the components sorted by stimulation type and area which are displayed in (B). Positive values point to the presence of that component in the response while negative values indicate an inverse relationship; the error bars show the standard error of the mean. (C) displays the prediction of area and lesion volume for component 2 and 3 scores by the GLME model as compared to a linear fit. (D) highlights the changes in the component scores between Solenoid (yellow) and ICMS + Solenoid trials (purple) for each channel in an experimental block of an exemplar animal. (E) shows the reconstructed rates for each stimulation type by area. The mean component scores were used to weight each component and reconstruct the average response in spiking to stimulation.

Update of

Similar articles

Cited by

References

    1. Averna A., Hayley P., Murphy M. D., Barban F., Nguyen J., Buccelli S., et al. . (2021). Entrainment of network activity by closed-loop microstimulation in healthy ambulatory rats. Cereb. Cortex 31, 5042–5055. doi: 10.1093/cercor/bhab140, PMID: - DOI - PMC - PubMed
    1. Barbay S., Guggenmos D. J., Nishibe M., Nudo R. J. (2013). Motor representations in the intact hemisphere of the rat are reduced after repetitive training of the impaired forelimb. Neurorehabil. Neural Repair 27, 381–384. doi: 10.1177/1545968312465193, PMID: - DOI - PMC - PubMed
    1. Bedwell S. A., Billett E. E., Crofts J. J., Tinsley C. J. (2014). The topology of connections between rat prefrontal, motor and sensory cortices. Front. Syst. Neurosci. 8:00177. doi: 10.3389/fnsys.2014.00177, PMID: - DOI - PMC - PubMed
    1. Biernaskie J., Chernenko G., Corbett D. (2004). Efficacy of rehabilitative experience declines with time after focal ischemic brain injury. J. Neurosci. 24, 1245–1254. doi: 10.1523/jneurosci.3834-03.2004, PMID: - DOI - PMC - PubMed
    1. Bundy D. T., Guggenmos D. J., Murphy M. D., Nudo R. J. (2019). Chronic stability of single-channel neurophysiological correlates of gross and fine reaching movements in the rat. PLoS One 14:e0219034. doi: 10.1371/journal.pone.0219034, PMID: - DOI - PMC - PubMed