

One piece of the puzzle: Modeling vector presence and environment reveals seasonality, distribution, and prevalence of sandflies and Leishmania in an expansion area
- PMID: 37332885
- PMCID: PMC10273283
- DOI: 10.1016/j.onehlt.2023.100581
One piece of the puzzle: Modeling vector presence and environment reveals seasonality, distribution, and prevalence of sandflies and Leishmania in an expansion area
Abstract
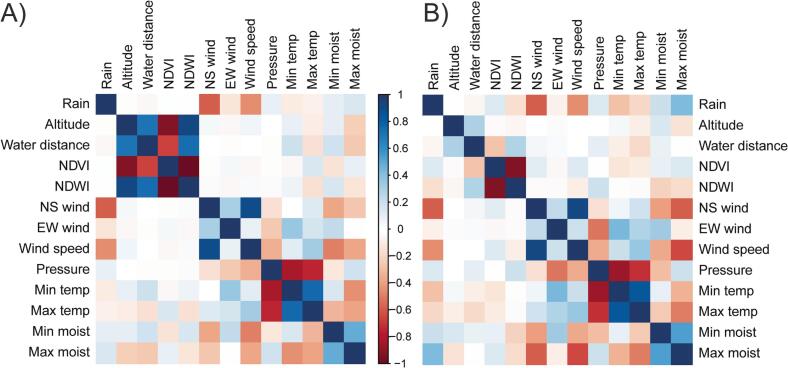
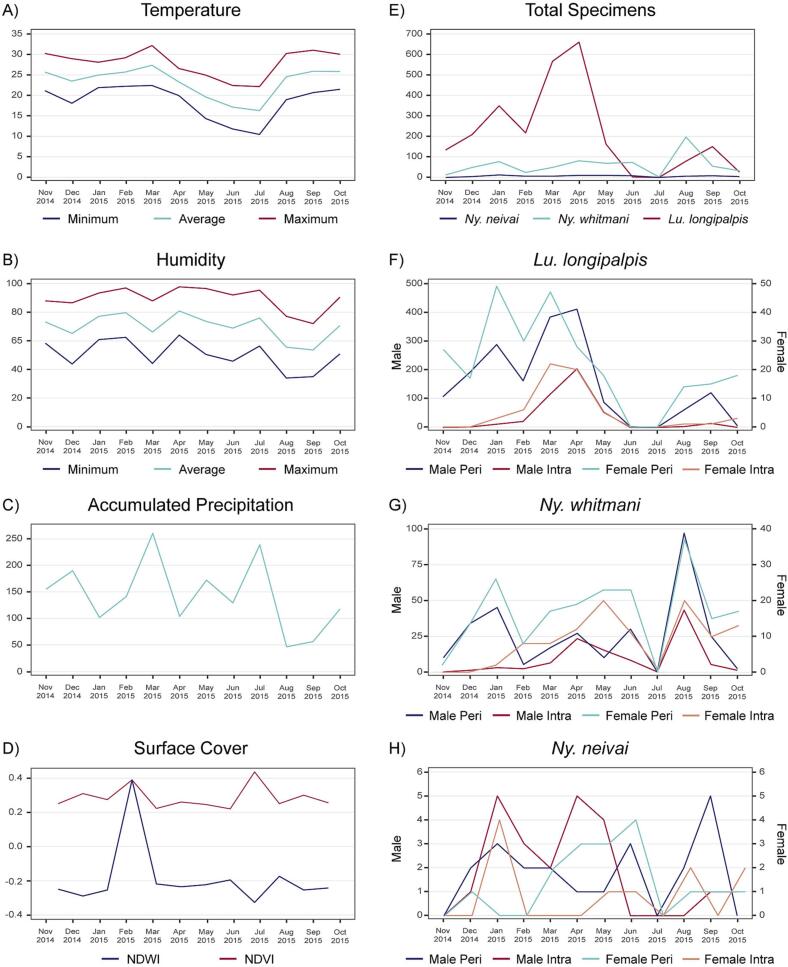
The recent geographic spread of Leishmania infantum along the borders of Argentina, Brazil and Paraguay has been highlighted. In our previous study, Lutzomyia longipalpis was found in 55 of 123 patches surveyed, and in some patches, sandflies were found at higher densities, forming hotspots. Based on the One Health approach, we investigated the seasonality of the vector, the presence of parasite DNA, and the environmental factors that contribute to vector and parasite dispersal in these previously described hotspots in Foz do Iguaçu, Brazil. Entomological surveys were conducted monthly for one year. Fourteen hotspots peridomicile and six intradomicile were sampled. PCR was used to assess the prevalence of Leishmania DNA in sandflies. Zero-inflated negative binomial regression was used to determine the association of micro- and mesoscale environmental variables with the occurrence and abundance of the three most abundant sandfly species sampled. A total of 3543 species were captured, with Lutzomyia longipalpis being the predominant species (71.78%) of the 13 species found. Evandromyia edwardsi, Expapillata firmatoi, Micropygomyia ferreirana and Pintomyia christenseni were reported for the first time in the region. NDVI, distance to water, precipitation, west-to-east wind, wind speed, maximum and minimum relative humidity, and sex were significant variables associated with vector presence/abundance in the environment. Vector presence/abundance in the peridomicile was associated with precipitation, altitude, maximum temperature, minimum and maximum relative humidity, west-to-east wind, wind speed, and sex. Leishmania DNA was detected in an average of 21% of Lu. longipalpis throughout the year. Vector abundance is concentrated in urban and peri-urban areas, with some specimens present in different parts of the city and some sites with high vector abundance. This distribution suggests that the risk of actual contact between humans and parasite vectors in urban areas during the epidemic period is associated with patches of peri-urban vegetation and then extends into urban areas.
Keywords: Dispersion; Environment; Epidemiology; Leishmaniasis; Modeling; Psychodidae.
© 2023 The Authors.
Conflict of interest statement
The authors declare that they have no known competing financial interests or personal relationships that could have appeared to influence the work reported in this paper.
Figures


Similar articles
-
Multiscale environmental determinants of Leishmania vectors in the urban-rural context.Parasit Vectors. 2020 Oct 2;13(1):502. doi: 10.1186/s13071-020-04379-6. Parasit Vectors. 2020. PMID: 33008441 Free PMC article.
-
Analysis of sandflies (Diptera: Psychodidae) in Barra do Garças, State of Mato Grosso, Brazil, and the influence of environmental variables on the vector density of Lutzomyia longipalpis (Lutz & Neiva, 1912).Rev Soc Bras Med Trop. 2012 Jun;45(3):313-7. doi: 10.1590/s0037-86822012000300007. Rev Soc Bras Med Trop. 2012. PMID: 22760128
-
Hidden danger: Unexpected scenario in the vector-parasite dynamics of leishmaniases in the Brazil side of triple border (Argentina, Brazil and Paraguay).PLoS Negl Trop Dis. 2018 Apr 6;12(4):e0006336. doi: 10.1371/journal.pntd.0006336. eCollection 2018 Apr. PLoS Negl Trop Dis. 2018. PMID: 29624586 Free PMC article.
-
Predominance of Leishmania (Leishmania) amazonensis DNA in Lutzomyia longipalpis sand flies (Diptera: Psychodidae) from an endemic area for leishmaniasis in Northeastern Brazil.Rev Inst Med Trop Sao Paulo. 2022 May 6;64:e32. doi: 10.1590/S1678-9946202264032. eCollection 2022. Rev Inst Med Trop Sao Paulo. 2022. PMID: 35544910 Free PMC article.
-
Lutzomyia longipalpis, Gone with the Wind and Other Variables.Neotrop Entomol. 2021 Apr;50(2):161-171. doi: 10.1007/s13744-020-00811-9. Epub 2020 Aug 25. Neotrop Entomol. 2021. PMID: 32840741 Review.
Cited by
-
Diversity, Leishmania detection, and blood meal sources of sand flies from Iguatama, Minas Gerais, Brazil.PLoS One. 2024 May 23;19(5):e0302567. doi: 10.1371/journal.pone.0302567. eCollection 2024. PLoS One. 2024. PMID: 38781235 Free PMC article.
References
-
- Patz J.A., Daszak P., Tabor G.M., Aguirre A.A., Pearl M., Epstein J., Wolfe N.D., Kilpatrick A.M., Foufopoulos J., Molyneux D., Bradley D.J., Amerasinghe F.P., Ashford R.W., Barthelemy D., Bos R., Bradley D.J., Buck A., Butler C., Chivian E.S., Chua K.B., Clark G., Colwell R., Confalonieri U.E., Corvalan C., Cunningham A.A., Dein J., Dobson A.P., Else J.G., Epstein J., Field H., Furu P., Gascon C., Graham D., Haines A., Hyatt A.D., Jamaluddin A., Kleinau E.F., Koontz F., Koren H.S., LeBlancq S., Lele S., Lindsay S., Maynard N., McLean R.G., McMichael T., Molyneux D., Morse S.S., Norris D.E., Ostfeld R.S., Pearl M.C., Pimentel D., Rakototiana L., Randriamanajara O., Riach J., Rosenthal J.P., Salazar-Sanchez E., Silbergeld E., Thomson M., Vittor A.Y., Yameogo L., Zakarov V. Unhealthy landscapes: policy recommendations on land use change and infectious disease emergence. Environ. Health Perspect. 2004;112 doi: 10.1289/ehp.6877. - DOI - PMC - PubMed
-
- PAHO Leishmaniasis: Epidemiological Report of the Americas, No. 10. 2021. https://iris.paho.org/handle/10665.2/55368?show=full Washington, D.C., 2021. (accessed August 5, 2022)
-
- Wagner F.E., Ward J.O. Urbanization, and migration in Brazil. Am J Econ Sociol. 1980;39:249–259.
LinkOut - more resources
Full Text Sources
Miscellaneous
