. 2023 Jun 9:2023:2480493.
doi: 10.1155/2023/2480493. eCollection 2023.

Fibroblast Activation Protein Expression in Sarcomas

Affiliations

Fibroblast Activation Protein Expression in Sarcomas

Jacquelyn N Crane et al. Sarcoma. .

Abstract

Objectives: Fibroblast activation protein alpha (FAP) is highly expressed by cancer-associated fibroblasts in multiple epithelial cancers. The aim of this study was to characterize FAP expression in sarcomas to explore its potential utility as a diagnostic and therapeutic target and prognostic biomarker in sarcomas.

Methods: Available tissue samples from patients with bone or soft tissue tumors were identified at the University of California, Los Angeles. FAP expression was evaluated via immunohistochemistry (IHC) in tumor samples (n = 63), adjacent normal tissues (n = 30), and positive controls (n = 2) using semiquantitative systems for intensity (0 = negative; 1 = weak; 2 = moderate; and 3 = strong) and density (none, <25%, 25-75%; >75%) in stromal and tumor/nonstromal cells and using a qualitative overall score (not detected, low, medium, and high). Additionally, RNA sequencing data in publicly available databases were utilized to compare FAP expression in samples (n = 10,626) from various cancer types and evaluate the association between FAP expression and overall survival (OS) in sarcoma (n = 168).

Results: The majority of tumor samples had FAP IHC intensity scores ≥2 and density scores ≥25% for stromal cells (77.7%) and tumor cells (50.7%). All desmoid fibromatosis, myxofibrosarcoma, solitary fibrous tumor, and undifferentiated pleomorphic sarcoma samples had medium or high FAP overall scores. Sarcomas were among cancer types with the highest mean FAP expression by RNA sequencing. There was no significant difference in OS in patients with sarcoma with low versus high FAP expression.

Conclusion: The majority of the sarcoma samples showed FAP expression by both stromal and tumor/nonstromal cells. Further investigation of FAP as a potential diagnostic and therapeutic target in sarcomas is warranted.


Conflict of interest statement

F.C.E. is on the Scientific Advisory Board of Certis Oncology. T.G.G. has consulting and equity agreements with Auron Therapeutics, Boundless Bio, Coherus BioSciences, and Trethera Corporation. The authors declare that they have no conflicts of interest.

Figures
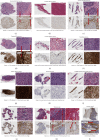
Figure 1
Figure 1
Representative H&E and FAP IHC images. In panels a–j, top images show low and high power views of H&E slide and bottom images show low and high power views of FAP stained slide. In panel (k), top left shows low power view of H&E slide, top middle shows high power view of H&E slide, bottom left shows low power view of FAP stained slide, bottom middle shows high power view of FAP stained slide, and top and bottom right shows high power view of FAP stained slide with arrows pointing to blood vessels. In panel (l), top image shows low power view of FAP stained slide and bottom image shows high power view of FAP stained slide. Scale bars are shown for each image. (a) A case of ASPS (FAP.ASPS.2.primary) with FAP staining in both tumor and stromal cells; (b) normal tissue adjacent to the ASPS case shown in panel A (FAP.ASPS.2.normal) with low intensity FAP staining in some stromal cells; (c) a case of ASPS (FAP.ASPS.3.primary) with FAP staining most notable in stromal cells; (d) a case of DF (FAP.DF.3.primary) with intense and dense FAP staining; (e) normal adjacent tissue to the DF case shown in panel D without FAP staining; (f) a case of myxofibrosarcoma (FAP.MFS.4.primary.1) with intense and dense FAP staining seen in the majority of the sample; (g) SFT case (FAP.SFT.5.primary) with intense and dense FAP staining seen in the majority of the cells; (h) a case of SS (FAP.SS.1.recurrence) without FAP staining; (i) a case of UPS (FAP.UPS.4.primary) with intense and dense FAP staining seen in the majority of the sample; (j) a case of UPS (FAP.UPS.1.primary) with dense FAP staining seen in the majority of the sample with higher intensity in stromal cells compared to tumor cells; (k) a case of osteosarcoma (FAP.OS.4.primary.2) with FAP staining that is most notable in stromal cells sections around blood vessels; and (l) colon cancer positive control.
Figure 2
Figure 2
FAP scores by diagnosis and sample type. In each subfigure, a dot represents an individual sample; dots are offset from center to enable visualization of each individual sample. (a) FAP overall scores (none detected, low, medium, and high) are shown by diagnosis. (b-c) FAP scores are shown by sample type (normal tissue adjacent to tumor, primary tumor, and metastatic tumor) with FAP overall scores shown in panel b; FAP intensity scores (0, 1, 2, and 3) shown in panel c; and FAP density scores (none detected, <25%, 25-75%, and >75%) shown in panel d.
Figure 3
Figure 3
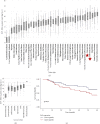
FAP gene expression by RNA sequencing from TCGA, TARGET, and Sayles et al. (a) FAP gene expression across multiple cancer types. Log transformed upper quartile normalized counts (log2(x + 1)) are shown. The tumor types were ranked by mean expression and then displayed in order from lowest to highest mean expression from left to right. (b) FAP gene expression by RNA sequencing across sarcoma subtypes. (c) Kaplan–Meier plot of OS based on FAP expression for subjects for whom both toil processed RNA sequencing data and survival data are available. OS is shown for those with FAP expression in the upper (n = 42) and lower quartiles (n = 42).

References

    1. Fletcher C. D. M. B. J., Hogendoorn P. C. W., Mertens F. World Health Organization Classification of Tumours of Soft Tissue and Bone . 4. Lyon, France: International Agency for Research on Cancer Press; 2013.
    1. Siegel R. L., Miller K. D., Jemal A. Cancer statistics. CA: A Cancer Journal for Clinicians . 2019;69(1):7–34. doi: 10.3322/caac.21551. - DOI - PubMed
    1. Federman N. V. D. E., Bernthal N. Lanzkoswky’s Manual of Pediatric Hematology and Oncology . Amsterdam, Netherlands: Elsevier; 2016. Malignant bone tumors; pp. 523–543.
    1. Fein Levy C. W. L. Lanzkoswky’s Manual of Pediatric Hematology and Oncology . Amsterdam, Netherlands: Elsevier; 2016. Rhabdomyosarcoma andf other soft-tissue sarcomas; pp. 505–523.
    1. National Cancer Institute. Surveillance, Epidemiology and End Results Program . National Cancer Institute; 2019. https://seer.cancer.gov/statfacts/