[Preprint]. 2023 Jun 7:2023.06.06.543963.
doi: 10.1101/2023.06.06.543963.

The full spectrum of OCT1 (SLC22A1) mutations bridges transporter biophysics to drug pharmacogenomics

Affiliations

The full spectrum of OCT1 (SLC22A1) mutations bridges transporter biophysics to drug pharmacogenomics

Sook Wah Yee et al. bioRxiv. .

Update in

Abstract

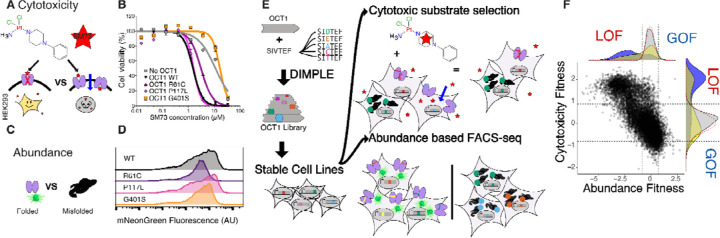
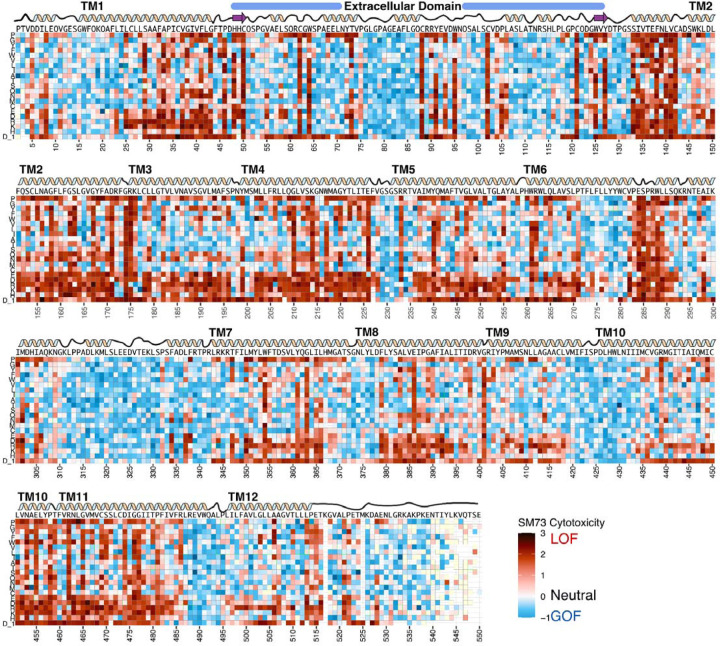
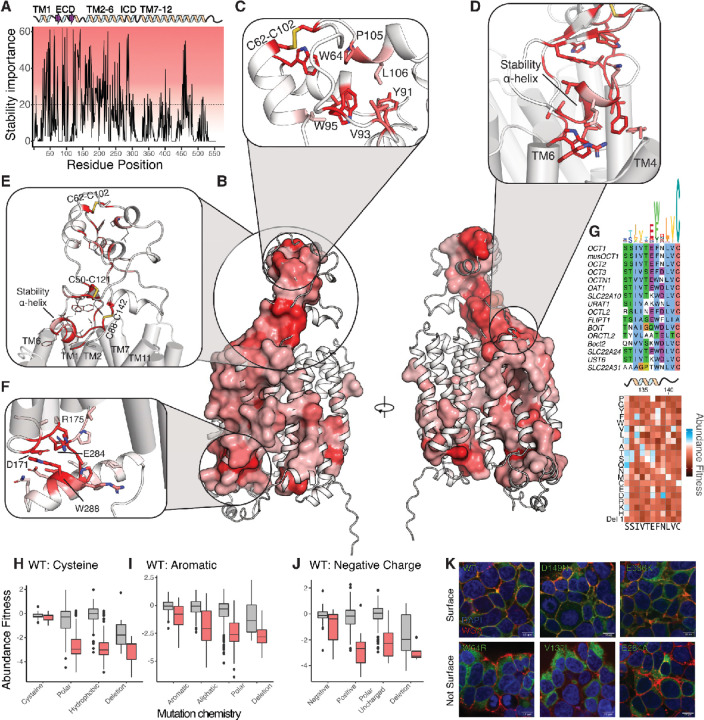
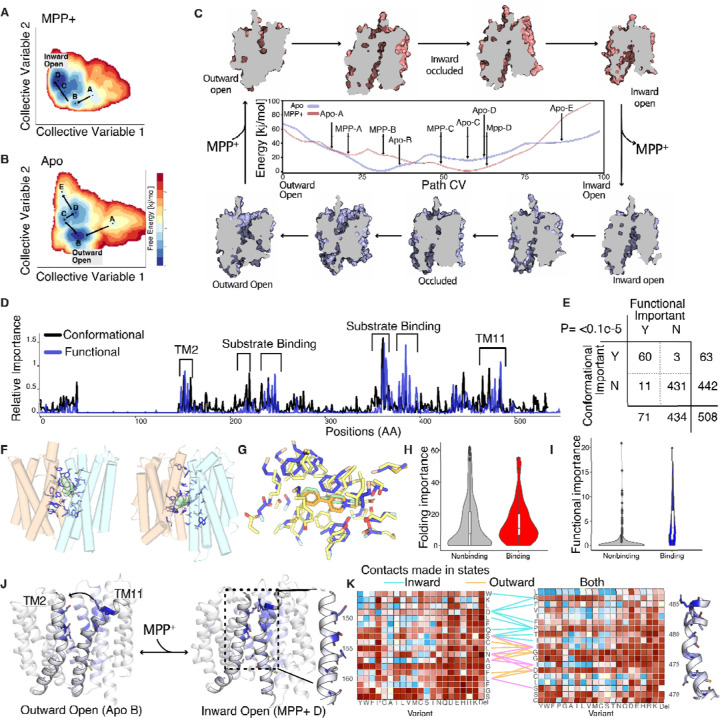
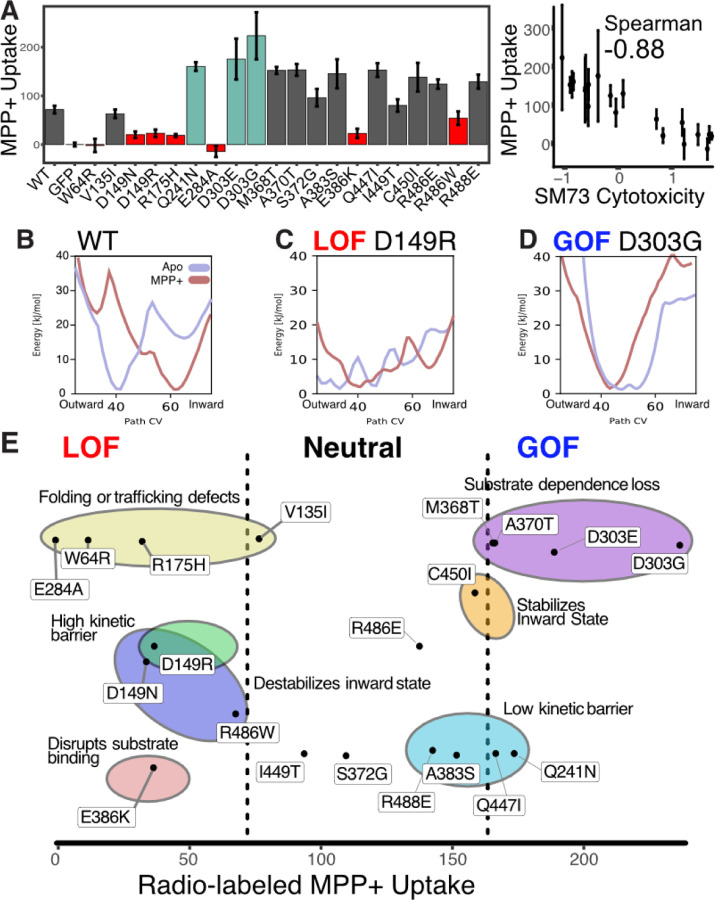
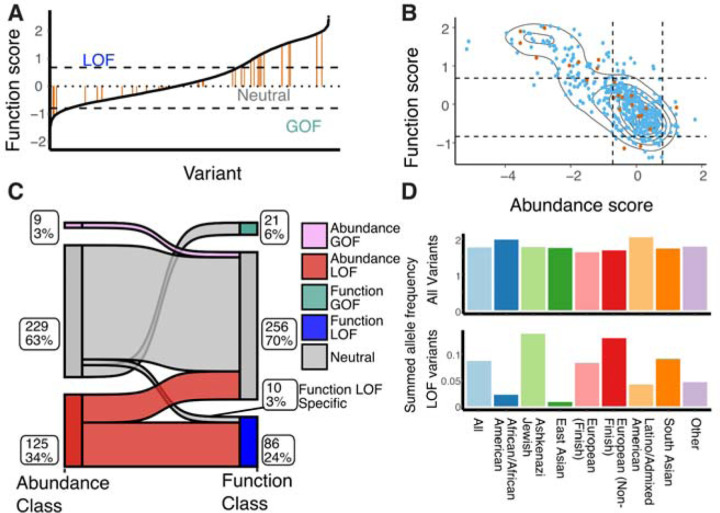
Membrane transporters play a fundamental role in the tissue distribution of endogenous compounds and xenobiotics and are major determinants of efficacy and side effects profiles. Polymorphisms within these drug transporters result in inter-individual variation in drug response, with some patients not responding to the recommended dosage of drug whereas others experience catastrophic side effects. For example, variants within the major hepatic Human organic cation transporter OCT1 (SLC22A1) can change endogenous organic cations and many prescription drug levels. To understand how variants mechanistically impact drug uptake, we systematically study how all known and possible single missense and single amino acid deletion variants impact expression and substrate uptake of OCT1. We find that human variants primarily disrupt function via folding rather than substrate uptake. Our study revealed that the major determinants of folding reside in the first 300 amino acids, including the first 6 transmembrane domains and the extracellular domain (ECD) with a stabilizing and highly conserved stabilizing helical motif making key interactions between the ECD and transmembrane domains. Using the functional data combined with computational approaches, we determine and validate a structure-function model of OCT1s conformational ensemble without experimental structures. Using this model and molecular dynamic simulations of key mutants, we determine biophysical mechanisms for how specific human variants alter transport phenotypes. We identify differences in frequencies of reduced function alleles across populations with East Asians vs European populations having the lowest and highest frequency of reduced function variants, respectively. Mining human population databases reveals that reduced function alleles of OCT1 identified in this study associate significantly with high LDL cholesterol levels. Our general approach broadly applied could transform the landscape of precision medicine by producing a mechanistic basis for understanding the effects of human mutations on disease and drug response.


Conflict of interest statement

Competing interests The authors declare they have no competing interests.

Figures

Figure 1.
Figure 1.. Workflow for multiparametric deep mutational scan of OCT1
(A) Cytotoxic OCT1 substrates such as SM73 enable negative selection screens for OCT1 function in HEK293 cells. (B) OCT1 variants have different sensitivity to Cisplatin analog SM85, allowing a fitness gradient. (C) A split fluorescent protein-based readout for variant abundance can be used to distinguish folded vs misfolded forms of OCT1 as demonstrated (D) in flow cytometry experiments where loss of transport variants from cytotoxicity screening have diminished fluorescence. (E) We generated an OCT1 deep mutational scanning library with our DIMPLE protocol, produced stable cell lines, and conducted parallel abundance and cytotoxicity selection screens to determine the functional impacts of variants, yielding (F) a multiparametric fitness landscape for 11,213 OCT1 mutants: x-axis, abundance score, and y-axis, cytotoxicity scores, with density plots indicating classes of mutations including synonymous (grey), missense (yellow), and single codon deletion (purple). Cutoffs for loss and gain of function for both phenotypes are indicated by a dotted line, which were determined using a 2 standard deviations from normal distribution fit upon synonymous variant’s distributions.
Figure 2.
Figure 2.. Heatmap of OCT1 cytotoxicity deep mutational scan.
Cytotoxicity screen fitness effects depicted as a heatmap, with (x-axis) residue position versus (y-axis) mutation identity. In this assay, loss of transport activity (relative to wildtype) reduces the uptake of a cytotoxic substrate, thus increasing abundance (positive score, more red) while gain of transport increases substrate uptake, which decreases abundance (negative score, more blue). Above, wildtype sequence and cartoon representation of secondary structure elements of OCT1. Missing data in light yellow.
Figure 3.
Figure 3.. OCT1 folding determinants revealed by mutational scan.
Stability importance scores plotted across OCT1 positions (with a simplified architecture above) suggests that TM1–6 are the primary determinants of stability and folding. Dotted line indicates threshold for identifying stability determinants. (B) Mapping the stability determinant scores mapped onto the OCT1 AlphaFold2 model reveals a dense network of residues connecting the cytosolic transmembrane bundles with the extracellular domain. Residues with stability importance scores above the cutoff in A are shown as a surface. (C) In the extracellular domain, the distinct fold has a hydrophobic core composed of aromatics and disulfide bonds which have strong impacts on stability. (D-E) A dense network of disulfides, aromatics, and other residues connect the transmembrane domains to the ECD via a stabilizing alpha helix, which interacts with the tops of TMs 4 and 6. (F) A series of charged residues are highly important for stability and folding among the cytoplasmic termini of TM1–6. (G) Multiple sequence alignment of the stability helix with a sequence logo above with height corresponding to information content. Below: experimental VAMP-seq scores for the region of OCT1. (H-J) Positions with high folding importance (red boxplots) show more sensitivity to changes of physical chemistry than other positions (gray boxplot): the abundance scores of WT cysteine, aromatic, or negatively charged residues show larger effects of changes to physical chemistry in regions of higher importance, characteristic of folding determinants. (K) Confocal microscopy validation of trafficking phenotypes of variants from abundance screen. Using EGFP-tagged OCT1 (green), cellular localization and expression are determined using nuclear stain (DAPI, blue) and cell surface stain (WGA-Alexa Fluor 647, red). Variants with low abundance identified in our screen (W64R, V135I, E284A) have commensurate low surface trafficking whereas WT and WT-like variants (D149N and E386K) are properly expressed and trafficked to the surface.
Figure 4.
Figure 4.. A structure-function model determined with computational structural biology and functional DMS experiment.
(A-B) 2D conformational landscapes of apo and MPP+-bound OCT1 determined using MD simulations enhanced using collective variables derived from coevolutionary-based neural networks initiated from the AlphaFold2 model. The free energy landscapes are projected onto a 2-dimensional collective variable space combining contributions from residue-residue contacts specific to outward- or inward-facing states. Letters indicate the local minima in the free energy landscapes corresponding to ensembles of metastable configurations.. The paths between states are indicated with arrows leading from the outward-open to the inward-open state. (C) The full modeled conformational cycle of OCT1 going from MPP+-bound (pink) outward open (top left) to MPP+-bound inward open (top right), then following substrate release (purple), the inward open apo (bottom right) to outward open apo state (bottom left). In the center is a 1D projection of the energy landscapes from panels A and B, with the x-axis depicting a path collective variable representing the progression of the transporter from the outward-open to the inward-open states. The apo landscape is in light blue and MPP+-bound state is in light red. Indicated on the landscape are where each of the modeled states are in relation to the 1D representation in panels A,B. (D) DMS-based functional (blue) and MD-based conformational (black) importance scores plotted across the OCT1 sequence. (E) Truth table comparison across conformation and functional importance classes with a two-sided Fisher exact test showing strong significance, P Value= <0.1E-5. (F) Examination of substrate binding. Residues within 5 Å of the substrate (MPP+, in green) in any state are depicted in blue with sidechains and defined as substrate-binding residues. (G) The outward MPP+-bound state, MPP-B with residues in blue and substrate in green, overlaid with solved experimental structure, 8ET9, with residues in yellow and substrate in orange demonstrate remarkable similarities in MPP+ poses and residue placement. Residues for (H-I) A comparison of substrate-binding residues (as defined in F) with folding (H, in red) or functional importance (I, in blue) shows that MD-derived categorization and DMS-derived classification agree. (J) The interface between transmembrane helices 2 and 11 is highlighted here due to both their large conformational changes in the structure and enrichment of functionally important residues. Outward open and inward open states are shown with functional importance plotted and high functional importance residues modeled. (K) Examination of the functional heatmap for the TM2–11 interface suggests the physical logic of state-dependent interactions in OCT1. Contacts between Cα atoms within 8 Å in inward-open (cyan), outward-open (wheat), or both (magenta) states are indicated.
Figure 5
Figure 5. Biophysical basis of mutations on OCT1 function.
(A) Radio-labeled MPP+ uptake experiments for a subset of mutations across a range of fitness mechanisms and effects. Left, mean experimental uptake across 3 replicates (mean with error bars, SEM). Right, correlation between SM73 cytotoxicity fitness scores and radio-labeled MPP+ uptake scores (error bars, SEM), with rankorder Spearman correlation coefficient shown. (B-D) 1D free energy landscapes of the rocker-switch motion for WT, loss of function mutant D149R, and gain of function mutant D303G. Apo landscapes are in light blue and MPP+-bound in light red. (E) Mechanistic basis of mutational impact on OCT1. Mutations are plotted based on their MPP+ uptake scores and classified based on loss of function or gain of function using the high-throughput screen results. Mechanistic classifications inferred from their respective free-energy landscapes (Methods) are grouped within colored circles.
Figure 6
Figure 6. Mechanism of action of OCT1 polymorphisms.
(A) Distribution of previously characterized human polymorphisms from gnomAD (39 variants, orange) among the total set from this work is shown among the rank-ordered set of all 515 gnomAD variants. Cutoffs are shown based on the synonymous mutation distributions as dotted lines. (B) Abundance and function scores plotted for all human variants, showing previously-studied variants (orange) among all previously uncharacterized (blue). Cutoffs are shown based on synonymous mutation distribution as dotted lines. (C) Classification of human variants by their predicted impact based on synonymous-derived cutoffs. The diagram shows how observed functional variation (right) is conditioned on abundance impacts (left). Numbers and percentages of variants within each group are next to the respective subpopulation. Flows between classes suggest the interaction between abundance and function. (D) Summed allele frequencies across populations with differing ancestry within gnomAD reveal the utility of functional annotation for understanding human variation. Across all variants, all groups have similar alternative allele frequencies (top), but looking at only loss of function variants reveals large differences (bottom).

Similar articles

References

    1. Amorosi C.J. et al. (2021) ‘Massively parallel characterization of CYP2C9 variant enzyme activity and abundance’, American journal of human genetics, 108(9), pp. 1735–1751. Available at: 10.1016/j.ajhg.2021.07.001. - DOI - PMC - PubMed
    1. Burckhardt G. and Wolff N.A. (2000) ‘Structure of renal organic anion and cation transporters’, American journal of physiology. Renal physiology, 278(6), pp. F853–66. Available at: 10.1152/ajprenal.2000.278.6.F853. - DOI - PubMed
    1. Bushnell B. (2014) ‘BBTools software package’.
    1. Bycroft C. et al. (2018) ‘The UK Biobank resource with deep phenotyping and genomic data’, Nature, 562(7726), pp. 203–209. Available at: 10.1038/s41586-018-0579-z. - DOI - PMC - PubMed
    1. Cheng Y. (2018) ‘Membrane protein structural biology in the era of single particle cryo-EM’, Current opinion in structural biology, 52, pp. 58–63. Available at: 10.1016/j.sbi.2018.08.008. - DOI - PMC - PubMed

Publication types